Bespoke’s Morning Lineup – 7/20/21 – Do Over
See what’s driving market performance around the world in today’s Morning Lineup. Bespoke’s Morning Lineup is the best way to start your trading day. Read it now by starting a two-week free trial to Bespoke Premium. CLICK HERE to learn more and start your free trial.
“The definition of insanity is doing the same thing over and over again, but expecting different results.“ – Albert Einstein
While it wasn’t the only factor behind yesterday’s decline, a key event that spooked many investors (and computers) was a comment from UK Chief Scientific Adviser Sir Patrick Wallace who said that 60% of UK COVID hospitalizations were fully vaccinated. Later in the day, shortly before the US close, he clarified his remarks to say that his numbers were reversed and that less than 40% of all hospitalizations were fully vaccinated. That was a pretty big error, but one that caused some relief on the part of investors as stocks finished off their lows of the afternoon.
Today, futures are higher again, but still well below where they closed Friday. Rising COVID cases have been one driver of the weakness but not the only headwind facing the market. In the short term, investors will also have to contend with weak seasonal trends as well as high expectations heading into earnings season.
Read today’s Morning Lineup for a recap of all the major market news and events from around the world, the latest US and international COVID trends including our vaccination trackers, and much more.

One thing that’s been happening over and over again in the market is that every time the S&P 500 tests its 50-day moving average (DMA), it has managed to bounce. Over the last year, there have only been two times where the S&P 500 closed below its 50-DMA and continued to decline meaningfully from there. Both of those occurrences were last year. Before yesterday, there were six other times this year where the 50-DMA came into play and each time the S&P 500 bounced significantly from there. Obviously, this can’t keep going on forever, but in the short-term, but until it doesn’t work anymore, the ‘buy the dippers’ will likely stick with what has worked.

Stocks For the COVID Economy Check Up
In early March of last year, we highlighted an initial basket of stocks whose businesses aligned with pandemic trends which we aptly named: Stocks for the COVID Economy. We have periodically checked back in on these stocks since initially debuting the list, and seeing as COVID fears are once again a driver of price action again today, we thought we would check back in on the stocks for the COVID economy.
While the S&P 500 is set to close down roughly 2% on the day, the stocks listed in the table are down an average of just 2 basis points. A third of the stocks listed are in the green on the day even though the S&P 500’s net advance/decline reading is -437. Stay-at-home names like Chewy (CHWY), Peloton (PTON), Teladoc (TDOC), and Chegg (CHGG) are all leading the way higher today with gains of more than 2%. MarineMax (HZO), FedEx (FDX), Regeneron (REGN), DR Horton (DHI), and Campbell Soup (CPB) are all higher on the day as well. If it were not for its Five9 (FIVN) acquisition announcement, we think Zoom (ZM) would likely also be higher. Click here to view Bespoke’s premium membership options.

Homebuilder Sentiment Strong But Sliding
Homebuilder sentiment peaked back in November with the NAHB’s Housing Market index topping out at 90. In the time since then, it has reversed lower by 10 points to 80 this month with higher prices and various shortages being the main reason reported by the NAHB for the decline. The drop leaves the index at the lowest level since last August, although it’s still above any pre-pandemic reading. In short, homebuilders remain historically optimistic but not to the same extent that they were in late 2020.
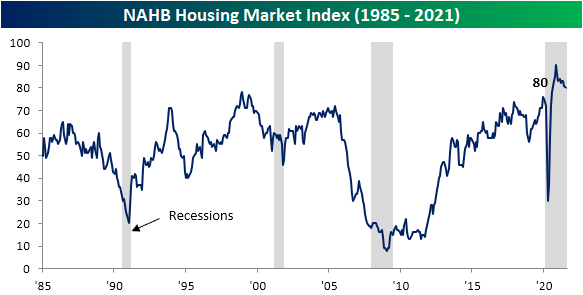
Playing into that decline in the headline number was a single point drop in Present Sales and a much larger six point decline in Traffic. The Present Sales index, which has the highest weighting on the headline number at nearly 60%, fell to 86 which ties the pre-pandemic record high from December 1998. The Traffic Index holds the second-largest weight at roughly 27%, and its larger decline was the main driver of the overall drop in sentiment. This month’s decline was particularly large ranking in the 3rd percentile of all monthly moves. Although traffic has moved sharply lower, it too remains healthier than any period prior to the pandemic. One other silver lining is that Future Sales rose 2 points to move back above 80. While that is far from setting any sort of new high as the index still needs to climb another eight points to reach its record, it does point to some improvement in homebuilder outlook.

Looking across each of the four regions broken up by the report, only the Midwest saw an overall improvement in July whereas each of the others fell by 2 points. Once again, those drops still leave the indices at historically solid levels.

Even though the NAHB’s reading on homebuilder sentiment headed lower once again this month and there is a broader weakness across equities today, the S&P Homebuilders (XHB) has managed to so far hold up at support. As shown below, XHB tested support at the June low near $69 on the initial drop at this morning’s lows. That will continue to be a level to watch going forward, although it is also in a bit of a no man’s land. XHB currently finds itself smack dab between its 50 and 200-DMAs.

As for any catalysts to change that, hard data on housing starts will be released tomorrow and earnings are certainly another. As shown in the snapshot of our Earnings Explorer tool below, there are a handful of XHB stocks scheduled to report over the next week, and many others are also scheduled over the next few weeks. For the most part, these stocks have averaged positive reactions to earnings with D.R. Horton (DHI) averaging the strongest stock price reaction of any of those reporting this week. Click here to view Bespoke’s premium membership options.

Small Caps Enter Correction Territory
While the S&P 500 may still be within a couple of a percent of its record high from a week ago today, the magnitude of the decline in small caps has been much larger. While it has seen a bit of a bounce intraday, at the open today, the Russell 2000 was down over 10% from its record closing high in mid-March. While the Russell 2000 is one of the worst-performing US indices in recent months, it remains within the range it has been trading in all year.
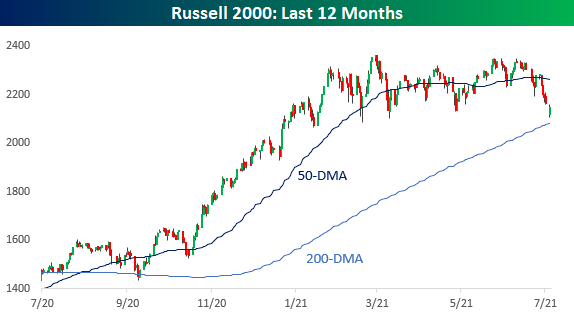
From a technical perspective, we consider a correction to be any decline of 10% (on a closing basis) from a closing high without a rally of 10% in between. While the Russell 2000 was down 10% earlier today, if the current levels hold, it won’t quite reach the correction threshold on a closing basis. In the chart below, we show every correction for the Russell 2000 going back to 1980 and its magnitude in percentage terms. During this time, the Russell 2000’s average decline during a correction has been 18.2% (median: 15.4%), so with the current decline currently not even at 10%, there’s a decent amount of room between here and average levels.

While we may not be there in terms of the size of the decline, in terms of duration, the current period is already well above average. The Russell’s closing high was all the way back on March 15th, so even if the decline ended today, it would be 126 calendar days, or more than 50 days longer than the average of 73 days and double the median of 63 days.
In the chart below, we show Russell 2000 corrections in terms of their duration in calendar days. What’s really interesting to note about the current period is that at 126 days, it already would rank as the 7th longest correction in the Russell’s history. When it comes to corrections, we always highlight that they can occur in terms of both time and/or price. For the current period, it has certainly been a combination of the two, but to this point, it has been more centered on time than on price. Click here to view Bespoke’s premium membership options.

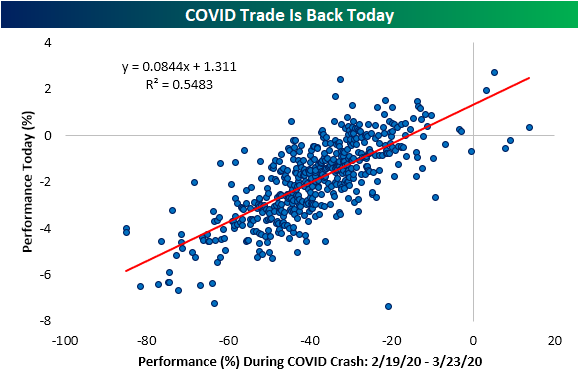
The COVID Trade Is Back
Each of the major indices are down well over 1% with the Dow and small-cap Russell 2,000 down even more having fallen over 2% as of this writing. Meanwhile, Treasury yields are falling and at multi-month lows. The main reason being attributed to the risk-off move today is jitters over the rising prevalence of the Delta variant. To give some evidence to this being the catalyst, in the chart below we show the relationship between individual S&P 500 stocks’ performance today and back during the COVID crash from February 19th to March 23rd of last year. As shown, there is a general correlation that exists between the performance of the two periods. Some of the best performers today were also some of the best performers during the crash and vice versa. For example, Consumer Staples was the sector that held up the best during the COVID Crash last year with the average stock in the sector falling 24.04% versus an average decline of 38.7% for the entirety of the S&P 500. Today, several of the sector’s names are the top performers on the day as the average stock in the sector is only down 19 bps versus an average decline of nearly 2% for all S&P 500 stocks. Click here to view Bespoke’s premium membership options.
Bespoke’s Morning Lineup – 7/19/21 – 1.23%
See what’s driving market performance around the world in today’s Morning Lineup. Bespoke’s Morning Lineup is the best way to start your trading day. Read it now by starting a two-week free trial to Bespoke Premium. CLICK HERE to learn more and start your free trial.
“Change before you have to.” – Jack Welch
It’s not looking like a fun start to the trading week for bulls. After falling 300 on Friday, Dow futures have already tacked on another 500 points to that drop and we’re still an hour from the open! S&P 500 and Nasdaq futures are down by significant but not as large amounts, but the real area of pain is in small caps where the Russell 2000 is indicated to open down by more than 2.25%. At that level, the Russell would be down by slightly more than 10% from its 52-week high.
Read today’s Morning Lineup for a recap of all the major market news and events from around the world, the latest US and international COVID trends including our vaccination trackers, and much more.
As COVID case numbers rapidly rise across the country and the world, concerns over the trajectory of the recovery have been called into doubt. That trend has only intensified in the last few days, and the yield on the 10-year US Treasury is a perfect example. This morning, the yield is down to 1.23%, which is the lowest since February 16th!

If current levels on the 10-year hold, it will end a streak of 172 trading days where the yield closed above its 200-day moving average. Relative to history, this current streak was nowhere near extreme, but it was the longest streak since December 2018.

Bespoke Brunch Reads: 7/18/21
Welcome to Bespoke Brunch Reads — a linkfest of the favorite things we read over the past week. The links are mostly market related, but there are some other interesting subjects covered as well. We hope you enjoy the food for thought as a supplement to the research we provide you during the week.
While you’re here, join Bespoke Premium with a 30-day free trial!
Labor Markets
The CFO Survey: Data & Results – Q2 2021 (Richmond Fed)
While CFOs reported a huge uptick in concern over labor quality and availability, optimism over their specific company’s prospects hit the second-highest level ever and general confidence about the trajectory of the US economy was improved as well. [Link]
McDonald’s Owners Offer Tuition, Child Care to Lure Burger Flippers by Heather Haddon (WSJ)
Franchisees are expanding their benefit packages in order to hire workers, with higher wages, paid time off, and tuition coverage also being offered in order to attract workers amidst and extremely tight labor market for restaurant workers. [Link; paywall]
Environment
A “wobble” in the moon’s orbit may lead to record floods on Earth by Sophie Lewis (MSN)
In addition to rising seas thanks to higher temperatures, flooding will worsen over the next couple of decades as a wobble in the moon’s orbit drives unusually high tides that may overwhelm costs even without a storm surge or higher sea level. [Link]
People dumped their pets into lakes, officials say. Now football-size goldfish are taking over. by Reis Thebault (WaPo)
While goldfish in bowls tend to be pretty small, when released into the environment they can grow to impressively large sizes while also badly disrupting the ecosystems they’re released in to. [Link; soft paywall]
Have you ever wondered why we don’t find fossils in the Appalachian mountains? The truth is, we do, they’re just not the kind of fossils you might think of—there are no mammals, no dinosaurs, no reptiles. There’s something else entirely. by Alex (ThreadReader)
A fascinating read on the absolutely ancient Appalachians, which were produced through multiple continental collisions and are part of the same mountain range that covered northern Britain and Scandinavian. [Link]
Tight Supply
Here’s Who Will Be Left Behind in the Housing Boom by Ali Wolf (NYT)
With out-of-town buyers that have much higher incomes than locals fueling the housing boom since COVID hit, current residents are unable to compete. The result is a huge shift in the housing market. [Link; soft paywall]
Build-to-Order Gains Momentum at Long Last by Steve Finlay (Wards Auto)
Traditionally, automakers have built inventory for consumers to purchase on the spot. But tight inventories and the success of non-dealer models like Tesla have led to shifts in the traditional approach. [Link]
Infrastructure
China Buys Friends With Ports and Roads. Now the U.S. Is Trying to Compete. by Stu Woo and Daniel Michaels (WSJ)
In response to China’s soft power “Belt & Road” initiative, the US is ramping up investments in various types of infrastructure around the world as a way to counter the Chinese effort to win friends with cheap loans and direct investment in ports, communications, and railways. [Link; paywall]
Investing
Treasury Wants Large Holders of 2020 Note to Identify Themselves by Liz McCormick (Bloomberg)
A 2020 ten year note issue may have had extreme concentration, leading the Treasury to demand large holders to identify themselves, part of its regular efforts to ensure nobody corners the market in a given bond. [Link; soft paywall]
Robinhood, Others Upend Rules for Early IPO Trading by Corrie Driebusch (WSJ)
Rather than being forced to hold for the traditional six months, early investors in Robinhood will be able to sell 15% of their holdings immediately and 15% three months later with full restrictions lifted after six months as is typical. [Link; paywall]
Wall Street Has Surrendered to the $500 Billion ETF Rush by Claire Ballentine and Francesca Maglione (Bloomberg)
We’re only a couple of days in to the second half, but ETFs are on track to break the $497bn record inflows ETFs recorded in 2020; that means the full annual flow total is likely to be substantially higher. [Link; soft paywall]
Overdoses
US overdose deaths hit record 93K in pandemic last year, a 29% increase (Associated Press/NYP)
Exploding prevalence of fentanyl and policy responses to the pandemic drove a huge increase in overdoses last year. [Link; auto-playing video]
Read Bespoke’s most actionable market research by joining Bespoke Premium today! Get started here.
Have a great weekend!
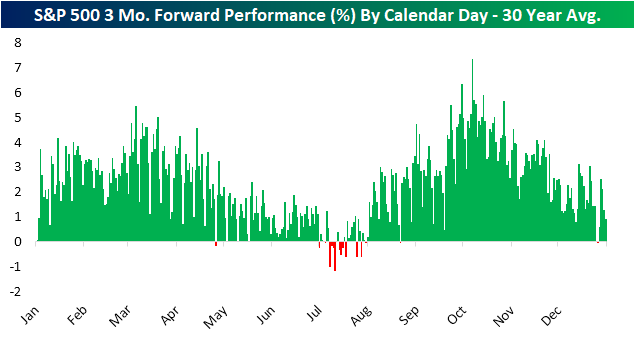
Seasonal Summer Slump
Taking a look at our Seasonality Tool, it is hard to find a day in the year that will give a weaker reading for the one month to three month periods. As shown in the snapshot of the tool below, over the past decade, the one month period from mid-July has a median loss of 0.34%. That stands in the 13th percentile of all periods of the year. Meanwhile, three month performance ranks even weaker in the bottom 2% of all periods with a median decline of 1.19%.

To show this in another light, in the chart below we show the average 3 month forward performance over the past 30 years for each calendar day of the year. July is the only major period of the year in which the forward 3-month performance consistently leans negative.
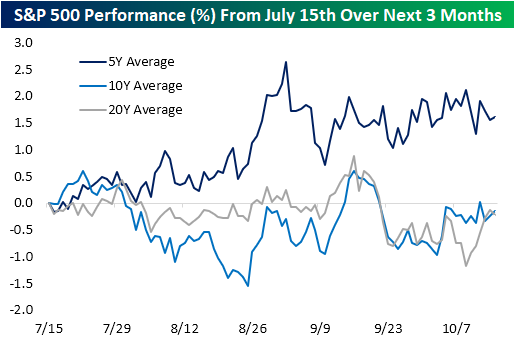
While over the long term mid-July and the next few months have been one of the weaker periods of the year, more recently things have been a bit better. In the chart below, we show the S&P 500’s average performance from July 15th out over the next three months. While the 10 and 20-year averages show the S&P 500 is typically flat or slightly lower through the summer and early fall, the index has actually on average trended higher over the past five years. In other words, that seasonal weakness has been less evident in recent years. Click here to view Bespoke’s premium membership options.
Bespoke’s Morning Lineup – 7/16/21 – Nine Would Be Fine
See what’s driving market performance around the world in today’s Morning Lineup. Bespoke’s Morning Lineup is the best way to start your trading day. Read it now by starting a two-week free trial to Bespoke Premium. CLICK HERE to learn more and start your free trial.
“The first principle is that you must not fool yourself, and you are the easier person to fool.” – Richard Feynman
Futures are higher this morning ahead of Retail Sales, Business Inventories, and a preliminary read on Michigan Confidence. On the Retail Sales front, both the headline and ex Autos readings came in significantly ahead of forecasts.
Summer Fridays are typically slow, but one area of excitement will be the Nasdaq 100 where the index needs to close about 35 points higher today in order to extend its current weekly winning streak to nine. Based on where futures are currently trading, the index should be in the green for the week to start the trading day, but where it finishes will be more important. Whether the streak ends at eight or extends to nine, though, it would still be the longest weekly winning streak for the index since the first half of 2019.
Read today’s Morning Lineup for a recap of all the major market news and events from around the world, economic data out of Asia and Europe, the latest US and international COVID trends including our vaccination trackers, and much more.
The picture for the three major indices shows vastly different pictures depending on which index you look at. Starting with the Russell 2000, it has been a major laggard and yesterday was on pace to close more than 1.5% lower for the third consecutive day, but a late-day bounce erased more than two-thirds of the decline. As weak as the Russell has been lately, the longer-term chart is far from breaking down as it remains stuck in a range after surging in late 2020 and into early 2021.
For large-cap stocks, the picture looks much different. Both the Nasdaq 100 and S&P 500 hit record highs earlier this week but have been wobbling in the last few days. While the Russell 2000 trades in oversold territory, the large-cap indices remain overbought so they could be susceptible to some more consolidation in the days and weeks ahead.

Empire Fed Shatters Expectations
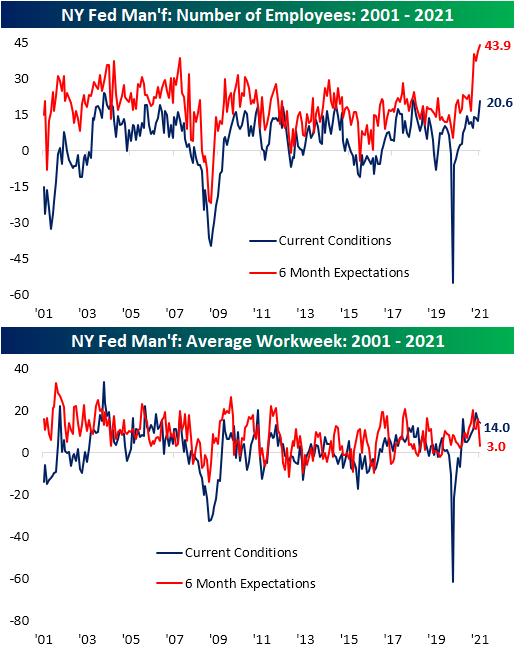
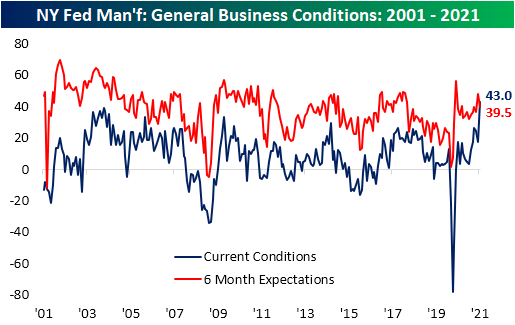
Of the array of economic data released this morning, perhaps the most impressive was the New York Fed’s reading on the manufacturing sector. The headline index came in at 43, smashing estimates by 25 points. As we show below, that was one of the strongest readings relative to expectations since 2002 with the only bigger beat being last June. Not only was it impressive relative to expectations, but the release also set a record high. In addition to the July reading being a record high, the month-over-month change was the fourth largest on record behind May and June of last year and May of 2003.

Driving the surge in the headline number were big improvements across categories, but especially for New Orders, Shipments, and Inventories. The MoM increases for each of those categories ranked in the top 5% of all months and left them at some of the highest readings on record. While most categories improved versus June, there were three outliers: Delivery Time, Prices Paid, and Average Workweek.

Demand-related indices were some of the most impressive areas of the report. New Orders surged 16.9 points to 33.2 which was the highest level since 2004. That massive acceleration in orders growth meant backlogs grew at a more rapid pace as Unfilled Orders rose 4.2 points. Even though that is a historically strong level, it was 9.3 points below the even more elevated readings from earlier in the spring. Fortunately, manufacturers appear at least somewhat more capable of fulfilling those orders. Shipments surged to 43.8 which, like new orders, was the highest level in the index since 2004. Additionally, inventories grew at a rapid rate. The Inventories Index rose 18.8 points from a contractionary reading last month to one of the highest levels on record.

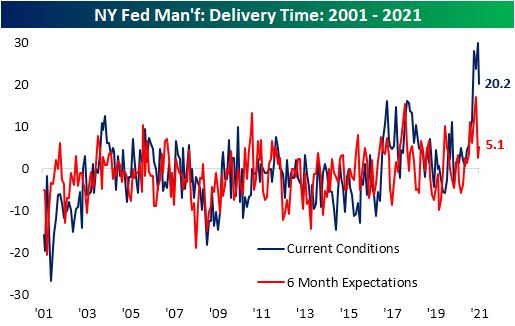
One likely reason for the massive increase in inventories and shipments is some normalization in supply chains. The index for Delivery Times measures how long it takes for supplier products to arrive. Higher readings indicate longer lead times and vice versa. Over the past year, these indices have surged to unprecedented levels across regional Fed and other manufacturing reported. While the Empire Fed’s reading is still extremely elevated from a historical context, the 9.6 point drop month over month marked a significant improvement in lead times.
Input price pressures have also subsided a bit. Similar to the Delivery Times index, the index for Prices Paid is extremely elevated but showed some relief in July. That was not the case for Prices Received though. That index continued to rise with both the current conditions and 6-month expectation indices reaching record highs in July.

In terms of the expectations indices, the only other one to reach a record in June was for the Number of Employees. The increase in that index was matched by a sizeable uptick in the current conditions index as well. That index rose 8.8 points to the highest level since June 2018 indicating the region’s manufacturers continue to have a strong appetite for labor and are in fact taking on more workers. Click here to view Bespoke’s premium membership options.