The Bespoke Report Newsletter – 9/17/21 – Too Cute?
This week’s Bespoke Report newsletter is now available for members.
It hasn’t happened very often this year but early Friday afternoon the S&P 500 was on pace to close below its 50-day moving average. A close below the 50-DMA is not something that market technicians like to see.

To read this week’s full Bespoke Report newsletter and access everything else Bespoke’s research platform has to offer, start a two-week trial to one of our three membership levels.


Bespoke’s Morning Lineup – 9/17/21 – Slow Going into the Weekend
See what’s driving market performance around the world in today’s Morning Lineup. Bespoke’s Morning Lineup is the best way to start your trading day. Read it now by starting a two-week trial to Bespoke Premium. CLICK HERE to learn more and start your trial.
“If you buy things you do not need, soon you will have to sell things you need.” – Warren Buffett
Futures are pointing to a modestly lower open this morning, and they’re right near the lows of the morning as European stocks opened the day higher and have steadily sold off throughout the morning session there. Two culprits are behind the weakness in Europe. The first is a hot CPI report which showed y/y increases of 3.0% versus 2.2% last month. The second is technical; after opening back up above its 50-DMA this morning, the STOXX 600 couldn’t hold on to that level after closing below it in each of the last two trading days.
The economic calendar is light today with the only report on the calendar being Michigan Sentiment, and economists are expecting a modest rebound following last month’s plunge.
Read today’s Morning Lineup for a recap of all the major market news and events from around the world, including the latest US and international COVID trends.
With the S&P 500 on pace for its eighth down day in the last 10 trading days, there’s a good degree of trepidation on the part of investors lately. Look no further than this week’s sentiment survey from the American Association of Individual Investors (AAII) where bullish sentiment plunged as an example. One encouraging aspect of trading the last several days is the performance of semiconductors, a sector we consider to be a good barometer of the market’s direction. Yesterday, for example, the VanEck Semiconductor ETF hit a new record high and finished in positive territory for the sixth day in a row. Not only that, but in the last 20 trading days, the ETF has finished the day lower only four times.

Start a two-week trial to Bespoke Premium and read today’s full Morning Lineup.
S&P Dividend and Treasury Yields Are Nearly Identical
On February 25th of this year, the 10-Year Treasury yield surpassed the dividend yield of the S&P 500 for the first time since January 17th, 2020. Currently, the S&P 500’s dividend yield stands at 1.33% vs. the 10-Year’s yield of 1.31%, so they’re essentially right inline with each other at the moment.
Since 1971, the 10-Year yield has been higher than that of the S&P 90.7% of the time, and the median spread between the 10-Year yield and the S&P’s dividend yield has been +3.5 percentage points. Both yields are much lower than their typical level since 1970. The S&P’s dividend yield has been higher than its current level 94.62% of the time. As for the 10-Year Treasury, its yield has been higher 97.55% of the time.

The spread between these two yields generally narrowed between the ’90’s and the mid 2000’s. The first time the S&P’s dividend yield crossed above the 10-Year yield was in November 2008 in the midst of the Financial Crisis. Since then, the spread has never been more than 2 percentage points in either direction, with a range from -1.99 to 1.67. The spread was the largest in September of 1981, when the 10-Year Treasury yield was 10.23 ppts higher than that of the S&P 500’s dividend yield.

The 10-Year yield has also historically been more sensitive to economic change. The average rate of change over a one month period for the yield of the 10 year has been 4.82% to the upside and -4.95% to the downside. The S&P 500 dividend yield’s average rate of change over the same time period has been 3.64% to the upside and -3.23% to the downside. The correlative coefficient between the two yields is .80, signifying that the two figures are strongly correlated. This makes sense, as the two are alternative forms of income. When one yield increases, it becomes more attractive to investors, who will sell off the alternative, thus raising the yield of the alternative as the price decreases.

Bespoke’s Morning Lineup – 9/16/21 – Busy Day of Data, Sentiment Plunges
See what’s driving market performance around the world in today’s Morning Lineup. Bespoke’s Morning Lineup is the best way to start your trading day. Read it now by starting a two-week trial to Bespoke Premium. CLICK HERE to learn more and start your trial.
“It’s not like the CIA. We don’t have private, secret data on the economy.” – Jerome Powell
We’ve seen a fair amount of weaker than expected economic data over the last several weeks, and today will be a test for the strength of the recovery as a number of key reports are on the calendar. Retail Sales, Jobless Claims, and the Philly Fed will all be released at 8:30, while Business Inventories will hit the tape at 10 AM.
Yesterday was a nice relief from the recent selling, but it has been surprising to see just how quickly investors have reversed course in terms of sentiment. According to the weekly sentiment survey from AAII, bullish sentiment plunged from 38.9% down to 22.4% this week (lowest level since June 2020) while bearish sentiment surged from 27.2% up to 39.3% (highest level since last October). That was quick!
This morning, there’s been little movement in different asset classes as equity futures are just slightly lower, the 10-year yield is modestly higher, and oil is lower. Even in the crypto space, there’s little life as bitcoin is trading down just … 77 cents!
Read today’s Morning Lineup for a recap of all the major market news and events from around the world, including the latest US and international COVID trends.
When it comes to seasonal patterns in the market, one less widely known trend is related to the Jewish calendar regarding Rosh Hashanah (the Jewish New Year) and Yom Kippur (Judaism’s most solemn day of the year). The old saying says to “Sell Rosh Hashanah and buy Yom Kippur” as the period between these days tends to be a weak time of year for the market. We’ll leave it to others to try and explain the reasons behind the axiom, but the actual results don’t refute the pattern.
The table below shows the performance of the S&P 500 from the close before the start of Rosh Hashanah to the closing price on the day Yom Kippur ends from 2000 through 2020 (2021’s performance is through Wednesday’s close). During that span, the S&P 500’s median performance during this period has been a decline of 0.50% (average: -0.92%) with positive returns less than half of the time.
While equity market returns have been weak during the period between these two days on the Jewish calendar, Yom Kippur ends tonight at sundown, so what are market trends from after Yom Kippur ends through year-end? Overall, the broad market trend has been positive. In the twenty-one prior years shown, the S&P 500’s median rest of year performance has been a gain of 6.07% with gains 71% of the time. In the table, we have also shaded those years where the S&P 500 bucked the market headwinds and posted positive returns during this period, but it tended to have no impact on performance for the remainder of the year.
While we have seen all sorts of theories over the years as to why the equity market has been weak in the period between Rosh Hashanah and Yom Kippur, it is also important to remember that both of these days occur at a time of year that is already seasonally weak to begin with.

Start a two-week trial to Bespoke Premium and read today’s full Morning Lineup.
Strong Start to September Manufacturing Data
Last month saw a broad pivot lower across the regional Federal Reserve Bank manufacturing surveys. With the release of the Empire Fed’s survey this morning, we now have the first reading for the month of September. Rather than the more dour results of August, today’s results showed a broad acceleration in activity across categories in the New York region. The headline index was expected to show an ever so modest decline to 18.0 from 18.3 last month. Instead, it popped 16 points to 34.3 which is actually the seventh-highest level on record.
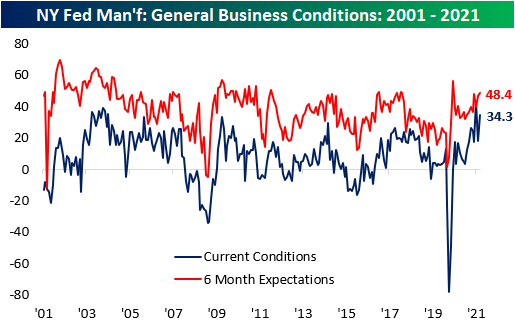
Just about everything drove the uptick in the headline number as only one index for current conditions was lower on a month-over-month basis: Prices Paid. Not only did almost every category show acceleration, but current levels across the board are in the top decile of historical readings. While elevated and higher readings are perhaps not positives, Delivery Times and Prices Received both came in at record highs.

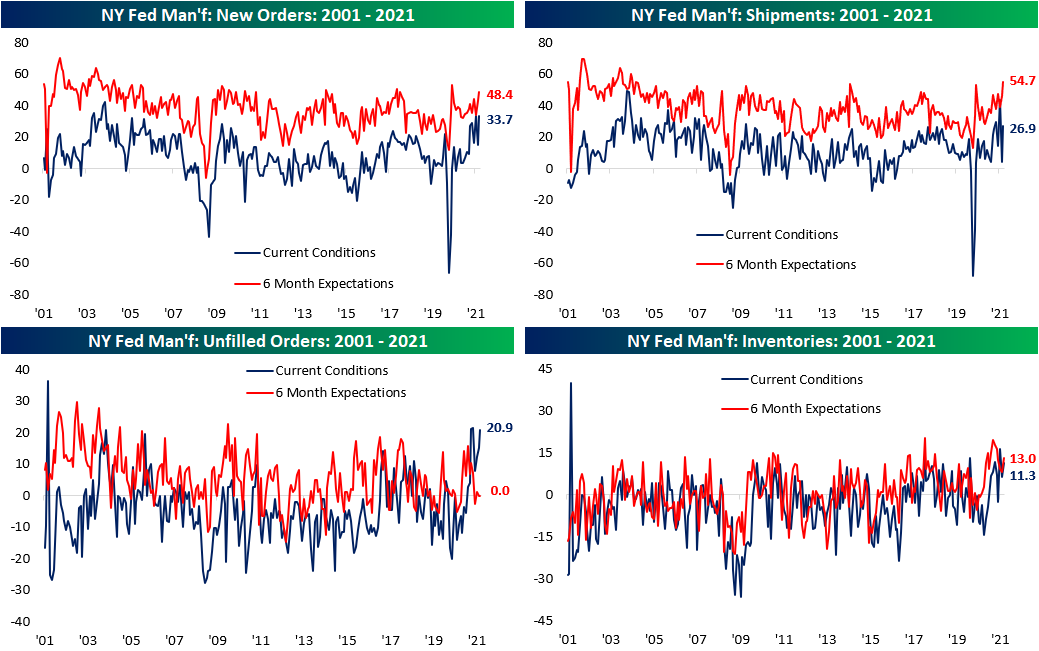
Some of the categories to have seen the most notable upticks this month were related to demand. Both New Orders and Shipments saw increases in the top few percentiles of their respective historical ranges. In fact, New Orders surpassed the July high to reach the highest level since July 2004. The reading on Shipments has been particularly volatile over the past few months, and the September reading was still below the high from July. That being said, it still came in at a very healthy level in the 90th percentile versus the 21st percentile reading in August. Additionally, expectations were far stronger. Coming in at 54.7, that index was at a seventeen-year high.
One area that expectations have gone the other way of current conditions is unfilled orders. While the growth in demand meant the current conditions index is right below the spring highs, six-month expectations came in at zero for the second month in a row. In other words, reporting businesses expect backlogs to remain at current levels six months out even as inventories are being built up at one of the fastest clips on record.
For the past few months, the index for Delivery Times had been showing some relief, but over the past two months, there has been increasing evidence once again of worsening supply chains. The past two months have both seen the index increase over 8 points which brings it to yet another record high of 36.5. While time will tell if the prediction is right, on the bright side, expectations are much more modest for future delivery times.

Prices are a somewhat similar story. Current levels are unlike anything seen through the history of the survey, but Prices Paid have now fallen for four months in a row. That lower does not mean prices are falling but are instead growing at a slower rate. As such, price increases are continuing to be passed on to customers as prices received increased for the third month in a row to a new record high of 47.8.

Employment-related indices also had a strong showing this month. The region’s businesses continued to take on more workers with the index rising to 20.5 which is just below the pandemic high of 20.6 set back in June. Granted, there are also signs that demand for labor is not being met. In spite of that uptick in employment, the average workweek surged. That index leaped 15.4 points to come in at the second-highest level on record.

Perhaps because the demand for labor cannot be filled, responding firms appear to be turning to the other side of the production function. Readings on plans for Capital Expenditure and Technology Spending also shot higher this month with the latter rising to record levels. In fact, the month-over-month increase in Technology Spending was the second-largest monthly gain on record behind a 19.1 point leap in April 2009. Click here to view Bespoke’s premium membership options.

Natural Gas Prices Explode Higher
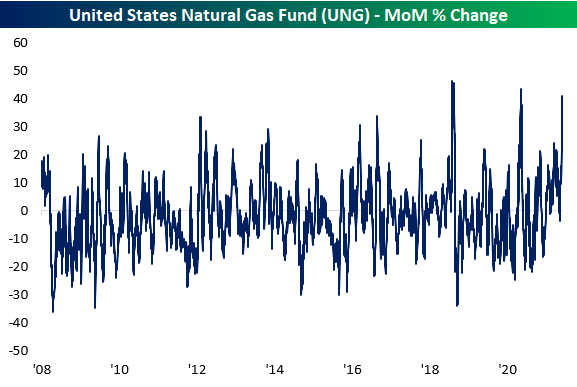
Energy commodities have been on an impressive run in 2021. Natural gas has basically gone into orbit recently on supply concerns. The US Natural Gas Fund (UNG) is now up over 100% on the year and 15.65% over the past five days alone. Since its recent closing low on August 18th when UNG was testing its 50-DMA, UNG has rallied 44.88%. Take a look at the one-year price chart for UNG:

With regards to this particular ETF tracking the commodity, UNG’s one month rate of change is now approaching one of the highest levels on record. As shown in the chart below, UNG’s 40.9% rally over the past month is second only to the 43.6% gain in August of last year and a 46.3% rally in November 2018. As for a slower year-over-year rate of change, things are equally as impressive. Again, only two periods have seen UNG experience larger gains on a rolling 1 year basis. The smaller and more recent of the two was when UNG posted a 66% rally in early December 2018 while the record 68% rally occurred in April 2013.

As could be expected with the explosive moves in natural gas prices, price has become extremely overbought. Today, UNG has moved over 3 standard deviations above its 50-DMA for the first time since June. Prior to that occurrence earlier this spring, there were only a handful of other times that UNG was as elevated above its 50-DMA. Two of those were in the fall of 2018 while the others were in June 2016, January 2014, and June 2010.

Turning to a look at speculator positioning, Friday’s release of the CFTC’s Commitment of Traders report showed the recent rally in natural gas appears to have resulted in shorts closing out their positions. As shown below, open interest has consistently been net short since the early spring. But from the second to last week of August to the most recent update last week, the percent of open interest has gone from 11.97% net short to only 8.18% net short. March 2020 was the last time to have seen positioning jump by as much in a two-week span. Click here to view Bespoke’s premium membership options.

Bespoke’s Morning Lineup – 9/15/21
See what’s driving market performance around the world in today’s Morning Lineup. Bespoke’s Morning Lineup is the best way to start your trading day. Read it now by starting a two-week trial to Bespoke Premium. CLICK HERE to learn more and start your trial.
“I never once considered that it was appropriate to put taxpayer money on the line in resolving Lehman Brothers.” – Henry Paulson
Futures were higher earlier this morning than they are now, and as we’ve seen the last couple of days, equity markets have been struggling to hold onto gains throughout the trading day. The fact that today marks the 13th anniversary of the Lehman bankruptcy also probably doesn’t help sentiment either. Overnight, Retail Sales out of China showed an increase of just 2.5% in August whereas expectations were for a rate of nearly triple that. Chinese Industrial Production also missed estimates, but at 5.3% was much closer to consensus forecasts for growth of just under 6%.
Read today’s Morning Lineup for a recap of all the major market news and events from around the world, including the latest US and international COVID trends.
It wasn’t a good day for stocks in general yesterday, but the banks were one sector that was hit especially hard. Of the six large banks shown below, Wells Fargo (WFC), which Senator Warren actually called for to be broken up yesterday, was the only one to finish the day in positive territory. The other five were down anywhere from 1.36% (Goldman) to 3.14% (PNC). Of the six, the only one that’s currently not in some sort of consolidation mode right now is Goldman which is still within 5% of its 52-week high from just two weeks ago. While trading in the sector has been frustrating lately, look on the bright side, it’s not 13 years ago.

Start a two-week trial to Bespoke Premium and read today’s full Morning Lineup.
Small Businesses Problems
In addition to the various indices regarding small business conditions, the NFIB also surveys firms on what they see as their most pressing issue. In August, by far the most common issue among respondents was labor-related. A record 28% reported quality of labor as the biggest issue; up 2 percentage points versus July. Another 8% reported cost of labor as their biggest issue which was slightly lower than July. On a combined basis, the 36% reporting either cost or quality of labor as their biggest issue was the joint highest reading on record; tying August and November 2019.
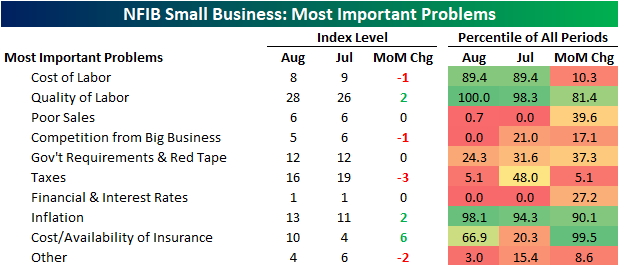

Especially over the past several election cycles, the results of the NFIB survey have tended to be impacted by politics. For example, over the past few presidencies, when a Republican is in office there has been a lower percentage of respondents reporting either taxes or government red tap as their biggest issue and vice versa when a Democrat is in office. That combined reading has now completely reversed the uptick following the election of President Biden as labor concerns have increasingly come into focus.

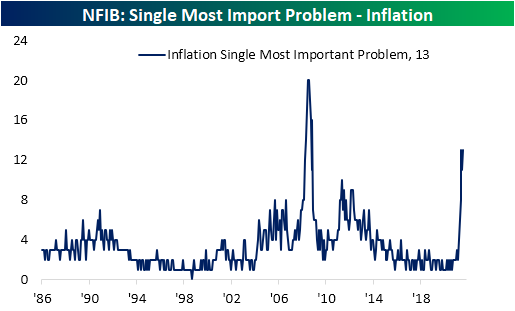
While government-related problems are still the second biggest concern(s) on a combined basis, there have been some other notable moves this month. The percentage of respondents reporting inflation as their biggest issue rose back up to the pandemic high of 13% this month. The Great Recession was the only other period that has seen as elevated a share of respondents seeing price increases as their biggest issue. Additionally, that excludes those reporting cost of labor as an issue.
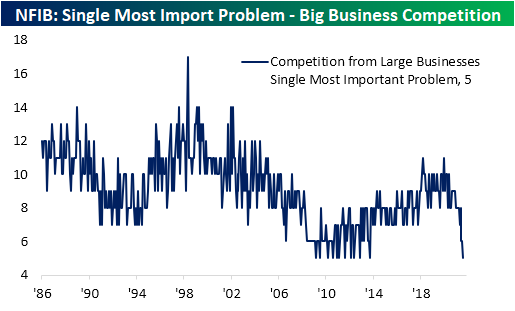
As for what the rise in Inflation as a problem may have borrowed from, one of the most notable has been competition from big business. The reading has seen a gradual decline since the end of 2019, and now at only 5%, it is tied with several months between September 2009 and September 2013 for the lowest reading on record. Click here to view Bespoke’s premium membership options.
Leveraged ETFs in 2021
Rather than mirror the performance of an index or specific asset, leveraged ETFs seek to provide a multiple of that performance through the use of derivatives and debt; usually double or triple that of the underlying asset. These ETFs are meant to track a multiple of daily performance, meaning long-term performance tends to not equal two or three times that of the unleveraged instrument. The companies offering these leveraged ETF products do explain that they track daily performance only, but even still, many investors overlook that fact and choose to own them longer term.
As for other cons working against the potential for higher returns is that these ETFs could create larger losses, they carry higher fees and expenses, and there is the possibility for those 3x or 2x returns to be downgraded as was the case last year. In other words, with the potential for higher returns, there are plenty of other risks, and these ETFs should be addressed with caution. As always, this is in no way to be taken as a buy or sell recommendation for any leveraged ETF product.
In the charts below, we show the hypothetical performance of $100 invested in a handful of leveraged ETFs as well as a more vanilla unleveraged alternative at the start of the year through Monday’s close. We would also note it is purely price returns before any payouts and/or expenses.
Starting with a look at long-term Treasuries, $100 invested at the start of the year into the iShares 20+ Year Bond ETF (TLT) would be slightly in the red headed into the final quarter of the year. Meanwhile, someone betting on the Direxion Daily 20+ Year Treasury 3x Bull ETF (TMF) would see their $100 fall to $83.24 today. At the low on March 18th, that $100 would have fallen as low as $60. That’s right, a 40% decile for something tracking what is supposed to be a relatively risk-free asset!
As for some other assets, the Energy sector (XLE) and Financial sector (XLF) have been two of the best performing sectors this year. As such, $100 invested into XLE and XLF would have grown to $129.79 and $128.69, respectively. For Energy, the 2x bullish ETF (ERX) would have seen that same $100 turn into $160.78 and the opposite side of that trade (ERY) would see the $100 more than cut in half. The same goes for the 3x bet for Financials. The Direxion Daily Financial Bull 3x Shares ETF (FAS) has nearly doubled YTD in 2021 whereas the inverse bearish ETF (FAZ) would have turned a buck into less than cents.

As briefly mentioned earlier, one other con to leveraged ETFs is higher expenses. For example, taking a look at the S&P 500, $100 invested into the SPDR S&P 500 ETF (SPY) would have become $119.19 year to date before any dividends or expenses. In the case of SPY, expenses are not much of a burden at only 0.09%. While the Direxion S&P 500 3x Bull ETF (SPXL) would have seen that $100 appreciate to an even more impressive $164.82, returns would have been even better if it were not for a nearly 1% expense ratio. As for the bears, if the $100 nearly being cut in half isn’t bad enough, adding insult to injury, the expense ratio is above 1%. For comparison, the median expense ratio of a screen of 1,728 ETFs excluding leveraged ones is only 0.49%. Click here to view Bespoke’s premium membership options.

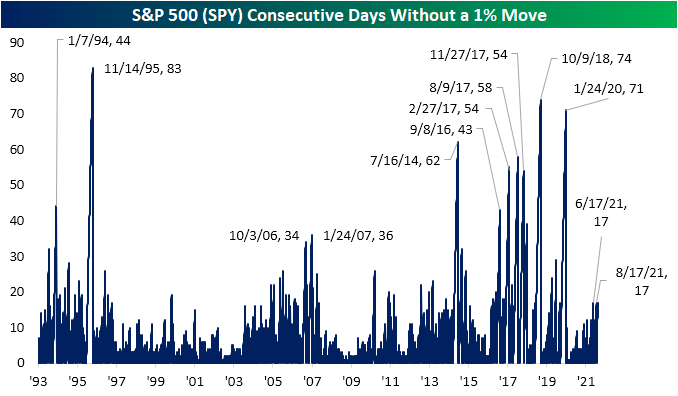
SPY Snoozing
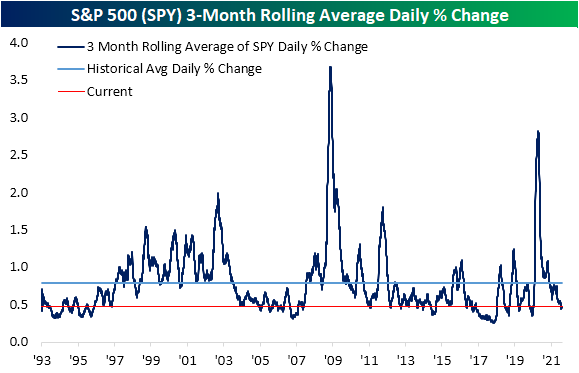
As of this writing, the S&P 500 (SPY) is currently up 0.24% today and is looking to snap a five-day losing streak. While the move has its own degree of excitement, overall the S&P 500 has been on a pretty boring stretch of late. August 18th was the last time that the S&P 500 rose or fell more than 1% in a single session. Not only does that make the current streak including today 17 trading days long, but that move on August 18th had also brought to an end another 17-day long streak without a move of at least 1%. With only a single day between the past two 17-day long streaks, there was also another streak identical in length ending in June. These three stretches tie for the longest run without a 1% move of the post-pandemic period with the prior streak ending in late January 2020. As shown below, going through the history of SPY this year’s non-volatile stretches stand out but are far from the longest streaks on record. For example, the second half of 2016 through 2018 saw multiple streaks without a 1% move that were between 43 and 74 trading days. To find the longest stretch without a 1% one-day move, you have to go back to 1995 when SPY went 83 trading days without a daily move of 1%.
Given there has only been a single day in the last 35 in which the S&P 500 (SPY) has gained or lost more than 1%, taking a look at the 3 month rolling average for the daily move in SPY shows daily volatility has certainly been at the low end of the historical range. Historically, SPY has averaged an absolute daily change of 78 bps. Over the past 90 days, though, SPY’s average daily move has been just 47 bps, ranking in the bottom quintile of readings. Investors expect ‘dull’ trading during the summer months, but now that the calendar says September, a lack of volatility would be out of the norm. Click here to view Bespoke’s premium membership options.