Stocks on Streaks Headed into Earnings Season
As earnings season kicks off in earnest this week, using data from our Earnings Explorer tool, we set out to find the stocks that are on the biggest earnings winning and losing streaks when it comes to share price performance.
There are 21 stocks reporting between now and the end of earnings season that have seen gains on their earnings reaction days for the last six consecutive quarters or more. (For a stock that reports after the close, its earnings reaction day is the next trading day. For a stock that reports before the open, its earnings reaction day is that trading day.) Five of the 21 stocks have gained on each of their last nine earnings reports! One of these is SiteOne Landscape (SITE). Below is a snapshot of SITE’s earnings reports going back to early 2019 pulled from our Earnings Explorer. Heading into its last report on August 4th, SITE had gained on each of its last 8 earnings reaction days, and it went on to gain another 7.65% that day as well!

Below is a table listing the 21 stocks that are currently on earnings winning streaks of six quarters or more. Along with SITE, the other stocks that have seen gains on their last nine earnings reaction days include Lindsay Corp (LNN), ExlService (EXLS), LKQ, and Cheniere Energy (LNG). For owners of these stocks, quarterly earnings have been a breeze over the last 2+ years.

On the downside, there are 16 stocks that have fallen on their earnings reaction days for seven or more straight quarters. These are stocks that just can’t catch a break lately when it comes to earnings. As shown, Hawaiian Holdings (HA), Verisk Analytics (VRSK), and BrightView Holdings (BV) have fallen on each of their last 11 quarterly earnings reaction days!

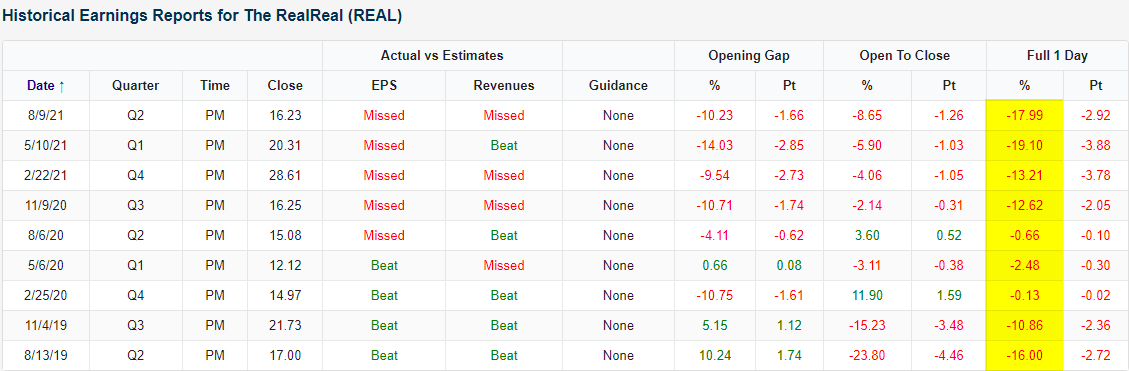
One of the absolute worst performing stocks in response to earnings has been The RealReal (REAL). The luxury consignment website went public back in June 2019, and so far the stock has yet to see a price gain on any of its nine earnings reaction days! Talk about a painful streak for shareholders. Below is a snapshot of REAL’s historical earnings reports pulled from our Earnings Explorer. As shown, not only has REAL fallen on each of its nine earnings reaction days since going public, but it has also fallen more than 10% on each of its last four earnings reports. You can use our Earnings Explorer to monitor historical earnings trends for the names you care about most. Start a two-week trial to Bespoke Institutional to access our Earnings Explorer now.
A Case for the Shorter Trading Day
Since the S&P 500’s last high on September 2nd, despite an average opening gap of around 5 basis points (bps), the index has averaged a 17.7 bps decline from open to close. Looking at the intraday pattern in that time, the morning through the early afternoon typically sees the index erase any gains from the open. After a small bounce in the mid-afternoon, the final hour has averaged a sharp reversal lower.

Taking another look at intraday patterns, below we show the cumulative performance in 2021 of $100 through a few hypothetical strategies. The first is buying at the close and selling one hour into the following session (dark blue line). The next would be buying at the start of the final hour and selling at the close (red line). The third would be holding for the time between 10:00 AM to 3:00 PM (gray line). The last would be a simple buy and hold from close to close (green line). As shown, “smart money” is not looking particularly bullish this year. Had you only owned the S&P in the last hour of the day, your $100 at the start of the year would be down to just over $88. Meanwhile, owning the opening gap into the first hour only would leave an investor up almost $16. While you would be holding on for a longer period of time, owning in the middle of the day would have resulted in decent gains, but the best strategy has been to buy and hold. which captures returns both throughout the trading day and outside of regular trading hours.
Not shown in the chart below is if the trading day ended at 3PM instead of 4. If the equity market simply closed at 3 PM every day (or you sold at 3 PM and bought again at the close), that strategy would be up roughly 30% YTD! A three o’clock closing bell on the east coast has a nice ring to it! Click here to view Bespoke’s premium membership options.

Communication Services (XLC) Breakdown
Looking at sector performance over the past week, the weakest sector has been Communication Services (XLC) with a decline of over 2% in the five days ending yesterday. That brings the sector over two standard deviations below its 50-DMA. Health Care (XLV) is the only other sector at extreme oversold levels although its recent decline has been much more modest.

Whereas most of the past year has seen XLC consistently hold above support at its 50-DMA, since the start of September, the sector has trended lower, and over the past month, it has also been below its 50-DMA. Now smack dab between its 50 and 200-DMAs, yesterday’s decline resulted in XLC falling below support around $79. That level formerly marked short-term highs in April and May of this year and a low/test of the 50-DMA in mid-July.

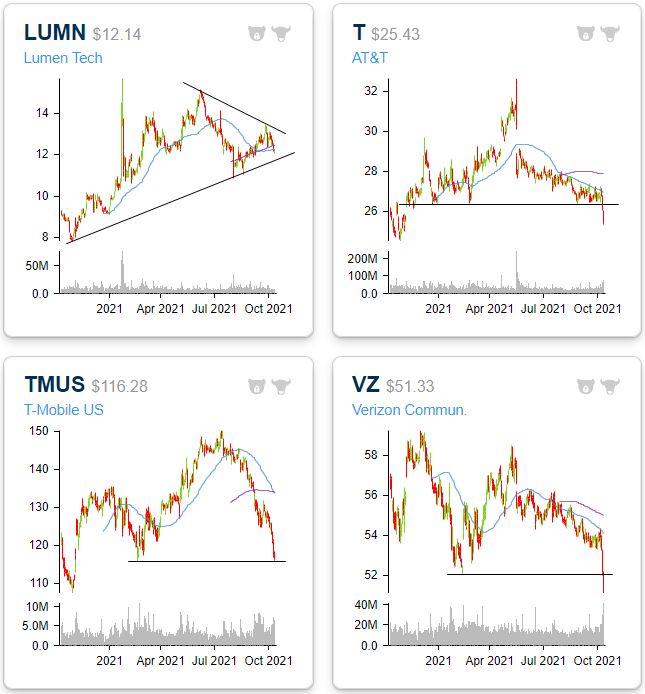
While that breach of support has not necessarily been dramatic, the same cannot be said for many of the sector’s stocks. For example, telecoms have gotten crushed as AT&T (T), T-Mobile (TMUS), and Verizon (VZ) have all collapsed in recent days with each one extremely oversold. Of these, only TMUS has appeared to have found any hint of support at recent lows. The other stock in this industry, Lumen Tech (LUMN), has also been moving lower but has not collapsed like the others.
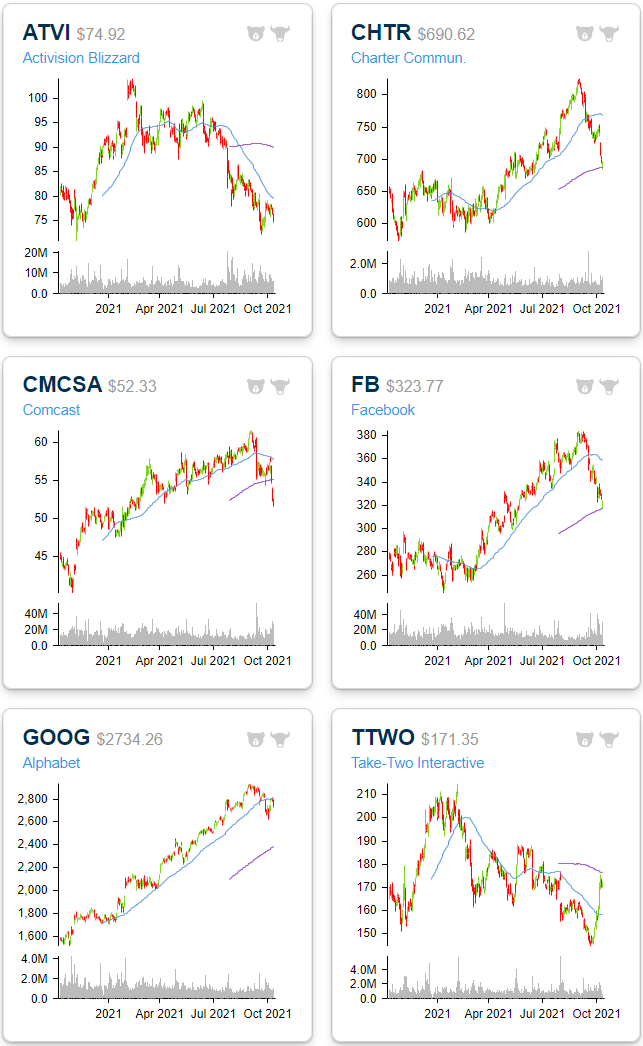
As for other members of the sector outside of that industry, names like Charter (CHTR), Comcast (CMCSA), Facebook (FB), and Alphabet (GOOG) have also pulled back sharply recently breaking longer-term uptrends. Also, since many of these stocks have very large market caps, their impact on the sector’s performance is greater. On the bright side, CHTR and FB have appeared to have found some support at their 200-DMAs while the opposite is the case for CMCSA. Similarly, GOOG just recently failed to move back above its 50-DMA. As for the video game stocks, Take-Two Interactive (TTWO) also failed to move back above a moving average recently while Activision Blizzard (ATVI) has been in a steep downtrend over the past few months with a failed attempt to break out of that trend in the past several days.Click here to view Bespoke’s premium membership options.
Bespoke’s Morning Lineup – 10/13/21 – Bracing For Inflation Data
See what’s driving market performance around the world in today’s Morning Lineup. Bespoke’s Morning Lineup is the best way to start your trading day. Read it now by starting a two-week trial to Bespoke Premium. CLICK HERE to learn more and start your trial.
“Inflation is bringing us true democracy. For the first time in history, luxuries and necessities are selling at the same price.” – Robert Orben
Earnings season kicked off this morning and all five of the major companies reporting before the bell topped consensus estimates. In terms of share price reactions, four of the five names are either flat or slightly higher, but SAP which reported an earnings triple play is trading up over 5% in the pre-market. So far, so good.
With all of the earnings reports out of the way, the focus will shift to CPI and how bad the inflation pressures were on the economy in September. Then, at 2 PM the FOMC will release the minutes from its most recent meeting three weeks ago.
Read today’s Morning Lineup for a recap of all the major market news and events from around the world, including the latest US and international COVID trends.
With consensus estimates anticipating headline CPI to rise 0.3% on a month/month basis in September, it would represent the 10th straight month that headline inflation came in ahead of the five-year average of 0.2%. That being said, if the actual m/m increase comes in close to forecasts of 0.3% it will clearly represent a slowdown in the pace of price increases from the spring and summer months. Still above average, but getting back more in line with the historical norm.

Start a two-week trial to Bespoke Premium and read today’s full Morning Lineup.
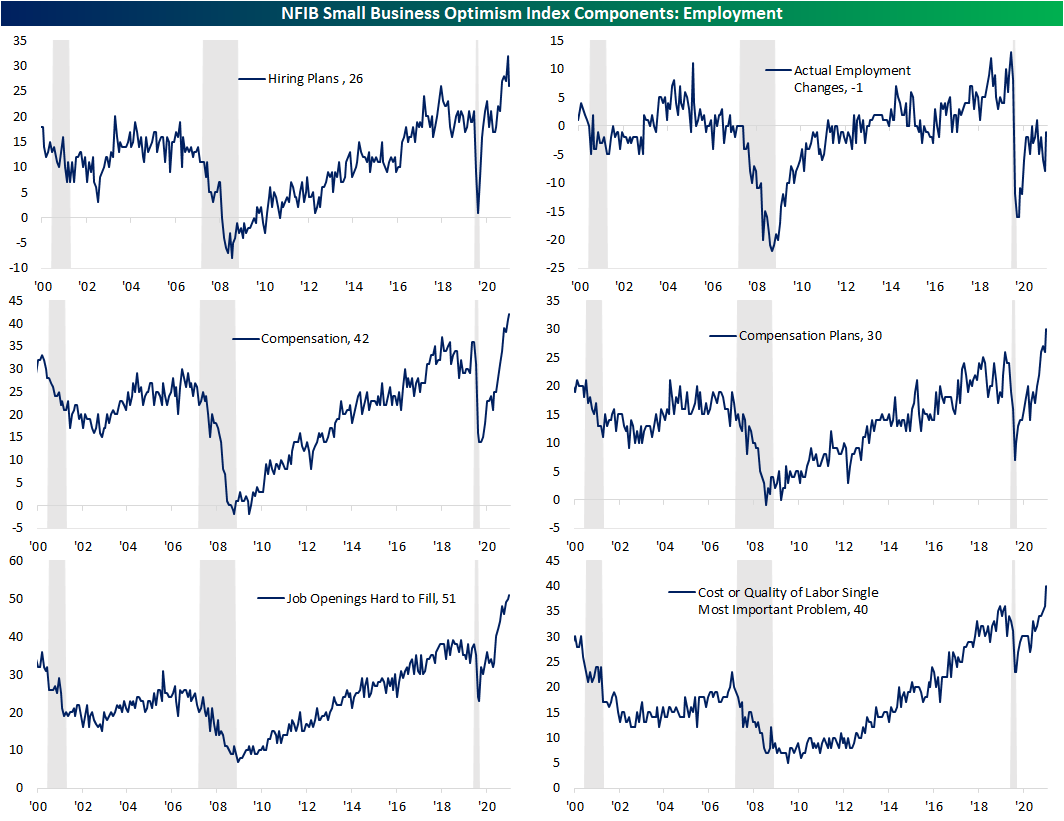
Labor Top of Mind For US Small Business
The most important problems section of this month’s NFIB report on small businesses showed one clear problem: labor. A combined 40% of businesses reported either cost or quality of labor as their single most pressing issue. While the percentage of respondents stating the quality of labor as the biggest issue went unchanged at 28%, there was a record one-month increase in the percentage of firms stating costs were their biggest problem. The percent reporting cost of labor as their biggest issue rose 4 percentage points to a record high of 12%.

While a massive share of respondents reported either cost or quality of labor as their biggest issue, the next largest share sees government-related issues as the biggest concern. A combined 28% reported either taxes or government requirements & red tape as their most important problems which is actually a muted share on a historical basis. Even though it was up 1 percentage point to 17% in September, the percentage reporting taxes as their biggest problem sits in the bottom decile of the historical range and the reading on government requirements and red tape sits in the 15th percentile.
As for the other readings, Poor Sales, Competition from Big Business, and Financial & Interest Rate concerns are at record lows. While not at a record low, the Cost/Availability of Insurance fell by a record amount. Inflation also experienced a historic drop of 3 percentage points in September. With that said, 10% of owners still reported that as their biggest problem which is still in the top 5% of all readings. The single biggest gainer in September was “Other”. This category is not as old as the other problems but the 7 percentage point surge was a record jump in a single month and leaves the reading at one of the highest levels to date. Click here to view Bespoke’s premium membership options.

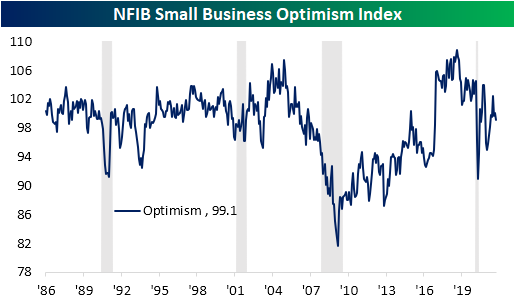
Small Business Optimism Back Below 100
Small business optimism measured through the NFIB’s monthly survey dipped in September by a full point to a six-month low of 99.1. That is in the middle of the pandemic range as small business sentiment never quite fully recovered to pre-pandemic levels let alone its August 2018 record high.
Breadth in this month’s report was mixed perhaps leaning slightly more negative with nine categories falling month over month while seven were higher. Another three went unchanged. The largest declines were for plans to increase employment and expectations for the economy to improve. While those were the two biggest decliners, they are coming from polar opposites of their respective ranges. The index tracking plans to increase employment remains in the top 2% of readings even after the six-point decline that ranks in the bottom 2% of all monthly moves. Meanwhile, the magnitude of the decline in the index for expectations for the economy to Improve ranks in the 20th percentile of all other monthly readings, but that leaves it just off of a record low. In other words, readings throughout the report are nuanced with some at or near record highs and others at or near record lows.
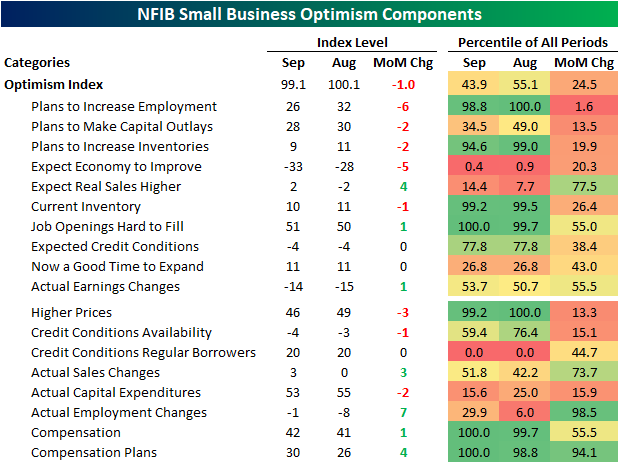
As previously mentioned, Outlook for General Business Conditions plummeted in September showing that a net -33% of reporting owners foresee better business conditions in six months. The only two months with weaker readings on record were November and December of 2012 just after President Obama’s re-election. Given that weak reading, the number of firms that see now as a good time to expand remains muted with this month’s reading unchanged at 11 which is short of the bottom quartile of the historical range. Actual sales changes improved back to a positive reading that sits in the middle of its range. Sales Expectations also improved to positive territory, but that reading is far lower with respect to its historic range. Earnings changes also improved as fewer businesses reported higher prices although that reading remains well above any other period in the history of the report.

In today’s Morning Lineup, we discussed some of the price and labor pressures evident in the report. Revisiting these, firms continue to show strong albeit slowing labor demand as hiring plans remain elevated but dropping sharply month over month. Meanwhile, Actual Employment Changes rose sharply, though, this reading remains negative. Additionally, firms have continued to raise compensation and plan to continue to do so as a record number reported that openings are hard to fill.
Not only did plans for employment fall but so too did capital expenditure plans as well as actual capital expenditures. Inventory levels are also abating to a degree as fewer—but still a historically high share—report current inventory levels are too low. There was also a 2 point pullback to 9 in the net percent of businesses looking to increase inventory plans. Click here to view Bespoke’s premium membership options.

US Outperforms the Rest of the World… Again
In January of this year, we looked at the relative performance of the United States versus the rest of the world (ROW). At the time, ROW was making up lost ground relative to the US, but that didn’t last long. Through the first three quarters of 2021, the US (SPDR S&P 500 ETF-SPY) picked up steam once again and has significantly outpaced both the rest of the world (Vanguard FTSE All-World ex-US ETF- VEU) and emerging markets (iShares MSCI Emerging Markets ETF- EEM). Emerging markets have been the underperformers of the group while the US has led. Although EEM outperformed at the beginning of 2021, the index has since moved lower while the US trudged higher right up through early September. YTD through the end of Q3, SPY has outperformed EEM by 19.5 percentage points, which ranks as the second-widest spread between the two ETFs since EEM started trading in 2004. While not to the same degree, the US has also notably outperformed the rest of the world as well with a performance gap of 12.4 percentage points.

Over the last 17 years, Q4 performance has been mixed after the performance spread between SPY and EEM during the first three quarters of the year was in the double digits. Since 2004, there have been five prior occurrences, and in three of those years, SPY continued to outperform in Q4 while it lagged twice. Over the last decade, EEM has only outperformed SPY two times through the end of Q3 (2016 and 2017), and this year is the fourth in a row where SPY outperformed EEM.

Similar to EEM, SPY has also steadily outperformed VEU in the first three quarters of the year with outperformance in 11 of the last 14 years. Interestingly, in the three years where SPY lagged VEU, it outperformed in Q4 all three times. Like this year, SPY outperformed VEU by double-digit percentages in the first three quarters of the year only three other times since 2008. The last two times there was a positive double-digit spread (2018 and 2020), VEU outperformed for the remainder of the year.
Investors often look to play trends in the first three quarters of the year for a continuation through Q4 or a reversion to the mean. However, in terms of big performance gaps between US stocks and both international and emerging markets in the first three quarters of the year, like the analysis we highlighted last week with sectors, historically there’s been no discernible trend of either a continuation or reversal of that trend in Q4. Click here to view Bespoke’s premium membership options.

Bespoke Brunch Reads: 10/10/21
Welcome to Bespoke Brunch Reads — a linkfest of the favorite things we read over the past week. The links are mostly market related, but there are some other interesting subjects covered as well. We hope you enjoy the food for thought as a supplement to the research we provide you during the week.
While you’re here, join Bespoke Premium with a 30-day free trial!
Florida
Cathie Wood’s ARK Departs NYC With Shift to Florida Office by
The team behind ARK Invest has closed its New York City office and moved its headquarters and operations to St. Petersburg, Florida, an untraditional hub for high finance. [Link]
Miami Vice’s Journey From Misfire to Masterpiece by Bilge Ebiri (Vulture)
A retrospective on Michael Mann’s 2006 reboot of the iconic 1980s television series, and how its many pitfalls have started to look much better with age. [Link]
Reopening
This Halloween, Americans Are Ready to Party Like It’s 2019 by Alyssa Meyers (Morning Consult)
Only 42% of American adults reported they were planning to celebrate Halloween during the pandemic-dominated 2020. But this year, numbers are back to normal, with more than half saying they’ll partake. [Link]
New Zealand admits it can no longer get rid of coronavirus by Nick Perry (AP)
Relative to its population, New Zealand has suffered roughly one quarter of one percent as many deaths as the US, but the sterling performance of lockdowns and test and trace in New Zealand has finally reached too high of a cost for the island nation. [Link]
Climate
Pick-up trucks and climate politics: will American drivers go electric? by Claire Bushey (FT)
A comprehensive review of the American auto industry’s efforts to get Americans to drive electric pickups, which the industry is hoping will play a spectacular role in fueling both profits and emissions reductions. [Link; soft paywall]
Feeding Cattle Seaweed Reduces Their Greenhouse Gas Emissions 82 Percent by Diane Nelson (UC Davis)
A study found that adding 3 ounce doses of seaweed to cattle feed helped reduce their methane emissions by more than 80% with no impact for their weight gain. [Link]
Labor Markets
The fast-food chain Raising Cane’s is sending corporate staff to work as fry cooks, cashiers, and recruiters in its restaurants amid an expansion drive and the labor shortage: report by Stephen Jones (Insider)
It’s getting so bad in low-prerequisite labor markets that one chicken finger chain is re-tasking corporate headcount from spreadsheets and presentations to deep frying and customer service. [Link]
Teens Are Being Trained to Drive 18-Wheelers Amid Truck Driver Shortage (Inside Edition)
A California program is putting teens behind the wheel to train them to drive trucks. Boosters hope the new drivers will alleviate a labor shortage and provide good-paying careers for teenagers just out of high school. [Link; auto-playing video]
Casino’s Open
Is the Stock Market Open at 3 a.m.? This Startup Says It Should Be by Alexander Osipovich (WSJ)
A new startup exchange has filed for permission to act as a 24/7 trading venue for stocks similar to the always-on crypto markets. Existing electronic exchanges for equity-linked assets like futures are still not operating around the clock, despite much longer trading hours than US cash equity markets. [Link; paywall]
Traders phone up gambling helplines as game-like broker apps spread by Madison Darbyshire (FT)
Day traders are piling in to gambling addiction recovery groups and the SEC is looking in to the practice of gamification by app-based brokers as well as how they undermine small investors. [Link; soft paywall]
Crypto
Anyone Seen Tether’s Billions? by Zeke Faux (Bloomberg)
A global hunt for the investments that back the world’s most popular stablecoin, and a deep dive into the team that claims to be standing guard over tens of billions in client assets. [Link; soft paywall]
An Irate Collector Is Suing the NFT Platform Nifty Gateway Over the Terms of a Very Weird Beeple Auction by Sarah Cascone (Artnet)
As if losing an auction for an extremely rare NFT wasn’t enough, one investor still had to pony up for the second-place offering, part of what can only be described as an obvious scam that is par for the course in the wild west of digital art. [Link]
Big Thoughts
The long-run effects of religious persecution: Evidence from the Spanish Inquisition by Maricio Drelichman, Jordi Vidal-Robert, and Hans-Joachim Voth (PNAS)
The upheaval of persecutions during the Spanish Inquisition was so dramatic that it has a direct impact on incomes, education levels, and social trust levels in Spain half a millennia after the original conflict. [Link]
We have no theory of inflation by Duncan Weldon (Value Added)
A long musing on the dearth of viable inflation models and why that complicates the task of monetary policy setting in both directions. [Link]
The Mafia
Lousy Management, Knucklehead Hires Plague Operations of Real-Life Sopranos by James Fanelli (WSJ)
A reliance on phones, less street smarts, and a cushy suburban upbringing make the newest generation of mobsters poorly suited to the role of wise guy, and a major liability when indictments come down. [Link; paywall]
Hand-Wringing
Valuation not stories ultimately determines investment returns by Richard Bernstein (FT)
The latest in a long string of luminaries blames the Federal Reserve for perceived ills in the market, while simultaneously comparing the current bubble to the tech boom in the late 1990s when monetary policy was much less accommodative. [Link; soft paywall]
Real Estate
The feared eviction ‘tsunami’ has not yet happened. Experts are conflicted on why. by Rachel Siegel and Jonathan O’Connell (WaPo)
The end of a national eviction moratorium has come and gone, but the number of evictions has not surged in a much of the country, puzzling experts who worried millions would be cast out during the pandemic. [Link; soft paywall]
Serial
Zodiac Killer Allegedly Identified by Team of Independent Investigators by Trace William Cowen (Complex)
While police representatives argue the findings are incorrect, a team of independent investigators claims to have identified the Zodiac serial killer who haunted the San Francisco Bay Area in the 1970s. [Link]
Vaccines
In major decision, WHO recommends broad rollout of world’s first malaria vaccine by Helen Branswell (StatNews)
A 4-dose malaria vaccine has been recommended for broad use by the World Health Organization following promising clinical trials in sub-Saharan Africa. [Link]
Governing
Idaho lieutenant governor bans vaccine mandates, tries to deploy National Guard during governor’s 2-day trip by Peter Weber (Yahoo!/The Week)
For the second time this year, the Lieutenant Governor of Idaho has usurped the Governor of that state to make policy changes while the Governor is out of the state. [Link]
Social Media
Facebook Is Not a Teen Favorite, Survey Says. These Social-Media Sites Are. by Eric J. Savitz (Barron’s)
Teenagers prefer Snapchat and TikTok to Facebook’s Instagram platform or the core site. Twitter and Twitch were also well down the popularity list. [Link; paywall]
Read Bespoke’s most actionable market research by joining Bespoke Premium today! Get started here.
Have a great weekend!
Best and Worst Performing S&P 500 Stocks in 2021
The fourth quarter is now off to the races and we thought it worthwhile to check in on the best and worst-performing S&P 500 stocks on a year-to-date basis. As shown below, there are currently six members of the index that have rallied over 100% this year. Apt for the year that its vaccine has rolled out, the biggest gainer of these has been Moderna (MRNA) with a 196.12% rally. It now has a market cap of $124.87 billion versus a market cap of only $41 billion at the start of the year. Of the 20 best performers, MRNA is also the only one with a market cap above $100 billion. The next largest is ConocoPhillips (COP) with a $95.76 billion market cap. COP is one of multiple Energy stocks on this list as well. Of the top 20 performers, Energy sector names dominate the list with 8 members.

Pivoting to the other end of the spectrum, Las Vegas Sands (LVS) is down the most this year having been cut by 36.18%. IPG Photonics (IPGP), Lamb Weston Holdings (LW), Viatris (VTRS), MarketAxess (MKTX), and Global Payments (GPN) also have fallen by at least 25%. Once again, there is only one member of this list with a market cap above $100 billion: Qualcomm (QCOM). One other interesting factor to note of the worst performers is there are several stocks that were at some point plays on pandemic trends, whether those be reopening or stay at home. For example, in addition to LVS, another gaming/reopening name, Wynn Resorts (WYNN), ranks as the eighth-worst performer YTD. Additionally, strong performers during the onset of the pandemic like Clorox (CLX), Activision Blizzard (ATVI), and Take-Two Interactive (TTWO) are all down double digits this year. Click here to view Bespoke’s premium membership options.

The Bespoke Report – 10/8/21 – Sitting in Limbo
This week’s Bespoke Report newsletter is now available for members.
After some rocky trading to kick off the month, it was hard for many to believe that the S&P 500 was actually up over 2% in the first full week of October. Regardless of how it got there, a win is a win no matter how messy it was. Despite the rally to kick-off October, the S&P 500 finished the week right around 3% from its record closing high on September 2nd.
Some people reading this are enjoying a three-day weekend in observance of Columbus Day on Monday, but the market will be open on Monday, and investors will be looking for major US indices to show some signs of which way they plan to break out of the current state of limbo we find ourselves in heading into the weekend. Will earnings season be the catalyst to get stocks back to their recent highs, or will the fact that this week’s rally ran out of steam just shy of the 50-day moving average end up, in retrospect, being the beginning of a new leg lower?
In this week’s Bespoke Report, we’ll look to shed some light on these questions as well as recap some of the key trends facing the market. There are a ton of insights on both markets and the economy in this week’s newsletter, and you can read it now with a two-week trial to our subscription service — Bespoke Premium. Click here to learn more about Bespoke Premium and start a two-week trial if you’re interested.

