Bespoke’s Morning Lineup – 11/8/21 – More New Highs
See what’s driving market performance around the world in today’s Morning Lineup. Bespoke’s Morning Lineup is the best way to start your trading day. Read it now by starting a two-week trial to Bespoke Premium. CLICK HERE to learn more and start your trial.
“If you wish to increase your success rate, double your failure rate.” – Thomas Watson
There’s a modestly positive bias to the equity market following a week where new highs were seen across just about every major US average. This morning, the big moves have been seen in the crypto markets where ether is at record highs, and bitcoin is testing its highs from late October.
There haven’t been any major earnings reports yet to speak of today, but that pace will pick up again after the close with PayPal (PYPL) leading the charge. Economic data is also getting off on a slow start to the week, but Tuesday’s PPI and Wednesday’s CPI will be the most important reports of the week to watch.
In terms of Fedspeak today, a number of officials (including Powell) are scheduled to speak throughout the day.
Read today’s Morning Lineup for a recap of all the major market news and events from around the world, including the latest US and international COVID trends.
As mentioned above, it was a banner week for the US equity market as just about every major index touched and closed out the week right at record highs. In terms of the Russell 2000, Nasdaq, and S&P 500, last week was the first time since early February that all three of these indices had record closing highs on the same day. For all three indices, the recent moves are all starting to look extremely steep, and while they’re great for anyone who is long the market, they won’t last forever.

Start a two-week trial to Bespoke Premium to read today’s full Morning Lineup.
Bespoke Brunch Reads: 11/7/21
Welcome to Bespoke Brunch Reads — a linkfest of the favorite things we read over the past week. The links are mostly market related, but there are some other interesting subjects covered as well. We hope you enjoy the food for thought as a supplement to the research we provide you during the week.
While you’re here, join Bespoke Premium with a 30-day free trial!
Logistics
Highly Paid Union Workers Give UPS a Surprise Win in Delivery Wars by Thomas Black (Bloomberg)
While UPS pays a higher wages for its unionized workforce, it’s had no trouble managing the current labor market environment while rival FedEx has racked up hundreds of millions in extra costs. [Link; soft paywall]
I’m A Twenty Year Truck Driver, I Will Tell You Why America’s “Shipping Crisis” Will Not End by Ryan Johnson (Medium)
An inside look at how port snarls are playing out in practical terms. While the analysis is hyperbolic and excessively pessimistic, it does illustrate the challenges at stake in sorting out the logjam of US transportation. [Link]
Long Reads
The posthuman dog by Jessica Pierce (Aeon)
If humans disappeared, dogs would survive. In fact, there’s a case to be made that they might be better off, implausible as that sounds. But the real takeaway: we can make space for our four legged friends to be dogs without disappearing entirely. [Link]
When “Foundation” Gets The Blockbuster Treatment, Isaac Asimov’s Vision Gets Lost by Julian Lucas (The NYer)
A reflection on the challenges of translating a novel series based on a history textbook into a prestige TV show, both in general and thanks to the cultural narratives which swirl in 2020s America. [Link]
Crypto
Eric Adams vows to make NYC crypto-friendly, explore city’s own coin by Will Feuer (NYP)
New York’s new mayor is apparently taking a page out of the Miami playbook and hoping to focus the nation’s largest city on issuing new coins for the masses. [Link]
What Happens to Your Crypto When You Die? (Bloomberg/AP)
A users guide to making sure that the crypto you hold in this life doesn’t go into the grave if you pass on. [Link; soft paywall]
New Business Models
Zillow Shuts Home-Flipping Business After Racking Up Losses by Patrick Clark (Yahoo! Finance/Bloomberg)
After ploughing billions into a business designed to profit from guaranteed offers and quick resales of residential inventory, Zillow has decided to shutter the business after declaring failure. [Link]
A New Generation Leads Chick-fil-A’s Growing Flock by Heather Haddon (WSJ)
An interview with the latest Cathy family scion to lead the fried chicken giant, which is one of the most profitable US fast food businesses. [Link; paywall]
Ford makes classic pickup electric in surprise one-of-a-kind F-Series truck reveal by Phoebe Wall Howard (Detroit Free Press)
In a bid to show off the flexibility of its EV platform with a remodeled F-100 pickup dating to the 1970s…powered entirely with electric motors and batteries. [Link; auto-playing video]
Industry
Steel Is Back by Robinson Meyer (The Atlantic)
A US-EU pact designed to reduce tariffs on steel produced using less carbon-intensive measures was announced this week, with full support of US steel companies and workers. The new approach could represent a path forward for using trade incentives as a way to shift climate policy. [Link; soft paywall]
Poison in the Air by by Lylla Younes, Ava Kofman, Al Shaw and Lisa Song (ProPublica)
While the EPA does a reasonably good job restricting carcinogenic emissions from a single source, it doesn’t always take into account the compounding risks of multiple adjacent plants which can create horrifying cancer and other disease burdens for surrounding residents. [Link]
Read Bespoke’s most actionable market research by joining Bespoke Premium today! Get started here.
Have a great weekend!
Best and Worst Performers Since the COVID Crash Low
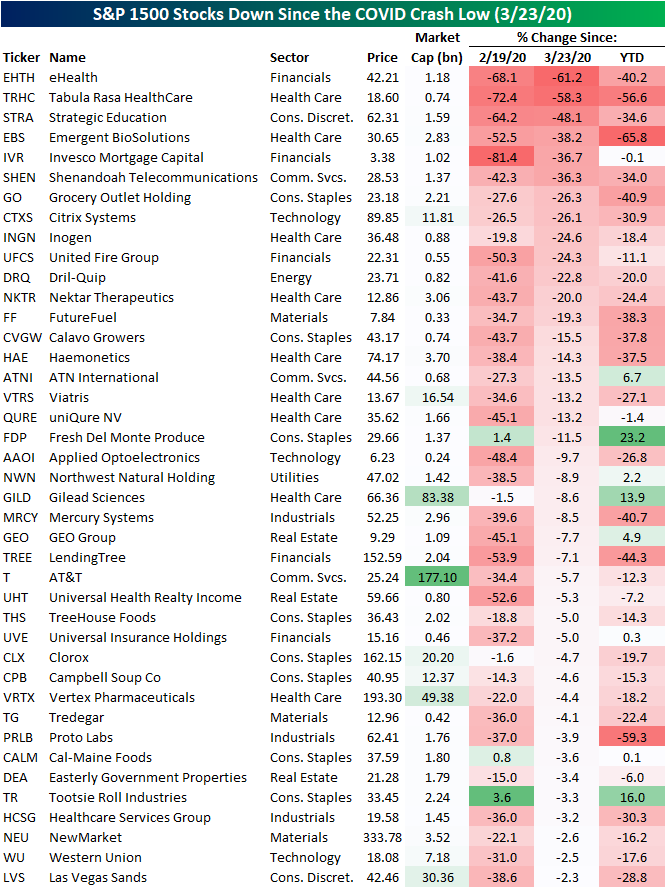
The major indices have consistently been hitting new record highs over the past few days with the S&P 500 having now more than doubled off the COVID Crash low on March 23, 2020. As for individual stocks, there are currently only nine S&P 500 stocks that are below their levels from March 23, 2020, and expanding the universe to the S&P 1500 which includes small and mid-caps, there are currently 41 stocks that are below their levels from that date. Obviously, March 23, 2020 may not coincide with a particular high or low point on these individual stocks’ charts, but declines since then would be quite painful to handle given that the broad market has more than doubled over the same time frame.
As shown below, eHealth (EHTH) currently is the biggest decliner versus March 23, 2020 levels having fallen over 60% with a large share of that decline occurring this year. The only other stock that has been more than cut in half since the bear market low is Tabula Rasa HealthCare (STRA). TRHC has been declining since the spring, but a large share of that decline is actually occurring today after it reported an EPS and sales miss in addition to lowered guidance on earnings last night. Today, the stock has fallen nearly 50% in reaction to those weak earnings. There are a handful of stocks on this list that are up on a year-to-date basis with Fresh Del Monte Produce (FDP), Tootsie Roll Industries (TR), and Gilead Sciences (GILD) the only ones that are up double digits. While below their levels from the bear market low, TR and FDP are also two of the only stocks that are simultaneously above levels from February 19, 2020 which marked the last high prior to the start of COVID Crash bear market.
As for the stocks that have gained the most since the COVID Crash low on 3/23/20, meme mania darling GameStop (GME) still tops the list having rallied 5,492%. That is twice the rally of the next best performer, SM Energy (SM). As for the rest of the top performers since the bear market low, there are another 15 that have gained over 1,000%. One of those is a member of the trillion-dollar market cap club: Tesla (TSLA). Another one of these top performers, Tupperware Brands (TUP), is also one of the only stocks that is actually lower on a year-to-date basis, and those declines are significant at a 43.81% loss. TUP got below $2/share at its lows during the COVID Crash, but then surged back into the mid-$30s in late 2020. It has since moved back down into the teens. Click here to view Bespoke’s premium membership options.

Heard on Conference Calls – 11/5/21
Below are some of the most interesting things we heard on quarterly conference calls from Corporate America this week:
Supply Chain
Clorox (CLX) CFO Kevin Jacobsen commented, “We now project that transportation costs will remain elevated.”
![]()
Jacobsen continued, “We’re facing an even tougher cost environment than previously expected.”
SolarEdge Technologies (SEDG) CEO Zvi Lando referenced the “unprecedented logistics and supply chain challenges” and “a twelve week COVID-related shutdown in our Vietnam manufacturing facility” as restraining factors.
![]()
The SEDG management team referenced high demand for their products throughout the call, and made it clear that supply constraints were holding back growth. CFO Ronen Faier added, “whatever we can manufacture, we’re shipping.”
Some companies seem to be better insulated than others in terms of the supply chain headwinds. Lumen (LUMN) CEO Jeffrey Storey stated, “We’ve been in close communication with our diverse and reliable supplier base and have commitments from them on their ability to deliver. However, we take nothing for granted and this is an area where we will continue to closely monitor.”
![]()
Energy
Intercontinental Exchange (ICE) President Benjamin Jackson stated, “The supply shortages and price volatility that we saw in the third quarter are a peek into the future of what the energy transition could look like.”
![]()
Jackson later added, “Energy consumption is expected to double over the next 30 years, yet carbon emissions are expected to be reduced by half. This imbalance in supply and demand will introduce additional complexity and volatility to energy markets.”
Although Diamondback Energy (FANG) ramped up oil production during prior bull trends in oil prices, management is committed to maintaining oil production at current levels. According to CEO Travis Stice, “Moving to 2022, we are committed to holding our Permian oil production flat next year.” Oil demand has been robust, and the market is in need of a supply hike to lower prices for consumers. At FANG at least, increased supply does not appear to be coming.
![]()
Inflation
Jacobsen stated, “we plan to take additional actions, including more pricing, resulting in increases to about 70% of our portfolio.” Based on this, consumers should expect to continue to face higher prices for products.
Johnson Controls (JCI) CFO Olivier Leonette added, “we do expect supply chain constraints and the inflationary environment to continue at least over the next couple of quarters.” Leonette continued, “The inflated level of pricing will result in margin headwinds”.
![]()
Broader Economy
Retail spending seems to be making a comeback, and Simon Property Group (SPG) CEO David Simon pronounced, “demand for our space from a broad spectrum of tenants is growing. Occupancy gains continued, retails sales accelerated… and cash flow increased.”
![]()
The quotes above are from our detailed Conference Call recaps. Throughout earnings season, we publish Conference Call recaps for select companies. These summaries include information regarding each company’s financial results, growth by segment, as well as some aspects of the business that management expects to impact future results. As always, none of these summaries should be construed as recommendations to buy or sell any securities, and investors should do their own research and/or consult with a financial professional before making any investment decisions.
Our Conference Call recaps are available to Bespoke Institutional subscribers only. If you’re not currently a Bespoke Institutional subscriber, click here to sign-up for or upgrade to Bespoke Institutional now.
Bespoke Conference Call Recaps Published So Far This Earnings Season:
Johnson Controls (JCI)
Cloudflare (NET)
AmerisourceBergen (ABC)
Lumen Technologies (LUMN)
Diamondback Energy (FANG)
Sprout Social (SPT)
SolarEdge Technologies (SEDG)
Simon Property Group (SPG)
Clorox (CLX)
Apple (AAPL)
Amazon (AMZN)
Merck (MRK)
United Rentals (URI)
Ford (F)
Automatic Data Processing (ADP)
Boeing (BA)
Evercore (EVR)
McDonald’s (MCD)
Alphabet (GOOGL)
Microsoft (MSFT)
Digital Realty (DLR)
3M (MMM)
Facebook (FB)
Olin (OLN)
Tesla (TSLA)
Equifax (EFX)
Baker Hughes (BKR)
Netflix (NFLX)
Intuitive Surgical (ISRG)
Johnson & Johnson (JNJ)
NextEra Energy (NEE)
BIG Charts of the Week – 11/5/21
You’ve likely seen Bespoke’s premium research before, but we continue to publish unique and timely analysis in reports like our Morning Lineup, BIG Tips, Sector Snapshot, Bespoke Baskets, Closer, and more.
Additionally, this week’s Bespoke Report newsletter is our Quarterly Macro Summary — a multi-page powerpoint-style PDF that is easily digestible but super informative. You can see Bespoke’s current thoughts on global markets and the economy in this report.
Gain access by simply starting a two-week trial to any of the three Bespoke membership levels listed below. You can view our membership options here.
Join Bespoke Newsletter (Weekly Bespoke Report + COTD; Lowest price)
Join Bespoke Premium (Newsletter research + Morning Lineup, BIG Tips, and more)
Join Bespoke Institutional (Access to everything!)
As earnings season winds down, the market posted another positive week to begin the month of November. Below is a look at a handful of charts published this week that we thought were interesting or noteworthy. Receive charts and analysis like this in your inbox daily by signing up for a two-week trial to Bespoke Premium.
The S&P 500 finished October with a 5%+ gain. Below we show how the S&P has historically done in the month after 5%+ monthly gains:

This week, the Federal Reserve announced the long-awaited taper. Since Powell became Fed chair, there has been a pattern of posting solid intraday gains prior to the 2 PM announcement but then trading sharply lower during the Fed press conference into the 4 PM close. As shown below, the opposite trend emerged when the taper was announced on Wednesday.

The 7-day average of US air passenger traffic was 1.94 million yesterday. Although this is a 124% y/y increase, this level still represents a 23% decline on a 2-year basis. Additionally, this constitutes a week over week decline.

We saw yet another week of declines in initial jobless claims. On a non-seasonally adjusted basis, claims are now only slightly above March 2020 levels. This comes in a week that normally sees claims increase. As shown below, non-seasonally adjusted claims have been falling at a time of year when they usually start to increase, indicating strength in the labor market.

After trading in a sideways range for the last nine months, small-caps finally broke out above resistance this week, which could clear the way for another leg higher.

In terms of annual performance, the S&P 500 is on pace for a three year streak of 15%+ price gains. This current streak is second only to the 1990’s, in which 5 consecutive years saw gains of 15%+. This would be only the second time that a streak of this length has been achieved since 1929!

Receive charts and analysis like this in your inbox daily by signing up for a two-week trial to Bespoke Premium. Sign up now to read this week’s Bespoke Report!
Historic Run For Consumer Discretionary
Recently we have made note of the massive outperformance of the Consumer Discretionary sector. Prior to this week, the bulk of the gains were a result of the rise in Tesla (TSLA), but this week, breadth has significantly improved as we noted in yesterday’s Sector Snapshot. With more stocks in the sector participating in the rally, price has continued to move higher.
Yesterday marked one month from the recent low in price for the sector. Through yesterday’s close, the sector had gained 16.11% over the last month. Moving higher yet again today as of this writing, the sector is now up 17.5% from the low.

In the chart below, we show the rolling one-month performance of the sector going back to late 1989. As shown, the surge in the past month ranks in the top 1% of readings on record. It has been the largest one-month gain since April of last year when the sector was coming off of the bear market low. Prior to that, the only other period of the post-GFC era to have seen as large of a rally in one month’s time was January 2019.

With the sector having gone on a historic run over the past month, it begs the question of how much gas may be left in the tank. Historically, when the sector has gained at least 15% in a one-month span without having done so in the prior three months, forward returns have been in line to slightly below average, although they are also not outright negative with positive returns better than half the time. Several of these prior occurrences happened around the time of the Dot Com burst, and performance following those periods was broadly negative.

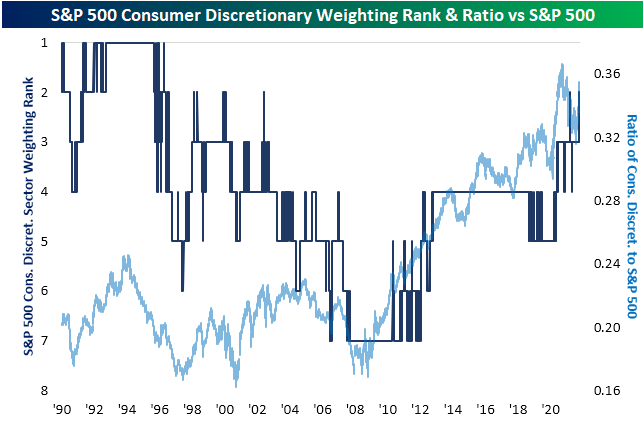
This week the sector has also crossed above a 13% weighting in the S&P 500, overtaking Health Care as the second-largest sector in the index! Earlier this year, on April 12 and 13, Consumer Discretionary had also managed to rank as the second-largest sector but it only held that place briefly. Prior to that, the last time Consumer Discretionary was the second largest sector was 2002. Click here to view Bespoke’s premium membership options.

The Bespoke Report Newsletter – 11/5/21 – Shock & Supply: Energy, Capex, Labor, & Inflation In Q4
This week’s Bespoke Report newsletter is now available for members.
This week’s Bespoke Report is our Macro Quarterly summary of big trends from around the global economy and financial markets. We review recent policy decisions from the Fed and other global central banks, the recent massive shocks to energy markets and what comes next for those commodities, supply shortages in other contexts…and how the global economy may respond to these large swings driven by changing consumer demand, policy stimulus, and the COVID pandemic. We also review October labor market data from the BLS’ employment situation report, and the current high-level backdrop for US equity markets.
To read this week’s full Bespoke Report newsletter and access everything else Bespoke’s research platform has to offer, start a two-week trial to one of our three membership levels.


Bespoke’s Morning Lineup – 11/5/21 – Semi-Important Jobs Days
See what’s driving market performance around the world in today’s Morning Lineup. Bespoke’s Morning Lineup is the best way to start your trading day. Read it now by starting a two-week trial to Bespoke Premium. CLICK HERE to learn more and start your trial.
“I don’t mind going back to daylight saving time. With inflation, the hour will be the only thing I’ve saved all year.” – Victor Borge
First things first. Don’t forget to set your clocks back Saturday night before going to bed. Now, on to the markets. Futures are higher again this morning as the S&P 500 looks to close out a perfect week with record closing highs every single day. Last night was a busy one for earnings, so the positive tone in futures suggests that despite some misses, investors were pleased with what they heard. Now the focus shifts to the October jobs report where economists are expecting just over half a million new jobs. The last two reports have had some pretty significant misses relative to expectations, so we’ll see if the trend breaks this month.
Read today’s Morning Lineup for a recap of all the major market news and events from around the world, including the latest US and international COVID trends.
The performance of the semiconductor sector lately has been stunning. After successfully testing its 200-DMA in mid-October, the semiconductor sector ETF (SMH) has surged to record highs. More recently, the Philadelphia Semiconductor Index (SOX) has rallied more than 1% every day this week.

With just 36 prior streaks of four or more days in the last 25 years, these kinds of streaks don’t happen very often but they aren’t unprecedented. Streaks of five or more days are much more uncommon though. There have only been 12 prior streaks where the SOX was up 1%+ for five straight days. Currently, the SOX is indicated to open up about 0.60%, so an extension of the current streak to five can’t be ruled out at this point, although the jobs report will have a say in that. Moving on, there have only been four prior streaks where the SOX was up 1%+ for more than five straight days, and all of those streaks ended at six trading days.

Start a two-week trial to Bespoke Premium to read today’s full Morning Lineup.
Sentiment Soaring Across Surveys
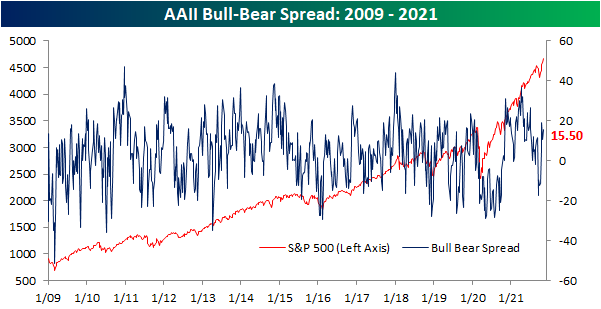
Major US indices have continued to press to new all-time highs, and this time around, that includes small caps. As such, sentiment has moved higher in tow with this week’s reading from the American Association of Individual Investors weekly sentiment survey showing the percentage of respondents reporting as bullish rising from 39.8% to 41.5%. While higher versus last week, that is only a modest recovery from last week’s 7.1 percentage point decline from the recent high of 46.9%. Overall, that reading points to a strong but far from historically extended reading on market optimism.

Bearish sentiment, on the other hand, has experienced more persistent declines. The percentage reporting as bearish fell to 26% this week which marks the lowest reading since the end of July when less than a quarter of respondents reported as such. As with bullish sentiment, that reading is by no means extreme only a few percentage points below the historical average.

Given the moves in bullish and bearish sentiment, the bull-bear spread ticked higher to 15.5 which again is stronger but not back up to the high from two weeks ago.
Neutral sentiment saw a decent sized 5.3 percentage point uptick last week. This week saw another, albeit smaller 1.8 percentage point uptick to 32.5% this week. Even more so than bullish and bearish sentiment, that leaves the reading essentially right in line with the historical average of 31.43%.

Again, the AAII’s survey has shown that sentiment has grown increasingly positive though it is not flying. Other sentiment readings are soaring though. For example, the National Association of Active Investment Managers’ Exposure Index has seen a sharp rise over the past few weeks with the past two seeing readings above +100. With regards to this index, readings above +100 indicate responding managers are reporting that they are fully invested long, +200 would indicate they are leveraged long, zero would be market neutral, -100 would be fully short, -200 would be leveraged short. This week marked the first back-to-back readings above +100 and the strongest levels since February of this year

In addition to those two indices, the Investors Intelligence survey also saw bullish sentiment rise to one of the strongest levels since the summer gaining double-digit percentage points in the past two weeks alone. In other words, across indicators on sentiment, there has been a notable uptick in bullishness over the past few weeks. To quantify this across indicators, below we created a composite index of the three surveys. This composite shows the average standard deviation of each one from its historical average. As shown, this week’s uptick across indicators resulted in the composite moving into the upper decile of historical readings since 2006. Additionally, the increase in the past four weeks has been one of the largest in exactly two years with only a small handful of larger upticks going back to 2006 when the newest of these indicators—the NAAIM index—begins. Click here to view Bespoke’s premium membership options.

Claims Diverge From Seasonal Norms
Another week, another pandemic low for jobless claims with the seasonally adjusted initial reading falling to 269K. That compares to an upward revision to 283K last week and expectations of a decline to only 278K. At current levels, initial claims are now only y 13K above the levels the week of March 13, 2020; the last week before claims began to print in the millions.

On a non-seasonally adjusted basis, claims are also only slightly above those March 2020 levels falling another 7K to 240.2K this week. With the expiration of the program now in the rearview, PUA claims are down to negligible levels and are continuing to come in lower with this week only showing 2.2K claims.

When it comes to the unadjusted number, last week marked a third consecutive week of lower claims, and that is in the context of a longer stretch of declines. From the week of July 23rd to the end of October, there were only two weeks in which non-seasonally adjusted claims were higher week over week: September 17th and October 8th. While claims typically decline in late Summer, the continued declines into the fall are certainly unusual from a seasonal perspective. As shown below, from around the time of Labor Day through the end of the year, claims have historically seen a gradual move higher. But rapidly coming off of historic levels from the pandemic, that has not been the case in 2021 as this fall has seen a divergence from seasonal patterns.

Continuing claims have also continued to decline hitting pandemic lows. At 2.105 million through the week of October 22nd, claims are a few hundred thousand above the March 13, 2020 level of 1.784 million.

On a nonseasonally adjusted basis, regular state claims came in below 2 million for a second week in a row which hasn’t happened since December 2019. Additionally, at 1.889 million, claims are at the lowest level since December 2019. Factoring all other programs creates an additional week of lag making the most recent data through October 15th. Total unadjusted claims as of that week set another low of 2.68 million, down 159K from the prior week. Regular state claims were the main driver of that decline as PUA and Extended Benefits programs actually saw modest upticks. For PUA claims, that was the first higher reading on a week over week basis since the official expiration of the program in the first week of September, and it was the first uptick in the Extended Benefits program in five weeks. While that indicates a modest reversal of recent trends, it will likely prove to only be temporary as those programs are not supported to the same extent as they used to be. Click here to view Bespoke’s premium membership options.
