A Record Share of People Leaving Jobs Are Quitting
Yesterday, the BLS released June data on job openings and labor turnover, also known as the JOLTS report. This alternative view of labor markets is released at a one month lag to the monthly employment situation report which includes the nonfarm payrolls number. In additional to openings, JOLTS also includes a look at quits and other separations from businesses which include retirements, firings, and other departures. Since the data begins in 2000, the average month has seen quits account for about 55% of total separations. Over the last three months, that number has surged to nearly 70% and is sitting at a record level. One thing we can say with great confidence about the current labor market: lots of workers are quitting for greener pastures. Click here to view Bespoke’s premium membership options.
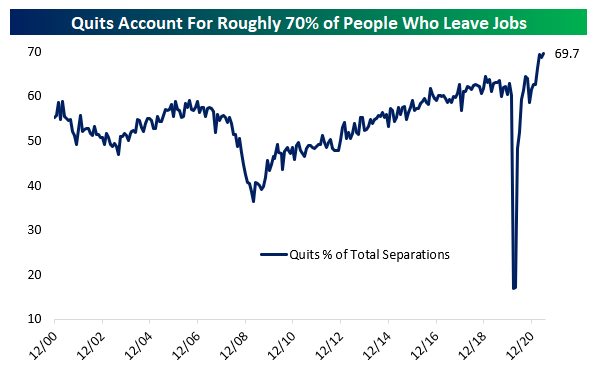
Chart sources: BLS, FRED, Bespoke Investment Group calculations
Google Search Trends
One of the widely talked about pandemic trends has been an increased interest in the stock market. Quantifying this, below we show data from Google Trends. These indices track search interest for various terms where readings of 100 are the peak in interest for a given time frame, a reading of 50 would be when interest was half of that peak, and so on and so forth. Google searches for “Stocks” surged to record highs during last year’s bear market and those highs were taken out earlier this year around the time of the meme stock mania in late January. The same could be said for searches for “Buy Stocks”. Since then, that interest has unwound but current levels are still above most pre-pandemic levels. (Red dots indicate search levels during the week of August 9th over the last five years.)

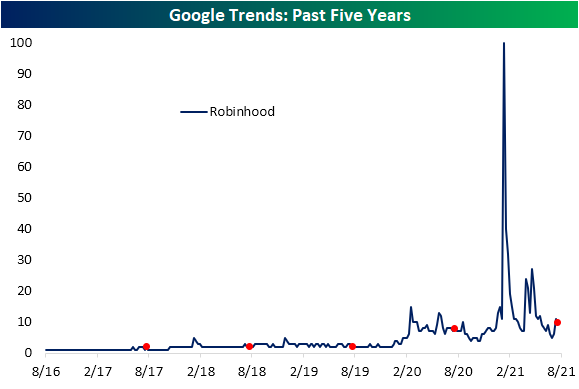
The same could be said for search interest for various brokerages. Taking a look at the most popular, Robinhood, search interest spiked higher during the meme stock mania and GameStop (GME) short squeeze early this year before getting another boost in the spring around the time of the surge in AMC Entertainment (AMC). Interest has moderated since then, though, the past several weeks have seen a boost potentially as a result of the IPO of the company.
Inflation continues to be a macroeconomic subject that is closely watched, but for the time being, people are searching for it far less than earlier this spring. In May, searches for “Inflation” reached the highest point on record, and while they are still elevated, the reading has come down a bit. Searches for “Rising Prices” tell a similar story, though, it peaked earlier in the late winter.

With searches for inflation having surged in the past year, we thought it would be worth looking at search interest for some typical hedges like gold. While these searches also surged to a record recently, it should be taken with a grain of salt, after all, it is an Olympics year. As shown in the second chart below, historically the month in which the Olympics fall usually sees searches for gold spike.

Turning to a more speculative area of the market, below we show searches for crypto-related products. Bitcoin remains well above most other periods of the past five years but it has been declining and is back below the past year’s range. Additionally, the highs from earlier this year were far from ever hitting the same interest as the craze in late 2017/early 2018. On the other hand, “Crypto”, “Coinbase”, and “NFT” search interest has come back down to earth after all reaching records earlier this year. These have also seen minor reversals recently with “NFT” in particular seeing a decent-sized bounce.

While those digital collectibles have seen interest turn around slightly, searches for “Collectibles” more broadly or a more specific term like “Rookie Card” have been drifting lower. Interestingly, searches for these collectibles certainly got a boost during the pandemic, but they actually began to trend higher just prior in late 2019. Click here to view Bespoke’s premium membership options.

How Far & How Fast Do Markets See The Fed Tightening?
With more and more members of the FOMC talking about the need to taper or when they expect rate hikes to occur, it’s worth looking at the baseline assumptions around the pace of hikes that markets currently price. The spreads between different Eurodollar future maturities allow us to show how much markets think rates will change over a given period.
As shown below, current pricing is for less than 1 hike in 2022. Pricing is more aggressive in 2023 with two hikes while years further out are around 1 hike each, with slightly more aggressive pricing in 2024 than 2025. Of course, market pricing is often wrong – in both directions. This is just what’s currently priced, and the numbers aren’t that dramatic: a total of just more than 5 hikes over 4 years. Click here to view Bespoke’s premium membership options.
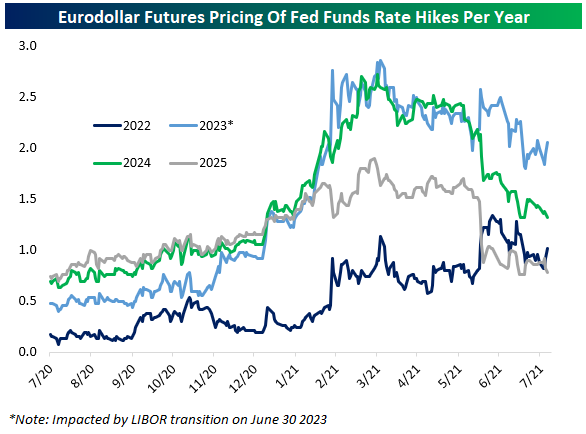
Chart sources: Bloomberg
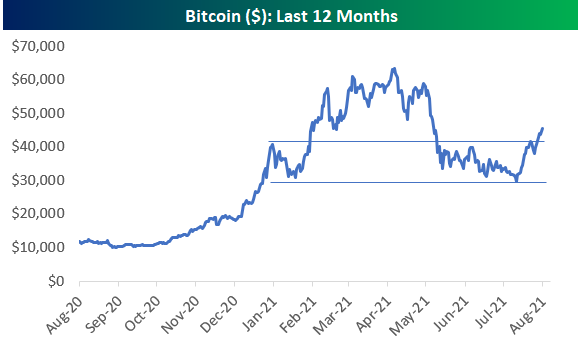
Bitcoin Rallies 58% in Last 20 Days
Bitcoin made a low of $29,307 back on July 20th, which was down 54.8% from its record high made on April 14th. In the 20 days since July 20th, Bitcoin has now rallied 58% to cross back above $46,000. (Remember, a decline of 50% means you need a rally of 100% to get back to prior highs.) As shown below, Bitcoin crossed above a key resistance level in the low $40,000s on its move higher over the last few days, which leaves quite a bit of space between its current level and the next areas of resistance above.
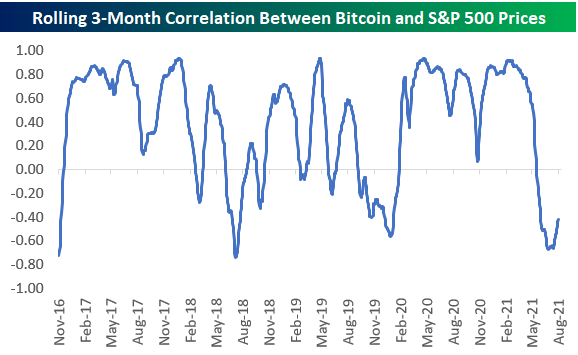
The chart below shows the rolling 3-month correlation between the daily price of Bitcoin and the S&P 500. Just a few weeks ago, this correlation reading got as low as -0.67, although it has been bouncing higher over the last couple of weeks. Click here to view Bespoke’s premium membership options.
Shorted Names Cool Into the Summer
This year has seen two bouts of interest in highly shorted names. The first in January when GameStop (GME) was the main stock in focus with a short interest as a percent of float above 100%, and again in late May/early June when AMC Entertainment (AMC) became the new poster child. As shown below, while those two stocks and a handful of other individual names have seen the spotlight this year due to massive short squeezes, in aggregate short interest as a percentage of free float across the US equity market has pulled back over the past couple of years. Some of that decline was erased from February to April, but since the spring, short interest has flatlined.

Below is a Bloomberg index that tracks the 100 most highly shorted US stocks rebalanced monthly and dating back to February 2020. The index remains well off the highs from this February when it surged on the initial squeeze in GME and various other names. The unwind since then has brought the index down to the longer-term uptrend line that has been in place in the index’s year and a half history.

As for the two stocks that were the main short squeeze names earlier this year, AMC and GME, both stocks are still up huge on the year (1,571.14% and 823.19%, respectively) but have fallen well off their highs and have been trending lower.

Taking a look at what are currently the most heavily shorted stocks in the Russell 3,000, retailers take the top spot with the average stock having a 9.7% short interest as a percent of float. Pharmaceutical, Biotech, and Life Science stocks are the only other industry in which the average stock has a short interest above 9%. Autos in addition to Food & Staples Retailing are the other two sectors with notably elevated short interest. Conversely, Banks, Utilities, Insurance, and Commercial and Professional Services have a relatively low short interest versus the Russell 3,000 average of 5.5%.

Taking a more granular look, in the table below we show the stocks in the Russell 3,000 that currently have the highest short interest as a percent of float as well as their year-to-date performance. Recent IPO Reneo Pharmaceuticals (RPHM) tops the list with just under half of its shares sold short. That is as the stock has gotten crushed since its debut having fallen 40%. GreenBox (GBOX), Skillz (SKLZ), Beam Global (BEEM), and Workhorse Group (WKHS) round out the top five, all with more than 37% of their float sold short.
Looking across many of the other highly shorted names, though, big losses are pretty common on a year-to-date basis with 60% of these names in the red. That was not always the case, though. Performance was slightly better two months ago during the AMC saga and performance was even more positive at the GME high one month into the year. Click here to view Bespoke’s premium membership options.

Bespoke Brunch Reads: 8/8/21
Welcome to Bespoke Brunch Reads — a linkfest of the favorite things we read over the past week. The links are mostly market related, but there are some other interesting subjects covered as well. We hope you enjoy the food for thought as a supplement to the research we provide you during the week.
While you’re here, join Bespoke Premium with a 30-day free trial!
Crypto
What if bitcoin went to zero? (The Economist)
An exploration of a hypothetical decline in bitcoin to $0, with ripple effects not just inside the crypto universe but across the global economy. [Link; registration required]
Tech
Ford slated to spend more on EVs than on internal combustion engine vehicles in 2023 by Jordyn Grzelewski (The Detroit News)
R&D is shifting rapidly away from ICE engines and towards EVs, with the iconic American car and truck brand spending more on electrical vehicle development as soon as 2023. [Link]
Tech Startup Financing Hits Records as Giant Funds Dwarf Venture Capitalists by Heather Somerville (WSJ)
Early rounds of venture funding are no longer the lonely preserve of VCs and angel investors, with other much larger pools of capital that typically stick with more staid investments playing a much larger role in early financing. [Link; paywall]
Apple’s iPhones Will Include New Tools to Flag Child Sexual Abuse by Jack Nicas (NYT)
Changes to iCloud and iMessage will allow Apple to identify illegal child pornographic material (a laudable goal) while also opening up previously ironclad safety and privacy infrastructure to government surveillance. [Link; soft paywall]
A Conspiracy To Kill IE6 (Chris Zacharias)
The story of how a rogue engineering crew inside YouTube destroyed Internet Explorer 6 with a simple banner announcement. [Link]
Poppers
This Man Does Not Make Poppers by David Mack (BuzzFeed)
A series of legal loopholes and decisions to look the other way by regulators have left poppers, a staple of the gay party scene, one of the only party drugs that can be widely purchased. [Link]
COVID
How COVID-19 vaccine supply chains emerged in the midst of a pandemic by Chad P. Bown and Thomas J. Bollyky (PIIE)
A deep investigation into how vaccine production supply chains were developed and scaled, with detailed discussion of government and private sector entities and activity in the process. [Link; 60 page PDF]
Main Street Health July 2021 (Homebase)
With the Delta variant ramping up, employment and open locations have slowed, and there wasn’t any evidence that early halts to unemployment benefits in a range of states had a positive impact on employment at small businesses. [Link; 17 page PDF]
Olympics
When All Else Fails, It’s Time to See the Olympic Body Mechanic by Scott Cacciola (NYT)
US track and field athletes have been turning to one of the best-kept secrets in performance sports, a chiropractor with a very unusual and effective approach to dealing with nagging injuries of all kinds. [Link; soft paywall]
Pricey Travel
Disney Releases Sample 3-Day Itinerary of Star Wars: Galactic Starcruiser Hotel Experience by Shannen Michaelsen (WDWNT)
Two days at the newest and most detailed attraction at Disneyworld are going to run into the thousands of dollars for a family of four, but the action-packed schedule may be well worth it. [Link]
The ‘$27.85 Beer’: High-Flying Prices at Airports Spur Port Authority Concessions Audit Order by Jose Martinez and Aria Velasquez (The City)
Airport vendor prices are famously high, but the gouging underway at LaGuardia and other New York airports is on a truly different level. [Link]
Read Bespoke’s most actionable market research by joining Bespoke Premium today! Get started here.
Have a great weekend!
SPY Snoozefest Coming To An End?
In today’s Morning Lineup, we noted how the major US equity indices have been a bit sleepy with each one having risen less than 1% over the five days ending yesterday. As shown below, that lack of volatility actually extends back to the prior week as well. The S&P 500 (SPY) has generally trended in a sideways range over the past two weeks. That was until today. While yesterday’s move higher brought SPY to the high end of that recent range, the reaction to the strong NFP report is marking a more distinct breakout.

As for just how narrow of a range SPY has traded in, in the charts below we show the distance (in percentage terms) between the intraday high and low over a rolling ten trading day span. While today’s move higher lifted the reading to 1.59%, as of yesterday’s close there was only 1.34% between yesterday’s intraday high and last Tuesday’s intraday low. Going back through the history of SPY, there have only been 146 other days, or just 2% of all days, in which that range was less than 1.5%. In fact, the last time that there was as narrow of a ten-day range as yesterday’s reading was the first trading day of 2018. Click here to view Bespoke’s premium membership options.

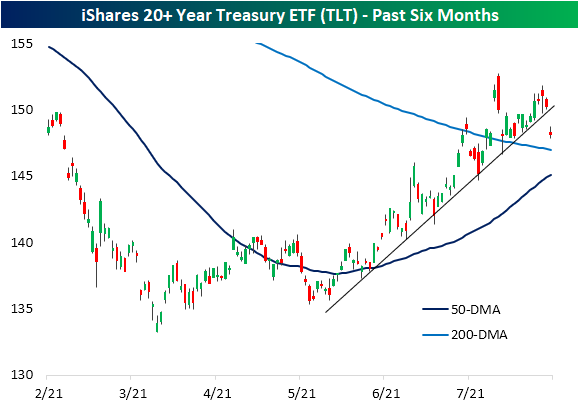
Bonds Break Down
In reaction to today’s better than expected Nonfarm Payrolls report, perhaps one of the most notable moves has been in rates. Whereas the S&P 500 is up a modest 0.15%, the iShares 20+ Year Treasury ETF (TLT) is falling 1.5% as of this writing and is on pace for its biggest single-day decline since June 21st. From a charting perspective, the decline is even more notable. Today’s drop has smashed through the uptrend line that had been in place since the spring. With that line broken, TLT’s 50-DMA is likely to be the next area of support to watch.
As for investment-grade corporate bonds, it is the same story. The iShares Investment Grade Corporate Bond ETF (LQD) is down 0.73% today for its worst day since March 12th when it fell over 1%. As with TLT, that decline has broken the ETF’s uptrend that has been in place for most of the past year, and the next area of potential support is its moving averages. More specifically, LQD is closing in on its 200-DMA which recently crossed above the 50-DMA. Click here to view Bespoke’s premium membership options.

Biggest Jump in Bearish Sentiment Since Last Spring
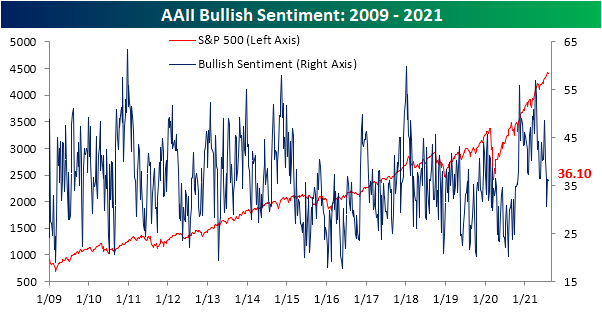
The S&P 500 has been moving sideways around record highs over the past couple of weeks. As such, bullish sentiment from the AAII was relatively flat this week. After a sizeable 5.6 percentage point jump to 36.2% last week, bullish sentiment fell 0.1 percentage points this week. With that reading, bullish sentiment is still 2 percentage points below the historical average of 38%.
Whereas bullish sentiment did not change much, bearish sentiment surged 7.6 percentage points. That was the biggest single-week uptick since June 18th of last year when it rose 9.73 percentage points. At that time though, just under half (47.78%) of respondents reported bearish sentiment compared to only 31.7% today which is only slightly elevated versus the historical average of 30.53%. In fact, the current level of bearish sentiment is now the highest since only February. Put differently, bearish sentiment has been muted recently, and while this week’s increase was large, it does not leave sentiment at any sort of extreme level.
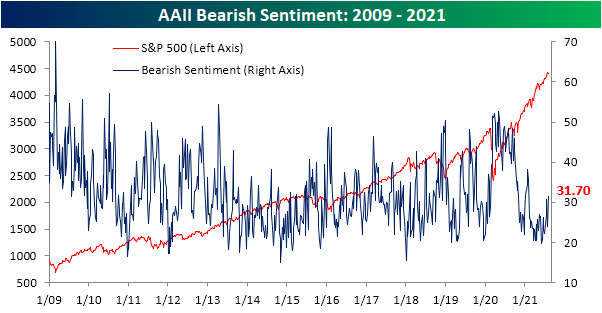
In spite of the large uptick in respondents reporting as bearish, sentiment continues to favor the bulls. The bull-bear spread remains positive at 4.4.

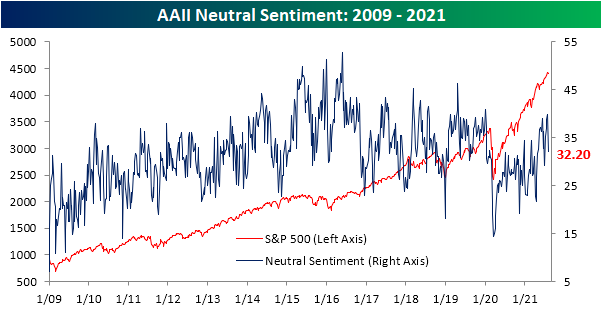
Given bullish sentiment went little changed, the rise in bearish sentiment borrowed almost entirely from those reporting as neutral. Neutral sentiment fell 7.5 percentage points to 32.2%. That is the lowest reading since the first week of July, and it was the largest week-over-week decline since April 8th. This week now marks the first time in three weeks that neutral was not the predominant sentiment reading. Click here to view Bespoke’s premium membership options.
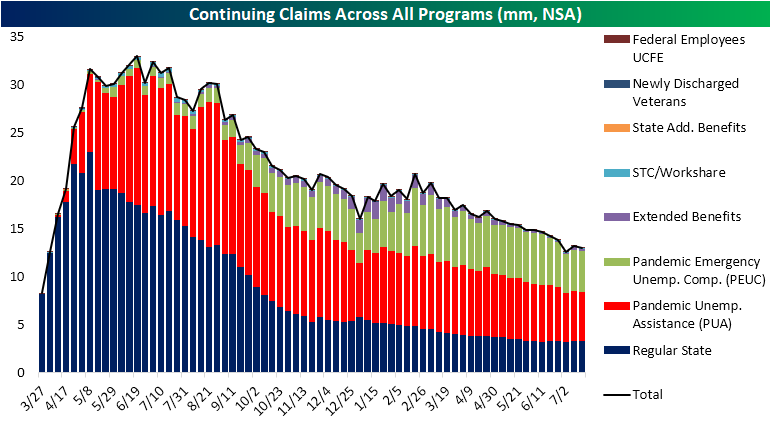
Continuing Claims Below Three Million
This week’s initial jobless claims number did not quite live up to expectations. From last week’s revised level of 399K, claims were expected to fall to 383K. The actual reading was 2K higher, but that still marks the lowest level since the joint pandemic low of 368K from the weeks of July 9th and June 25th.

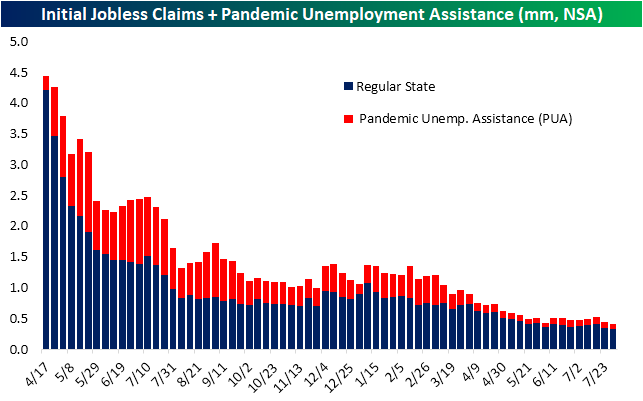
As we have noted over the past few weeks, mid-summer has historically seen a seasonal drift lower in jobless claims. In fact, the current week of the year has seen unadjusted claims fall two-thirds of the time throughout the history of the data. With that in mind, unadjusted claims were likewise lower this week falling to 323.76K from 344.37K last week. Adding in claims from the Pandemic Unemployment Assitance (PUA) program, claims totaled 418.24K. That was a 19K decline week over week and the lowest level of claims of the pandemic. For PUA claims in particular though, there was actually a modest 1.4K increase versus the prior week.
Delayed an additional week, continuing claims saw a more substantial decline dropping 366K versus last week. That was much larger than the 14K decline that had been penciled in by forecasts. Not only was it a large decline versus expectations, but it was the biggest one-week decline in adjusted continuing claims since the week of November 20th when they fell by 562K. That significant decline now leaves national claims below 3 million for the first time since March 2020.

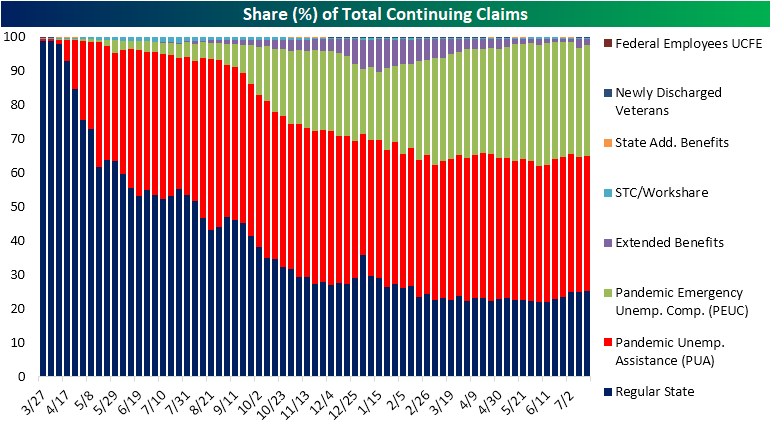
On an unadjusted basis, regular state claims came in at a pandemic low below 3 million for the first time. But adding in all other programs, which creates another week’s lag (most recent data is through the week of July 16th), total claims came in just below 13 million. While lower, that is still above the pandemic low of 12.59 million from two weeks prior. Every program with the exception of the STC/Workshare program is currently above the lows from two weeks ago. The Extended Benefits program is up the most in that time, currently 141.18K above the levels from two weeks ago. Granted, regular state programs, PUA, and PEUC programs account for much larger shares of total claims. Click here to view Bespoke’s premium membership options.