Bespoke Brunch Reads: 7/31/22
Welcome to Bespoke Brunch Reads — a linkfest of the favorite things we read over the past week. The links are mostly market related, but there are some other interesting subjects covered as well. We hope you enjoy the food for thought as a supplement to the research we provide you during the week.
While you’re here, join Bespoke Premium with a 30-day free trial!
Energy Policy
Department of Energy Releases New Notice of Sale as Gasoline Prices Continue to Fall (The White House)
A new Biden administration initiative will start using futures markets in conjunction with the SPR, in an effort to balance the crude market’s term structure as well as the physical market, which can allow for easier market conditions without outright selling crude from the SPR. [Link]
Resource Nationalism and Decarbonization by Miguel Ángel Marmolejo Cervantes , Martín Obaya, Thea Riofrancos, and Alex Yablon (Phenomenal World)
A conversation discussing the prospects of nationalization and national management of decarbonized energy resources in Latin America. [Link]
How London Paid a Record Price to Dodge a Blackout by Javier Blas (Blooomberg)
The UK’s metropole only barely avoided a blackout in mid-July, but to do so it needed to pay 5000% more per hour than is typical. These sorts of shocks to the grid are becoming more and more common as resilience falls. [Link; soft paywall]
Growth Tech
Zuck Turns Up The Heat by Alex Heath & David Pierce (The Verge)
The trials and tribulations of the Meta CEO, struggling to manage a sprawling social media behemoth that is being nibbled at from all sides. [Link]
Changes to Shopify’s team by Tobi Lutke (Shopify)
A frank admission that the explosion in e-commerce activity during the pandemic didn’t continue, and investments made during that period are souring amidst a huge swing back towards normal spending from consumers. [Link]
Politics
Republicans Confront Unexpected Online Money Slowdown by
While political partisans on both sides of the aisle appear motivated, recent GOP grassroots fundraising efforts have dried up at a critical period for advertising spending headed into the midterm elections, in a potential warning sign for the party that has analysts puzzled. [Link; soft paywall]
Investing
The Secret Diary of a ‘Sustainable Investor’ — Part 1 by Tariq Fancy (Medium)
A rejection of the “sustainable” or “ESG” investing movement by one of its founding members, in favor of much bigger and more dramatic interventions in how our society consumes resources. [Link]
Demographics
Study: Millennials didn’t stray far from where they grew up by Mike Schneider (AP)
A new analysis of Census data suggests that narrow economic opportunity sets mean they tend to lead their adult lives close to where they grew up. [Link]
Remembering When Bob Dylan Shocked The World By Going Electric, On This Day In 1965 [Videos] by Rex Thomson (Live For Live Music)
An oral history of the night that folk music legend Bob Dylan decided to take a different tack, switching from his acoustic guitar to an electric one and forever changing how he was viewed as an artist. [Link]
Inflation
Cheaper Beer, Cigarettes Gain Favor as Inflation Pinches Shoppers by Jennifer Maloney and Alex Harring (WSJ)
Lower-priced value brands are seeing strong sales while premium offerings suffer, a response to pinched budgets and incomes that can’t keep up with broad prices. [Link; paywall]
Read Bespoke’s most actionable market research by joining Bespoke Premium today! Get started here.
Have a great weekend!
The Bespoke Report — Equity Market Pros and Cons — Q3 2022
This week’s Bespoke Report is an updated version of our “Pros and Cons” edition for Q3 2022.
With this report, you’re able to get a complete picture of the bull and bear case for US stocks right now. It’s heavy on graphics and light on text, but we let the charts and tables do the talking!
On page two of the report, you’ll see a full list of the pros and cons that we lay out. Slides for each topic are then provided on page three and beyond.
To read this report and access everything else Bespoke’s research platform has to offer, start a two-week trial to Bespoke Premium.


Fed Chair Powell: The Comeback Kid
The S&P 500 has gained more than 1% on each of the last four Fed Days going back to March. The March meeting was the first rate hike of the Fed’s current tightening cycle, and every meeting since then has seen a hike of at least 50 basis points. Each time, the S&P surged on the day of the hike.
The recent equity market strength on Fed Days is a new trend. Market performance on Fed Days during Powell’s first few years at the helm was notoriously weak. Below we show the S&P 500’s average intraday performance on Fed Days by Fed chair since 1994 when policy changes first started being announced on the same day as the meeting. For Chair Powell, we show the S&P’s average performance on Fed Days during his tenure only through July 2021. At the time a year ago, Powell Fed Days were by far the worst of any Fed chair, and the market typically plunged into the close after the 2 PM ET announcement.
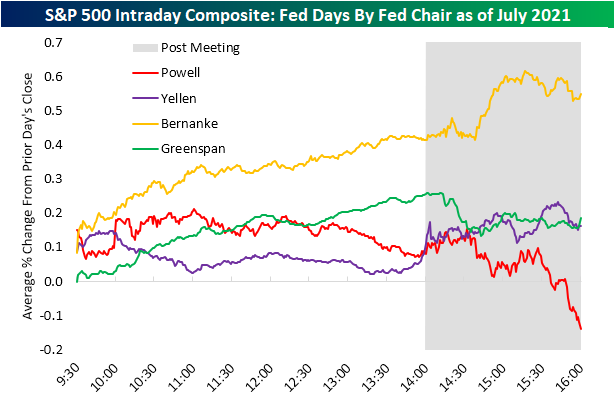
What a difference a year makes. Below we show the S&P’s average intraday performance on Fed Days by Fed chair updated through the most recent FOMC meeting this week. Whereas Powell Fed Days were by far the worst for the market at this time last year, they’re now the second best behind only Bernanke Fed Days.

To highlight the improvement in the market response to Fed Chair Powell another way, below we show the full-day percentage change of the S&P 500 on Fed Days during Powell’s tenure as well as how the cumulative averages have evolved for both the full-day change and performance from 2:30 PM ET through the close (encapsulating the market response to the presser, or the chair more directly).
As you can see, the S&P was extremely weak on Powell Fed Days early on during his tenure, but over the last year, the market has reacted extremely positively. Seven of the last eight Powell Fed Days have seen positive moves for the S&P, with the last four all seeing gains of more than 1%. Click here to learn more about Bespoke’s premium stock market research service.

Bespoke’s Morning Lineup – 7/29/22 – We Made It!
See what’s driving market performance around the world in today’s Morning Lineup. Bespoke’s Morning Lineup is the best way to start your trading day. Read it now by starting a two-week trial to Bespoke Premium. CLICK HERE to learn more and start your trial.
“The time to hesitate is through. No time to wallow in the mire.” – The Doors

Below is a snippet of content from today’s Morning Lineup for Bespoke Premium members. Start a two-week trial to Bespoke Premium now to access the full report.
Stocks are looking to close out a strong week on a positive note this morning as S&P 500 and Nasdaq futures are indicated higher. Earnings have been the driver of the strength, and this morning we’re seeing positive reactions to reports from the likes of Apple and Amazon on the tech/growth side to Chevron and Exxon on the energy side.
We’re pretty much done with earnings for the week, but a number of economic reports are on the calendar. Employment Cost Index, Personal Income, and Personal Spending were all just released, and every one of them exceeded forecasts by 0.1 percentage points. PCE Deflator numbers were also just released and were exceptionally high relative to history but generally in line with or slightly higher than expectations. The initial reaction from the markets has been weakness in equity prices and higher yields in the Treasury market. Outside of these reports, the only others on the calendar are Chicago PMI and Michigan Confidence which will both be released after the opening bell.
Today’s Morning Lineup discusses earnings news out of Europe and the Americas, a detailed look at economic data from around the world, and much more.
With all that’s gone on this week and how lousy a year it has been for the equity market, it’s surprising that the S&P 500 heads into the final trading day of the week with a gain of nearly 3%. The performance of the four mega-cap stocks (Alphabet, Amazon.com, Apple, and Microsoft) this week has been equally as impressive. The table below lists every earnings season since 2015 that all four stocks reported earnings in the same week. Before this week, in each of the eight prior earnings seasons where all four stocks reported in the same week, there was never an earnings season when they all reacted positively the day after their reports, and the S&P 500 was only higher in that week two times.
That trend changed this week. GOOG and MSFT already reported and both rallied more than 5%. AAPL and AMZN, meanwhile, reported after the close Thursday, and both stocks traded higher after hours. Along with the gains in all four stocks, the S&P 500 is already up 2.8% on the week through Thursday’s close and indicated higher in the pre-market. As nervous as bulls were heading into the week with all the major events (earnings, FOMC meeting, Q2 GDP report) on the calendar, as often ends up being in the case with these types of situations, the bark turned out to be a lot worse than the bite.

Start a two-week trial to Bespoke Premium to read today’s full Morning Lineup.
The Bespoke 50 Growth Stocks — 7/28/22
The “Bespoke 50” is a basket of noteworthy growth stocks in the Russell 3,000. To make the list, a stock must have strong earnings growth prospects along with an attractive price chart based on Bespoke’s analysis. The Bespoke 50 is updated weekly on Thursday unless otherwise noted. There were two changes to the list this week.
The Bespoke 50 is available with a Bespoke Premium subscription or a Bespoke Institutional subscription. You can learn more about our subscription offerings at our Membership Options page, or simply start a two-week trial at our sign-up page.

The Bespoke 50 performance chart shown does not represent actual investment results. The Bespoke 50 is updated weekly on Thursday. Performance is based on equally weighting each of the 50 stocks (2% each) and is calculated using each stock’s opening price as of Friday morning each week. Entry prices and exit prices used for stocks that are added or removed from the Bespoke 50 are based on Friday’s opening price. Any potential commissions, brokerage fees, or dividends are not included in the Bespoke 50 performance calculation, but the performance shown is net of a hypothetical annual advisory fee of 0.85%. Performance tracking for the Bespoke 50 and the Russell 3,000 total return index begins on March 5th, 2012 when the Bespoke 50 was first published. Past performance is not a guarantee of future results. The Bespoke 50 is meant to be an idea generator for investors and not a recommendation to buy or sell any specific securities. It is not personalized advice because it in no way takes into account an investor’s individual needs. As always, investors should conduct their own research when buying or selling individual securities. Click here to read our full disclosure on hypothetical performance tracking. Bespoke representatives or wealth management clients may have positions in securities discussed or mentioned in its published content.
Worst Year for Sentiment On Record
Bullish sentiment measured by the weekly AAII survey has been a series of back and forth moves over the past several weeks. After reaching the highest level in over a month last week, bullish sentiment fell back down to 27.7%. Even with that decline, bullish sentiment has now managed to hold above 25% for at least three weeks in a row for the first time since the start of the year. We also must note, that the AAII survey collects data from Thursday at 12:01 AM through Wednesday 11:59 PM meaning any boost to sentiment from yesterday’s FOMC post-meeting rally will not necessarily be fully captured in this report.

Whereas bullish sentiment has had its fair share of back and forth moves, bearish sentiment has more consistently fallen with this week being the third sequential decline in a row. Now at 40%, bearish sentiment is at the lowest level since the first week of June.

Given the drop in bulls was slightly smaller than that of bears this week, the bull-bear spread continued to move in a less negative direction. However, in spite of any improvement, this week was the 17th negative reading in a row as that streak remains the third longest on record.
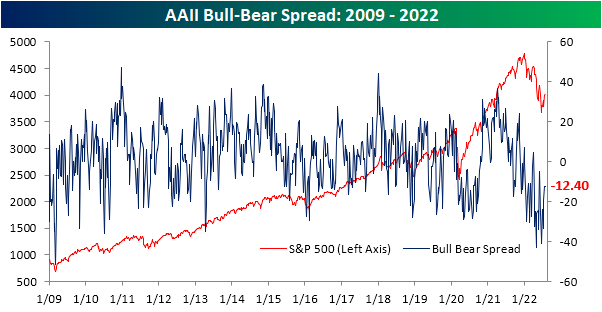

Not only have bears outnumbered bulls for 17 straight weeks, but there has actually only been one week this year (the final week of March) in which that was not the case. As a result, this year is on pace to have averaged the lowest levels of bullish sentiment and the highest levels of bearish sentiment of any year in the survey’s history.

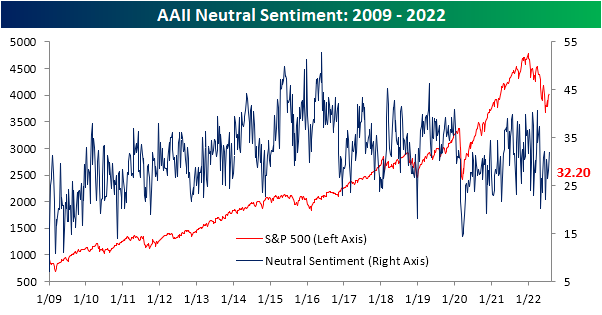
With both bulls and bears lower in the most recent survey, neutral sentiment picked up the difference rising to 32.2%. That is the most elevated reading since April and back into the middle of the post-pandemic range. Click here to learn more about Bespoke’s premium stock market research service.
Big Revision in Claims
Initial jobless claims continue to disappoint. Although this week’s release technically fell down to 256K, it was from a 10K upwardly revised number of 261K last week. Both this week and last’s readings are the highest since the fall and would also mark the highest readings since the fall of 2017 outside of the historically elevated readings of the pandemic.

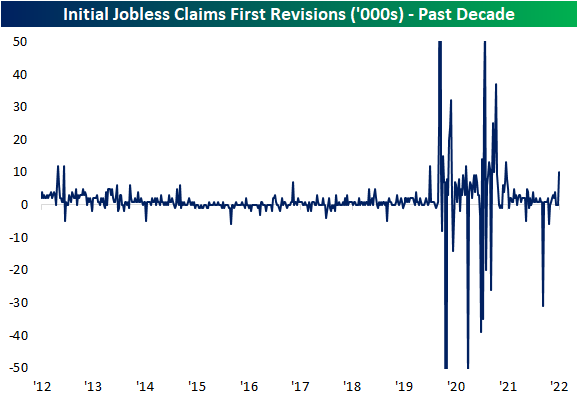
The pandemic was a volatile time period for jobless claims data as readings rose into the millions. As such, revisions over the past couple of years have gotten historically large in turn, albeit less so over the past year. Although it may not sound like much, last week’s 10K revision was actually sizable. It was the largest revision since the week of July 4th last year, and prior to the pandemic, the week before Christmas in 2012 was the last time there was a double-digit revision.
In his post meeting presser, Fed Chair Powell mentioned how the rise in initial jobless claims may be seasonal in nature. While we will provide some more in depth analysis to these comments in regards to the data in tonight’s Closer, as we have noted in the past, jobless claims have been roughly following standard historical seasonal patterns this year. July typically sees a temporary seasonal spike higher, but as we noted last week, that seasonal peak appears to have been put in place a bit later than usual which is rare but not exactly an unprecedented occurrence. While claims will likely get some seasonal tailwinds in the coming weeks (including this week of the year as claims have fallen around 90% of the time historically), the actual level of claims for the current week of the year is now well above comparable weeks for the few years prior to the pandemic. In other words, before or after seasonal adjustment, claims have come off their strongest levels and revisions have not exactly made things any better.

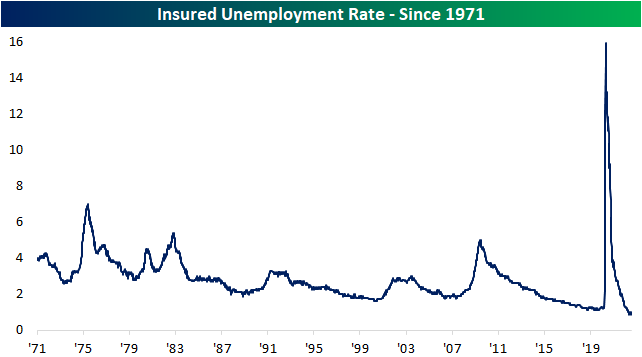
As for continuing claims, the latest week saw a 25K decline to 1.359 million. While that does mark some deterioration from the strongest levels, unlike initial claims, continuing claims are still well below levels from prior to the pandemic indicating a still very healthy labor market the likes of which has not been seen in decades as the insured unemployment rate (continuing claims as a percentage of the number of those covered by state insurance programs) continues to hover near 1%. Click here to learn more about Bespoke’s premium stock market research service.

LIKS Report: 7/28/22
Bespoke’s Little Known Stocks (LIKS) report highlights a company that may not be on the traditional radar of most investors. In this report, we provide an in-depth analysis of the little known stock, including industry insights, growth lever analysis, insights to the competitive landscape, equity performance, relative valuation, operational efficiency, pros & cons, and more. Today’s report is about an innovative software company with exposure to recession-resistant industries.

As always, this report is for informational purposes only and is not a recommendation to buy or sell any specific securities. Investors should do their own research and/or work with a professional when making investment decisions. Highlighting a stock doesn’t mean we are bullish or bearish on it. Our goal is simply to provide readers with facts to help them make informed decisions rather than just opinions.
Bespoke’s LIKS reports are available at the Bespoke Institutional level only. You can sign up for Bespoke Institutional now and receive a 14-day trial to read our LIKS reports. To sign up, choose either the monthly or annual checkout link below:
Bespoke’s Morning Lineup – 7/28/22 – Three Down, Two to Go
See what’s driving market performance around the world in today’s Morning Lineup. Bespoke’s Morning Lineup is the best way to start your trading day. Read it now by starting a two-week trial to Bespoke Premium. CLICK HERE to learn more and start your trial.
“In a world that changing really quickly, the only strategy that is guaranteed to fail is not taking risks.” – Mark Zuckerberg
Below is a snippet of content from today’s Morning Lineup for Bespoke Premium members. Start a two-week trial to Bespoke Premium now to access the full report.
After Fed Chair Powell downplayed the significance of the initial read on quarterly GDP reports and then today’s negative print for Q2 GDP, conspiracy theorists will say yesterday’s comments were made so the Fed could downplay today’s negative print. Whatever. We now have seen two straight quarters of negative GDP, and while that may not meet the ‘official’ definition of a recession, it still doesn’t change the fact that the US economy shrank in the first half. Add to that, initial jobless claims remain right near their post-COVID highs. This morning’s print of 256K was above last week’s print of 250K, but last week’s reading was subsequently revised up to 261K meaning that claims actually fell this week.
Futures have actually rallied a bit since the 8:30 print of GDP and Jobless Claims, but they are still indicating a modestly lower market at the open. The Q2 GDP report was an important report, but who wasn’t expecting a weak print? More important than that report will be earnings reports from Amazon.com (AMZN) and Apple (AAPL) after the bell today.
Today’s Morning Lineup discusses earnings news out of Europe and the Americas, the potential budget deal between Manchin and Senate Democrats, economic data from around the world, and much more.
Even in the current volatile environment, a 4% rally in the Nasdaq is a big move. In the index’s entire history dating back to 1971, there have only been 86 prior occurrences, and yesterday’s rally was the largest one-day gain since early April 2020 just after the COVID crash lows. The chart below shows every 4% rally in the Nasdaq over its history since 1971, and outside of the period from 2000 to 2002, and to a lesser degree the Financial Crisis, moves of this magnitude were sporadic. The most notable aspect of the chart below, however, has to be the fact that in the 50+ year history of the Nasdaq, nearly half of all the index’s rallies of 4%+ occurred in the three-year window from 2000 to 2002.

Given the near majority of all 4%+ rallies in the Nasdaq occurred during the most severe bear market in its history, maybe big moves like yesterday aren’t such a good thing in terms of the Nasdaq’s future direction. In the chart below, we show the index’s forward returns following prior 4%+ rallies as well as 4%+ rallies, like yesterday, that were the first occurrences in at least three months. As shown in the chart, median returns following all 4%+ rallies (light blue bars) are mixed relative to overall average returns since 1971, but when the 4%+ rally is the first in at least three months, forward returns have actually tended to be above the historical average for all periods since 1971. It’s hard to say the coast is now clear following yesterday’s big rally, but historically speaking, big one-day rallies for the Nasdaq after a long absence have historically been followed by above-average returns.

Start a two-week trial to Bespoke Premium to read today’s full Morning Lineup.
Most Countries Remain Below Pre-COVID Highs
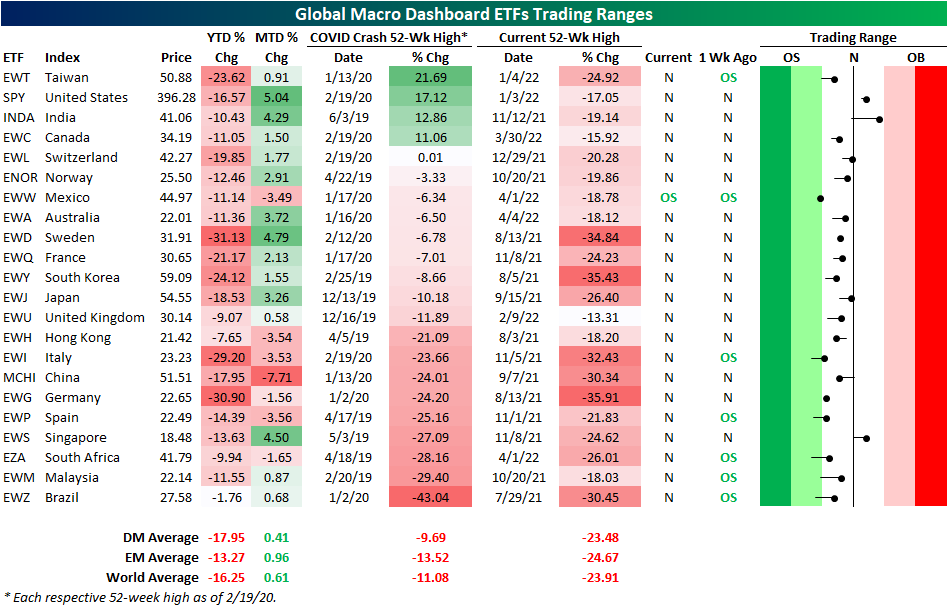
As we do the last Wednesday of each month, today we published our latest update of the Global Macro Dashboard which provides an overview of the major economic data and financial markets of 22 major global economies. Taking a look at the US ETFs tracking these same countries shows a broad move higher in equities around the globe during the month of July. The US has led the way higher as the S&P 500 ETF (SPY) has rallied just over 5%. India (INDA), Sweden (EWD), and Singapore (EWS) have seen the next strongest moves with each one rallying 4% or more. That has brought US equities, India, and Singapore back above their 50-DMAs as well.
Given those moves are in the context of much larger pullbacks year to date, most country ETFs also currently remain below their pre-COVID highs (the 52-week high as of the S&P 500 peak on 2/19/20). In fact, SPY, INDA, Taiwan (EWT), and Canada (EWC) are the only countries meaningfully above prior highs. Switzerland (EWL) is also technically a part of that list, but the one basis point difference is not much of a margin. At the moment, Brazil is down the most significantly from its pre-COVID high as it is still down 43%. However, unlike many other countries, the year-to-date decline has been very modest at only 1.76%.
Taking a look at the charts of the four countries that are handily above their pre-COVID highs, the trends of the past year are not exactly positive. Each one currently sits in a multi-month downtrend, and only India and the US have managed to break above their 50-DMAs. Even if those moving averages have been taken out, further progress by bulls would be required to eliminate those downtrends. Click here to learn more about Bespoke’s premium stock market research service.
