The Bespoke Report – 8/5/22 – The Bear-zatto Market
This week’s Bespoke Report newsletter is now available for members.
One of the surprise TV hits of the summer has been FX’s dark comedy The Bear, set in a struggling Chicago family restaurant beset with chaos, dysfunction, baggage, and drama. The show is an ode to work: the feel of walking into the kitchen on too little sleep, the staccato ring of a sharp knife prepping vegetables, the deep umami smell of a tended sauté pan, the gorgeous sheen of carefully frosted cakes, and the taste of a pile of family meal spaghetti. But it’s also an ode to dysfunction: fights between cousins and siblings, tragic suicides, drug abuse as a coping method, screaming at coworkers and friends, self sabotage and the sabotage of fellow chefs, or violent altercations in the workplace. The US economy and financial markets have been through a period of enormous dysfunction: manic highs in 2021 as policy stimulus and a surge in retail risk taking eventually gave way to a brutal bear market that has covered at least the first half of 2022, while the economy has bounced-back admirably from the COVID shock despite ongoing conflicts over labor supply, supply chain performance, geopolitical shocks to commodity markets, and the presence of the FOMC ever-ready to snuff out the expansion. Like The Bear’s protagonist, Carmine Berzatto, the FOMC has been tasked with keeping a fundamentally unstable situation on an even keel. Instead of struggling to pay vendors, re-organize the staff, optimize the menu, and manage utter chaos on an interpersonal level, the FOMC has had to balance strong growth in aggregate demand, high inflation, a large balance sheet, and supply-side disruptions. In The Bear, Carmine’s journey is both helped and hindered by his new hire Sydney, a woman hired to help manage the kitchen and re-orient strategy. In 2022, Sydney is playing the role of a Congress that has both helped ward off the worst outcomes (economic collapse) but hasn’t moved as fast or been as nimble as the protagonist ultimately needs. Despite being on its own learning curve, this week, Congress passed a taxation and spending bill that will boost investment in decarbonized energy, following passage last week of a bill that will generate significant semiconductors capex. The deeply divided Congress isn’t always working in perfect sync with the Fed, but the chaotic relationship ultimately does more harm than good for both. Ultimately, the FOMC is just as human in its foibles as Carmine Berzatto in The Bear: the central dramatic suspense of the show (whether Berzatto will close the restaurant…no spoilers from us!) is equally present in the question of whether the FOMC will halt what could be an unprecedented inflationary boom in favor of ‘closing the joint down’. Only time will tell, with investors left to guess just as viewers were whether the enigmatic protagonist will persevere or take the easy route out with predictable—if dysfunctional—results. We discuss all of the aspects of The “Bear-zatto” market and much more in this week’s Bespoke Report.
To read this week’s full Bespoke Report newsletter and access everything else Bespoke’s research platform has to offer, start a two-week trial to one of our three membership levels.


Crazy Moves in the Bond Market
The iShares 20+ Year Treasury Bond ETF (TLT) declined over 2% on Friday, which for a sector of the financial universe that is known for its safety, is a relatively rare occurrence. Since the ETF’s launch in 2002, only 3.1% of all trading days have been gains or losses of at least 2%. Not only was Friday a big move for TLT, but it was also the third day this week that the ETF was up or down 2% on the trading day. Talk about an uncertain environment! With investors looking to forecast the path and intensity of rate hikes against a backdrop of high inflation, stronger than expected economic data (like Friday’s Payroll report) puts upward pressure on yields, while weaker than expected data suggests the economy is cooling off causing bonds to rally and yields to fall.
As mentioned above, three of the last five trading days have seen daily moves of plus or minus 2%. Only two other periods throughout the history of TLT have seen a higher rate of 2%+ moves in TLT, those being August of 2011 and March of 2020. Click here to learn more about Bespoke’s premium stock market research service.

Since TLT was launched in 2002, there have only been 22 trading days in which the ETF had moved 2%+ three times over a trailing five-day period. Those occurrences are shown on the chart below and they are clustered around three different periods – the Financial Crisis, the US debt downgrade in 2011, and the COVID crash. Needless to say, these were all very tumultuous periods in the markets and economy.

Interestingly, there have been seven years since 2002 in which TLT has had less 2%+ percent daily moves than we have had in the last five days! For the entire year, this week’s three occurrences take the total number of 2% daily moves for TLT to 17. There are still five months left in 2022, but if there wasn’t another day with a gain or loss of 2%, this year would still rank fourth in terms of total 2%+ moves. Not only that, but if this year’s pace were to continue, it would put 2022 on track for a record twenty-nine 2% moves, surpassing the prior record of 22 from 2011.

Bad Models
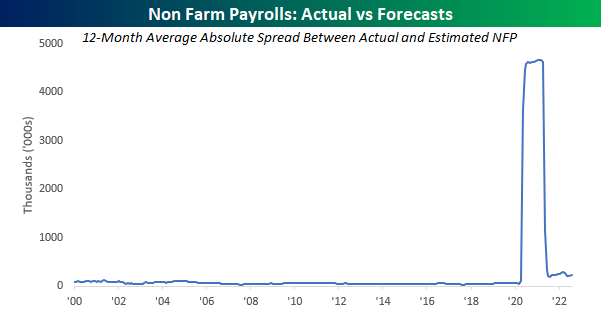
Earlier this week, the quote of the day in our Morning Lineup came from John Galbraith who once said, “Economics is extremely useful as a form of employment for economists.” Just like the broader labor market these days, it’s getting harder to find quality work in the economics profession. Friday’s release of the Non-Farm Payrolls (NFP) report for the month of July showed that the US economy created more than twice as many jobs as economists collectively forecasted (528K vs 250K), and by the individual estimates we saw, not even a single economist was even in the ballpark. While month-to-month anomalies can always pop up due to a variety of issues, ever since the COVID shock, the monthly trend in the actual versus forecasted change in NFP has been increasingly off target.
The chart below shows the 12-month moving absolute average spread between the actual monthly reported change in NFP versus the consensus forecasts. Obviously, this chart isn’t very helpful. The distortions created by COVID were unlike anything ever seen, and you can’t fault economists for not having a handle on things during that period. Nobody did. With the spread seeing a significant decline since then, have economists gotten back on track? Click here to learn more about Bespoke’s premium stock market research service.
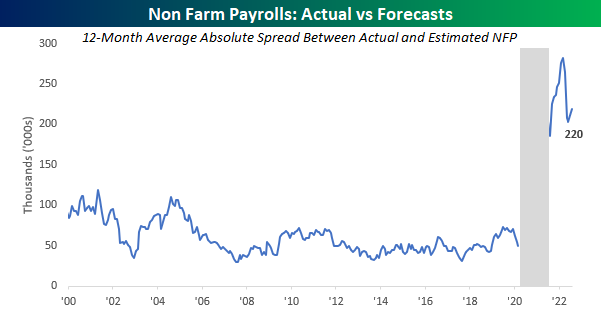
Not at all. In the chart below, we stripped out the period where the 12-month average captures the period during the pandemic when the labor market was in chaos. Specifically, we took out the fifteen months from April 2020 through June 2021 as they include all or part of the four-month period from April through July 2020 when the NFP report was all over the map. Looking at it this way, the average spread between actual and reported Non-Farm Payrolls is now more than twice what it was in the pre-COVID period. In the months before COVID, the average actual reported change in NFP was routinely within 75K of the consensus forecast. In fact, from August 2005 through March 2020, the 12-month average never once topped 75K. In the post-COVID period, however, the 12-month average has been above 200K in 13 of the last 14 months. Forecasting the economy is no easy feat, but more than 2.5 years after COVID first reached US shores, economists still can’t seem to adjust to the realities of the current economic climate.
Bespoke’s Consumer Pulse Report — August 2022
Bespoke’s Morning Lineup – 8/5/22 – Big Jobs
See what’s driving market performance around the world in today’s Morning Lineup. Bespoke’s Morning Lineup is the best way to start your trading day. Read it now by starting a two-week trial to Bespoke Premium. CLICK HERE to learn more and start your trial.
“When you invest, you are buying a day that you don’t have to work.” – Aya Laraya

Below is a snippet of content from today’s Morning Lineup for Bespoke Premium members. Start a two-week trial to Bespoke Premium now to access the full report.
It’s another jobs day. Inflation has become the biggest issue facing the markets lately, so jobs reports aren’t quite as important as they once were, but today’s report will still have implications concerning FOMC policy. Headline jobs came in much better than expected, the Unemployment Rate was lower than expected, average hourly earnings were better than expected, and average weekly hours came in higher than expected. More jobs, longer hours, and more pay. The immediate response in the market was for futures to pull back sharply and interest rates to spike higher.
Today’s Morning Lineup discusses earnings and market news out of Europe and the Americas, the now likely to pass reconciliation bill in the Senate, and much more.
It may sound hard to believe given the year it has been for stocks, but this week the S&P 500 closed further above its 50-day moving average (DMA) than at any other point since April 2021! The chart below shows the spread (in percentage terms) between the S&P 500’s price and the 50-day moving average over the last two years. After spending a number of months below the 50-DMA, the S&P 500 crossed above it in late July and made a bee-line for the 5% threshold this week. Between now and April 2021, there were two other periods where the spread approached 5%. The first was in November 2021 when the S&P 500 came up just short of 5%, and then back in late March when the spread briefly topped 5%. Back in the November period, the S&P 500 actually went on to make new highs even as the internals of the market were already deteriorating. Back in late March, though, right when the spread topped 5%, the rally ran out of gas.

Start a two-week trial to Bespoke Premium to read today’s full Morning Lineup.
The Bespoke 50 Growth Stocks — 8/4/22
The “Bespoke 50” is a basket of noteworthy growth stocks in the Russell 3,000. To make the list, a stock must have strong earnings growth prospects along with an attractive price chart based on Bespoke’s analysis. The Bespoke 50 is updated weekly on Thursday unless otherwise noted. There were seven changes to the list this week.
The Bespoke 50 is available with a Bespoke Premium subscription or a Bespoke Institutional subscription. You can learn more about our subscription offerings at our Membership Options page, or simply start a two-week trial at our sign-up page.

The Bespoke 50 performance chart shown does not represent actual investment results. The Bespoke 50 is updated weekly on Thursday. Performance is based on equally weighting each of the 50 stocks (2% each) and is calculated using each stock’s opening price as of Friday morning each week. Entry prices and exit prices used for stocks that are added or removed from the Bespoke 50 are based on Friday’s opening price. Any potential commissions, brokerage fees, or dividends are not included in the Bespoke 50 performance calculation, but the performance shown is net of a hypothetical annual advisory fee of 0.85%. Performance tracking for the Bespoke 50 and the Russell 3,000 total return index begins on March 5th, 2012 when the Bespoke 50 was first published. Past performance is not a guarantee of future results. The Bespoke 50 is meant to be an idea generator for investors and not a recommendation to buy or sell any specific securities. It is not personalized advice because it in no way takes into account an investor’s individual needs. As always, investors should conduct their own research when buying or selling individual securities. Click here to read our full disclosure on hypothetical performance tracking. Bespoke representatives or wealth management clients may have positions in securities discussed or mentioned in its published content.
Viva Brazil? It Depends on the Currency
Equities in Brazil traded higher again today with the country’s benchmark Ibovespa index rallying over 2% and capping off a 15-day 11% rally where the index has only traded lower three times. Today’s rally also raised eyebrows among technicians as the Ibovespa, like a number of major US indices has broken its downtrend relative to the highs earlier this year. From a technical perspective, what’s not to like about Brazil?

One item may be the currency. Brazilian equities have broken their downtrend from the late March high, but from the perspective of a US investor, the weaker real means that the gains aren’t quite as impressive as they are down in Sao Paulo. After adjusting performance to account for the moves in currency markets, Brazilian equities have still rallied, but after today’s rally, they are only just now beginning to test the downtrend from spring highs. Don’t toast that Caipirinha just yet. Click here to learn more about Bespoke’s premium stock market research service.

Bulls Back Above 30%
While the rally has paused today, the S&P 500 has continued to press higher in the past week and is currently hovering near resistance at the late May/early June highs. In response to those moves, investor sentiment has improved with the weekly survey from the AAII showing over 30% of respondents reporting as bullish. That is the highest reading since the first week of June when the S&P 500 was at similar levels to now.

Bearish sentiment is a similar story in hitting the lowest level since the first week of June as it has fallen back below 40%. The further 1.2 percentage point drop marks the fourth week in a row that bearish sentiment has fallen, and the full decline since the recent high of 59.3% on June 23rd now sits at over 20 percentage points.

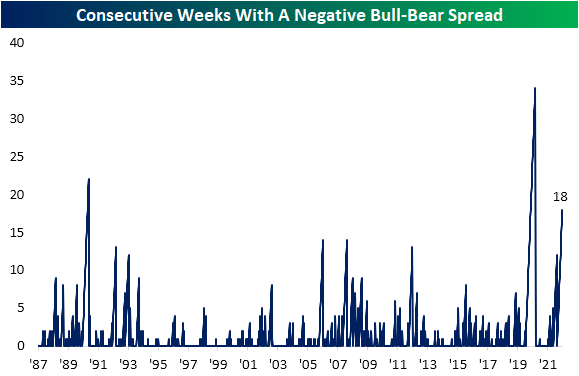
In spite of those further improvements, there continues to be more bears than bulls as the spread remains in negative territory. As shown in the second chart below, the bull bear spread has now been negative for 18 weeks in a row.

In addition to the drop in bearish sentiment, neutral sentiment was also lower falling 1.6 percentage points down to 30.6%. That is the first time neutral sentiment matched bullish sentiment since May of last year. Click here to learn more about Bespoke’s premium stock market research service.

Initial Claims Back to the Highs
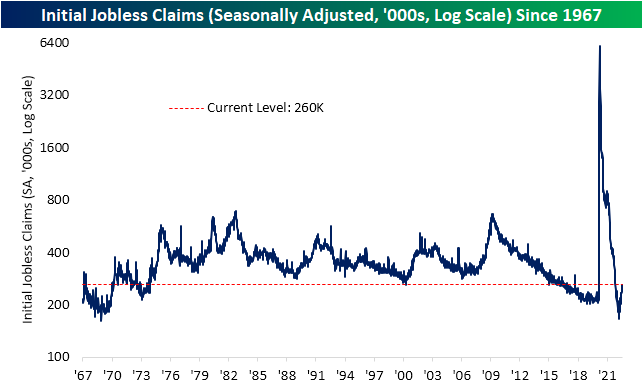
Initial jobless claims came in matching expectations at 260K this week, up from last week’s downward revision of 254K. That reading leaves claims 1K below the pandemic high set two weeks ago. Those levels are above the pre-pandemic range and consistent with where claims stood in the fall of 2017.
On a non-seasonally adjusted basis, claims have the benefit of seasonal tailwinds at this point of the year as the mid-summer peak works itself out. Given this, unadjusted claims have dropped to 205.6K from the high of 258.9K two weeks ago. Although that is a strong level of claims, it is above the readings from the comparable week of the year in 2018 and 2019.

Continuing claims are lagged an additional week to the initial claims number meaning the most recent reading is as of the week of July 22nd. Although initial claims had fallen that week, continuing claims moved back above 1.4 million for the first time since mid-April. Unlike initial claims, and as we will discuss further in tonight’s Closer, the deterioration in continuing claims has been relatively modest as current levels are not only well below levels from the two years pre-pandemic, but this week’s reading would still make for some of the best readings since 1970. Click here to learn more about Bespoke’s premium stock market research service.

Bespoke’s Morning Lineup – 8/4/22 – Fading into the Open
See what’s driving market performance around the world in today’s Morning Lineup. Bespoke’s Morning Lineup is the best way to start your trading day. Read it now by starting a two-week trial to Bespoke Premium. CLICK HERE to learn more and start your trial.
“Far and away the best prize that life offers is the chance to work hard at work worth doing.” – Theodore Roosevelt
Below is a snippet of content from today’s Morning Lineup for Bespoke Premium members. Start a two-week trial to Bespoke Premium now to access the full report.
Futures were higher earlier but have given up much of their gains as we head into the open. Initial Jobless Claims were just released and came in at 260K which is just 1K shy of a post-COVID high. Continuing Jobless Claims saw a larger increase hitting the highest levels since April. In the UK, the BoE raised rates by 50 bps which was the largest hike since 1995. What’s ironic about the move is that at the same time the central bank raised rates by the most in more than 25 years, it also warned of a long recession.
Today’s Morning Lineup discusses earnings and market news out of Europe and the Americas, rate hikes in Brazil and the UK, a look at LNG markets on news of a sooner-than-expected restart at the Freeport terminal, and much more.
Yesterday was the 58th time in 2022 that the Nasdaq experienced a one-day rally or decline of 2% or more, and it is only August 4th! To put that in perspective, we’re just under 150 trading days into the year, so at the current pace, we’re seeing an average of about two 2%+ daily moves per week! How does that stack up relative to history? Going back to 1971, even if there aren’t any more 2% moves for the rest of the year, 2022 would rank as the 6th highest number of 2% days in a calendar year in the Nasdaq’s history. That’s just four less than the total for 1999, 25 behind the total for 2008, but well more than 40 below the triple-digit totals seen in 2000, 2001, and 2002. The record for the greatest number of 2% days in a calendar year came in 2000 when the 2% threshold was crossed 134 times or more than once every other day.

2022 already ranks as the sixth highest number of 2% days in a calendar year in the Nasdaq’s history, but when we compare the number of 2% days this year through the end of July to the first seven months of all other years, it ranks as the third most. As shown in the chart below, the only two years that had more 2% daily moves YTD through 7/31 than 2022 (57) were 2000 (84) and 2001 (74). Other years that were close were 2002 (54) and 2009 (51).

Start a two-week trial to Bespoke Premium to read today’s full Morning Lineup.