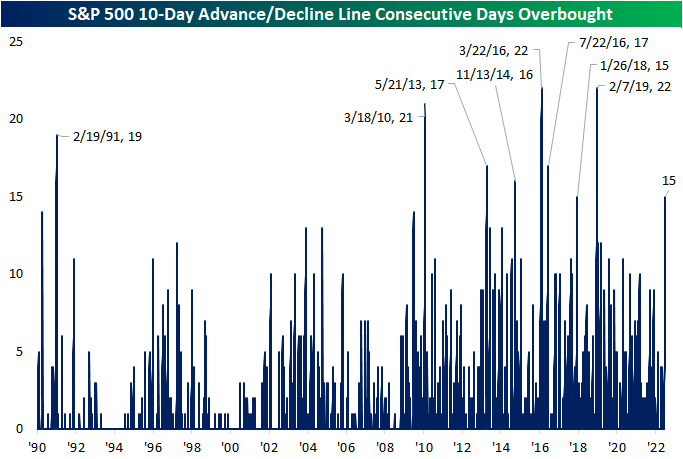
10-Day A/D Line Overbought for 15 Days
In an earlier tweet, we pointed out the elevated readings across 10-day advance decline lines in our Sector Snapshot. Not only is the 10-Day A/D line for the S&P 500 approaching one-year highs (as of yesterday’s close), but it has been “overbought” for the last 15 trading days.

Going back to the start of our data in 1990, there have only been eight other times in which the S&P 500’s 10-day A/D line has been overbought for 15 days in a row or more. The last time such a steak was observed was at the start of 2019 which ended at 22 days. That tied for the March 2016 streak for the longest on record back to 1990. We would also note that other than one streak in the first couple of months of 1991, nearly all of these long streaks with an overbought 10-day A/D line occurred since 2010. In other words, consistently impressive breadth by this measure has largely been a recent phenomenon.
This is not the only impressive breadth signal we have covered of late. For example, in yesterday’s Chart of the Day we highlighted that more than 90% of S&P 500 stocks were above their 50-DMAs. Prior times when we’ve seen that reading spike above 90% have been followed by strong returns in the months and year ahead. Looking at the past times in which the 10-day advance decline line has been overbought for 15 days in a row, forward performance of the S&P 500 has not been considerably stronger than the norm. From that 15th day, the S&P has risen half the time one week out. One and three month returns are more consistently positive but weaker than the norm on a median basis. In the year after the long overbought A/D streaks listed below, though, the S&P was higher 7 of 8 times for an average gain of 11.1%.

Below is a chart of the S&P 500 since its 2009 Financial Crisis low. As shown, most of these overbought A/D line streaks have occurred as the index was recovering from some sort of sell off. Only one of them (in early 2018) came about at the time of a notable peak in the index. Click here to learn more about Bespoke’s premium stock market research service.

Moving Averages Putting Up a Fight
Just as the S&P 500 ran into some resistance yesterday at its 200-day moving average (DMA), we’ve seen the same pattern play out in a number of commodities. Two of the more high-profile ones have been copper and crude oil.
Copper fell out of bed in the late spring and early summer, losing a third of its value. Along with the equity market, copper has seen a late-summer rally, but things came to a screeching halt right at the 50-DMA last Thursday. Copper has been down on two of the last three trading days and hasn’t been able to trade back above that elusive 50-DMA since. Click here to start a two-week trial to Bespoke Premium and receive our paid content in real-time.

Crude oil has been just as weak as copper lately, trading in a well-defined downtrend and breaking below its 200-DMA in early August. There was a little bit of a bounce last week, but resistance came into play at the 200-DMA, and after making another lower high, it has since made another lower low.
When stock, commodity, bond, or any other asset class is in a well-defined downtrend, the first thing they have to do to break out of their funks is clear resistance at key moving averages like the 50 and/or 200-DMA. In the case of copper and crude, they have both recently come up short. The S&P 500, again, is facing some resistance at its 200-DMA, but at least it has managed to clear its 50-DMA which it did in the second half of July.

Bespoke’s Morning Lineup – 8/17/22 – Not Much of a Second Effort
See what’s driving market performance around the world in today’s Morning Lineup. Bespoke’s Morning Lineup is the best way to start your trading day. Read it now by starting a two-week trial to Bespoke Premium. CLICK HERE to learn more and start your trial.
“What started as a temporary measure driven by the pandemic is now our new standard.” – Brian Cornell

Below is a snippet of content from today’s Morning Lineup for Bespoke Premium members. Start a two-week trial to Bespoke Premium now to access the full report.
After Walmart (WMT) capped off the strongest earnings season for US stocks in years, a bit of a hangover appears to have set in for investors this morning. Futures were only modestly negative in the middle of the night, but there has been a steady drift lower throughout the early morning hours to the point where S&P 500 futures have traded down over 75 basis points as we type this. Looking for a culprit, earnings don’t fit as a narrative. The most high-profile report this morning has been Target (TGT) which reported weaker-than-expected results, but the stock is only trading down 2%. Hardly enough to warrant a decline of this magnitude. Trading in Europe may be to blame as major benchmarks in the region are down following a higher-than-expected inflation report in the UK that pushed the y/y rate above 10%. With the FOMC Minutes on tap, maybe investors are fearing some hawkish text in the minutes.
Whatever the cause, after yesterday’s rally screeched to a halt just shy of the 200-day moving average (DMA), the bulls’ second effort looks pretty weak at this point. We’ll see if Retail Sales either add to the misery or put a pep in the market’s step.
Today’s Morning Lineup discusses earnings and market news from Europe and the Americas, overnight economic data, and much more.
Walmart’s (WMT) earnings report after the close yesterday marked what we generally consider to be the unofficial end to earnings season. If you’re a bull, you’re probably sad to see this one come to an end. Through yesterday’s close, the S&P 500 was up over 10% since earnings season began July 8th, and that represents the best earnings season performance for the index since the Q2 reporting period in 2009! Since the start of 2009, the just-completed earnings season also marks the 13th time that the S&P 500 has rallied 5% or more during an earnings season (six weeks from the Friday before the first big banks report numbers).
With strong performance during the reporting period, the natural question for investors is whether the gains we have seen have been borrowed from the future. Looking back at prior strong earnings seasons, that doesn’t appear to be the case. In the 12 prior reporting periods, the S&P 500’s median change from the end of earnings season through quarter-end was a gain of 2.38% with positive returns 75% of the time. That’s actually modestly better than the median gain of 1.75% and positive returns 73% of the time for the remainder of all other quarters.
Instead of borrowing from future gains this earnings season, maybe the S&P 500 was just collecting on its ‘loan’ during the June swoon?

Start a two-week trial to Bespoke Premium to read today’s full Morning Lineup.
Biggest Gainers Since 6/16 Low
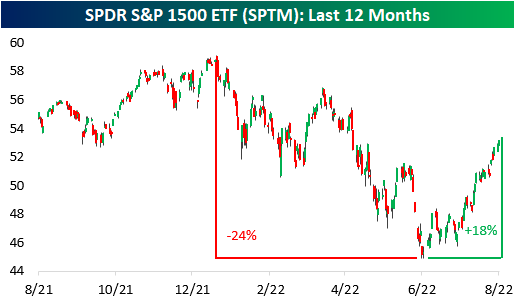
Today marks two months since the mid-June low. At the time, the S&P 1500 had declined 23.5% relative to the January 3rd high. Since then, the index has recovered substantially, gaining 17.7% off of the low. Although the S&P 1500 is still 10.0% off of its closing high, these gains have been well received by investors as the market has shown resilience in the face of rampant inflation, worsening housing data, rate hikes, supply chain constraints, and increased labor costs. This rally comes as oil prices pull back, CPI came in lower than estimated for the month of July, and earnings come in better than expected. The graph below shows the price moves in the SPDR S&P 1500 ETF (SPTM) over the last twelve months. Click here to start a two-week trial to Bespoke Premium and receive our paid content in real-time.
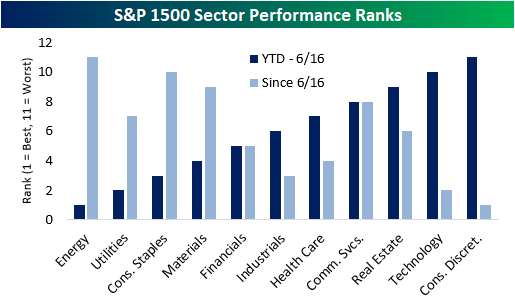
Since the June low, there has been a reversal in performance trends, as the laggards have tended to lead the way higher (on a percentage basis) while the former leaders have generally lagged. Between the start of the year and the 6/16 low, Energy and Utilities were the best performing sectors, while Technology and Consumer Discretionary were the worst. Since then, we have seen the inverse as Technology and Consumer Discretionary have been the top-performing sectors while Energy has been the worst.
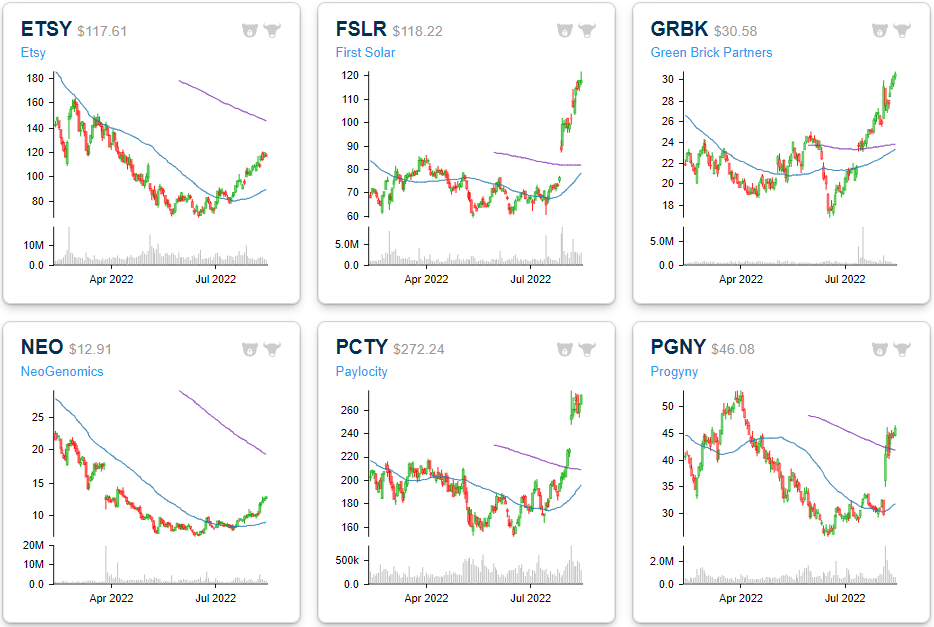
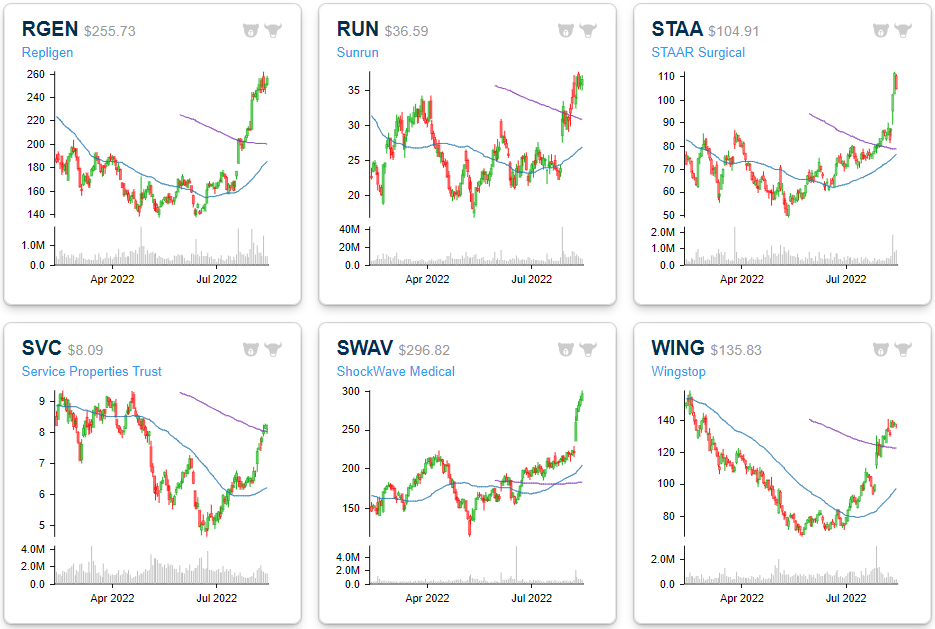
The chart below shows the 25 best-performing S&P 1500 stocks since the 6/16 low. As you can see, these stocks generally underperformed the broader index until the low, trading down by an average of 46.9%. However, since the lows, they are up an average of 90.4%, led by the newest meme stock: Bed Bath & Beyond (BBBY). Due to the drawdowns through 6/16, these stocks are still down YTD on a median basis (and even on an average basis), but they are an average of 47.6% above their 50-DMAs and 22.3% above their 200-DMAs. They’ve come a long way, and shown in the charts below, many have reached some extremely stretched levels, but even after the rallies, they still have a ways to go before coming out of the darkness. Click here to start a two-week trial to Bespoke Premium and receive our paid content in real-time.
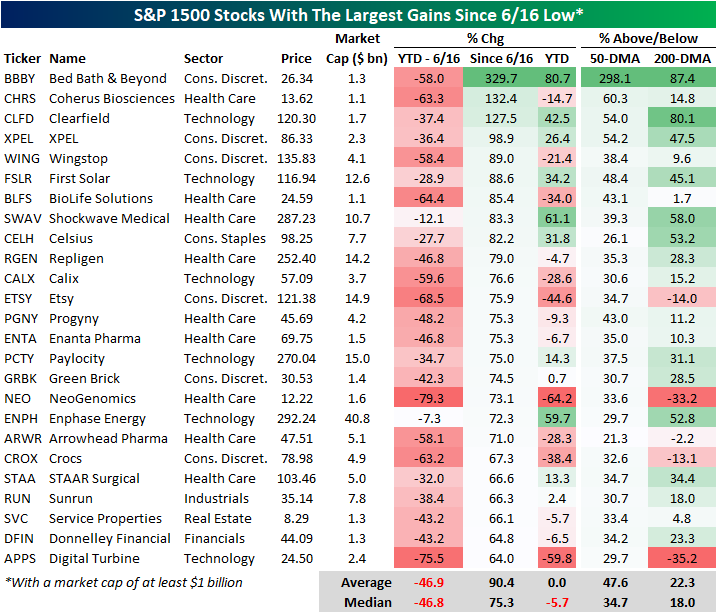
Six-month price charts for each of these stocks are included below. You can track a custom portfolio of these names by clicking here.


Housing Descending
Updates on Building Permits and Housing Starts were mixed relative to expectations for July. While Building Permits exceeded forecasts by 34K, Housing Starts missed forecasts by 81K falling to the lowest annualized rate (1.446 million) since February 2021. Housing represents a large share of the US economy on both a direct and indirect basis, so its health says about the state of the overall economy, Below we have updated our chart of Housing Starts on an average 12-month basis overlaid on top of recessions. Every recession since the late 1960s has been preceded by a rollover in the average rate of Housing Starts, and usually, the rollover starts well in advance of the recession.
For the current period, Housing Starts remain right near their highest levels of the cycle, but if you look real closely, you can see that the level peaked three months ago. Looking out over history, there are plenty of other periods where Starts declined for a few months but didn’t roll over. In other words, based on what we’ve seen so far, Housing Starts have yet to show signals of an imminent recession. Based on this month’s reading and the readings from a year ago, barring a major rebound, the 12-month average is likely to keep declining in the months ahead. Another factor to keep in mind about the historical relationship between Housing Starts and recessions is that in most cases, the recession didn’t usually begin until months after the peak of Housing Starts. Click here to start a two-week trial to Bespoke Premium and receive our paid content in real-time.

Taking a closer look at recent trends, the chart below shows the 12-month average of Building Permits and Housing Starts since the start of 2010. It’s easier here to see the decline in Starts over the last few months. Building Permits, meanwhile, have continued to trend higher.
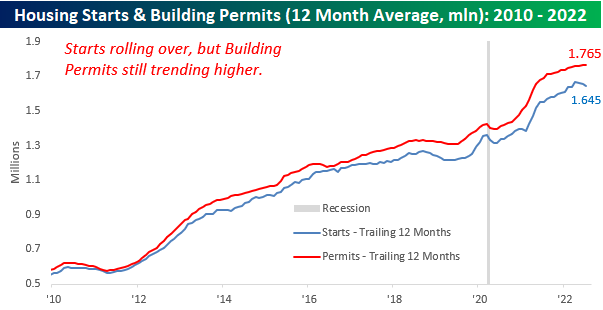
On a single-family basis, though, both Building Permits and Housing Starts have shown signs of rolling over. Single-family Housing Starts have been moving sideways for over a year now and have just recently seen an acceleration in the rate of decline while Building Permits have been trending lower for a full year now.

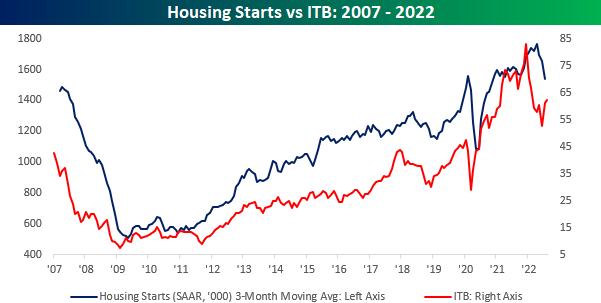
Finally, the chart below compares the performance of Housing Starts over time to the performance of homebuilder stocks using the iShares US Home Construction ETF (ITB) as a proxy. While the two have tended to track each other over time, over the last couple of months, ITB has rallied while Housing Starts have been dropping. Either the market knows something about future developments in the residential housing market or investors have gotten a little offside in their positioning.
Bespoke’s Morning Lineup – 8/16/22 – Checking in on the Home
See what’s driving market performance around the world in today’s Morning Lineup. Bespoke’s Morning Lineup is the best way to start your trading day. Read it now by starting a two-week trial to Bespoke Premium. CLICK HERE to learn more and start your trial.
“You should always go to other people’s funerals, or they won’t go to yours.” – George Herman Ruth
Below is a snippet of content from today’s Morning Lineup for Bespoke Premium members. Start a two-week trial to Bespoke Premium now to access the full report.
Investors generally expected a weak tone out of this morning’s updates to Building Permits and Housing Starts, and weak homebuilder sentiment provides a clue as to why. Yesterday’s update on homebuilder sentiment from the NAHB for the month of August showed that the US residential housing market is rapidly cooling off. Take the last four months, for example. In three of these four, the headline sentiment reading from the NAHB has missed expectations by at least five points. Historically, the reported reading in this index tends to come in by +/- two points relative to expectations, so misses of five or more aren’t very common. Put another way, before this May there were only ten other months since early 2003 where the headline reading missed expectations by five or more points.

Besides the fact that the last four months have been so weak relative to expectations, it has also now been nine months and running that the headline homebuilder sentiment report has been either in line with or lower than expectations. The last time Homebuilder sentiment was better than expected was back in November! The current streak without a better-than-expected reading now ranks as the second longest since at least 2003. The only streak that was longer came during the early stages of the housing crash in August 2006.

Start a two-week trial to Bespoke Premium to read today’s full Morning Lineup.
Homebuilder Sentiment Tanks… Again
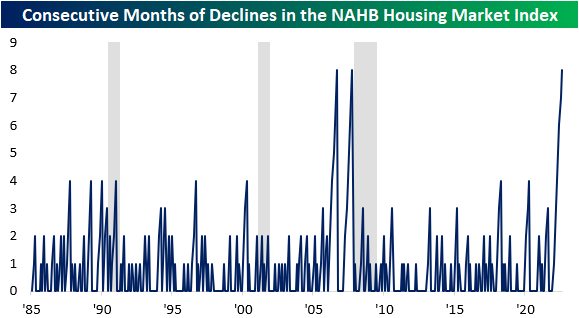
As mortgage rates remain elevated relative to 2021 levels but housing supply remains thin, NAHB’s Housing Market Index fell again this month, reaching the lowest level since May of 2020. Last month, the index posted its second largest month over month decline, and following this report, the index has fallen by 18 points over the last two months, the third largest two month decline on record, falling just short of April and May of 2020. Click here to start a two-week trial to Bespoke Premium and receive our paid content in real-time.

The NAHB Housing Market Index has now declined for eight consecutive months, which is tied for the longest monthly losing streak since the index’s inception in 1985. The only two other periods with an equal number of monthly declines were the eight months ending in October 2007 and before that September 2006. As most Americans remember, these periods were followed by precipitous declines in home values. Interestingly, the NY Post reported that Google searches for “sell my home fast” spiked by 2,750%.
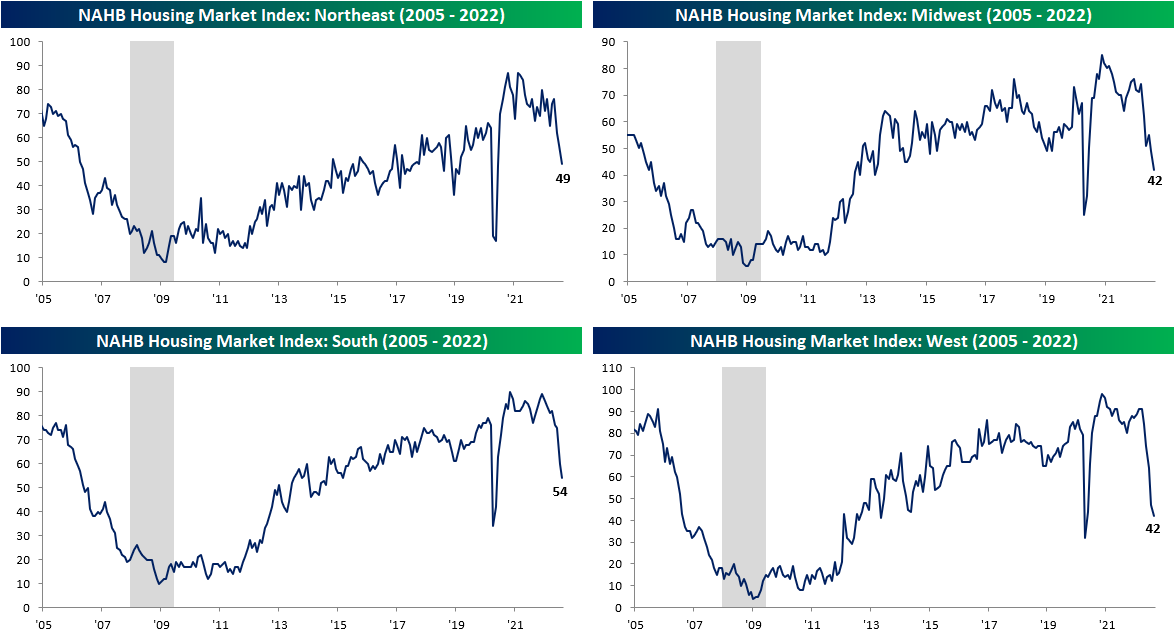
All of the sub-indices within the report fell as well, indicating broad weakness. Apart from Future Sales and sentiment in the Western region, all of the other sub-indices experienced declines that were in the bottom 5th percentile of all periods. However, the current readings are not nearly as negative. Future sales and traffic are in the 18th and 23rd percentile, but the Northeast is still in the 63rd percentile. Although the current readings aren’t as low as the readings leading up to previous recessions, it is difficult to be positive given the current trends.

As shown above, no geographic region has been safe from the plunge in sentiment, but the Northeast has held up better than the others. Over the last eight months, the West, South, and Midwest regions have seen their largest eight-month declines in the index on record, while the decline in the Northeast is the third worst on record. Click here to start a two-week trial to Bespoke Premium and receive our paid content in real-time.
The stocks most affected by these trends – homebuilders – struggled during the sustained sell-off between the end of 2021 and mid-June, but have recovered by over 28% relative to the lows. However, the ETF is still down over 22% relative to the highs. The recovery might be due to the fact that much of the negativity has been priced in, historically low valuation multiples, and a pullback in interest rates. The chart below shows the performance of the SPDR S&P Homebuilders ETF (XBH). As you can see, XBH has broken its downtrend and has been moving consistently higher carving out what might be a new uptrend.

Empire Collapses
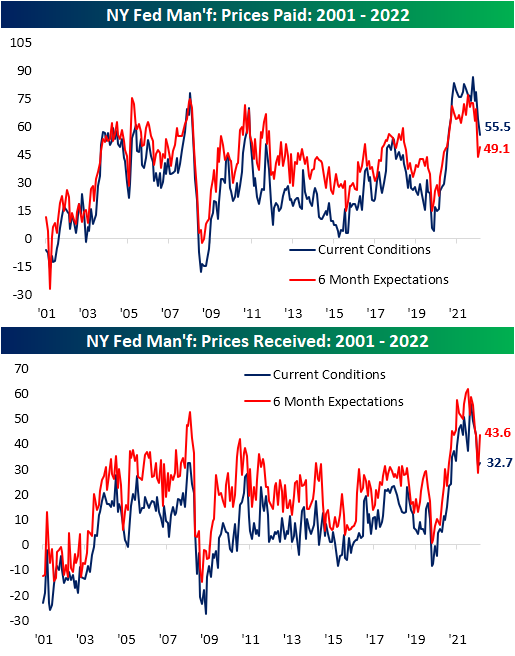
The first regional Fed manufacturing reading for the month of August which came from the NY Fed showed a massive slowdown in general business conditions. The headline number was expected to fall but remain positive at 5. Instead, the index plummeted all the way down to a contractionary reading of -31.3. That is the fourth lowest reading on record, the lowest reading since May 2020, and the largest one-month decline since April 2020. In other words, New York area manufacturers reported rapid deterioration in business conditions in the first half of August.

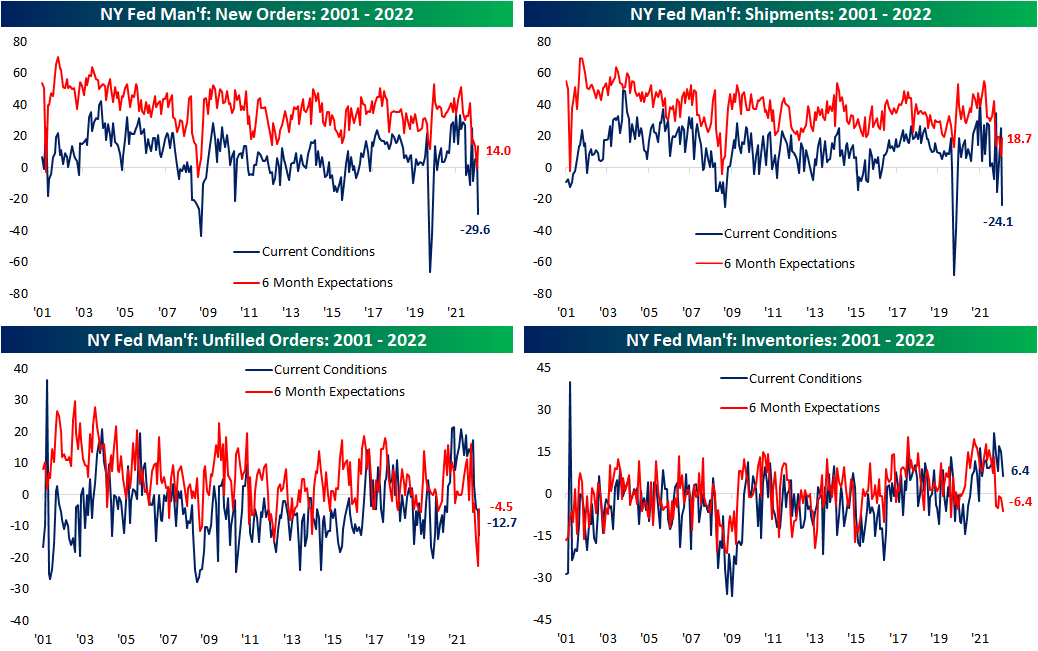
Breadth was equally horrendous. The sole index that managed to move higher month over month was Prices Received while declines in all of the others resulted in all but four categories falling into contraction territory. Future expectations are only slightly more positive than current conditions, albeit these too are seeing readings in the bottom few percentiles of their historical ranges even after significant moves to the upside month over month.

The most pronounced drop of any category was New Orders and Shipments with month-over-month declines of 35.8 points and 49.4 points, respectively. For both, that was the largest month-over-month drop on record with both indices now in the bottom 1% of all readings as a result. Unfilled Orders fell deeper into contraction with a less dramatic 7.5 point decline month over month.
Expectations were the inverse of that story. New Orders, Shipments, and Unfilled Orders all saw upper decile monthly increases with Unfilled Orders’ 18.1 point rise the second largest on record behind May 2010.
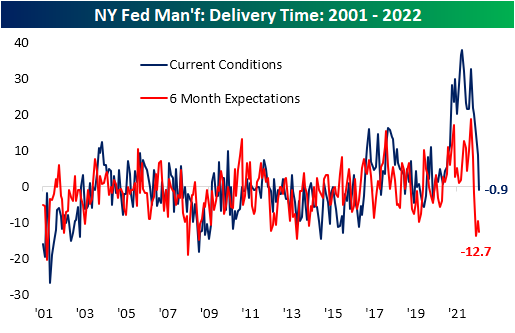
The past couple of months have seen plenty of evidence that supply chain stress has begun to ease, and this month’s report from the NY Fed added yet another data point of evidence. For the first time since May 2020, the Delivery Times index fell into contraction meaning responding firms reported a decline in how long it took for products to reach their destinations. That trend is also expected to continue as six-month expectations continue to hover around the low end of the historical range.
Alongside supply chain pressures, inflation pressures have likewise shown signs of easing. The Prices Paid and Prices Received index have both peaked and come in well off of prior highs of the past year indicating fewer firms are paying suppliers more or raising their prices.
Across manufacturing reports of late, employment metrics have been somewhat of a bright spot as they have managed to hold up in spite of signs of slowing demand. In August, employment did not stand out as strongly. On net, firms continue to increase their number of employees but at the slowest rate since October 2020. Meanwhile, the Average Workweek contracted to an extent not seen since the first few months of the pandemic, late 2015, during the Financial Crisis, or in the aftermath of 9/11. Meanwhile, companies are beginning to pull back on capital spending at a rapid rate as indices tracking plans for Technology Spending and Capital Expenditure have fallen sharply. For the latter, the two-month decline is now the fifth worst of any period on record. Click here to learn more about Bespoke’s premium stock market research service.

S&P 500 Reaches Extreme Overbought Levels
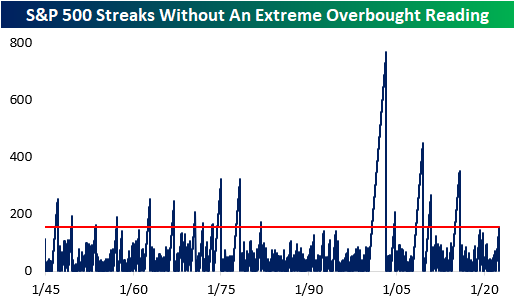
On Friday, the S&P 500 rallied 1.7% to round off the fourth straight week of gains. Relative to the mid-June lows, the index has rallied 16.7%, a notable move as YTD weakness subsides (at least for now). With Friday’s move, the S&P 500 also closed more than two standard deviations above its 50-day moving average for the first time since 12/29/21, marking the end of a 155-day trading day streak in which the index did not close at ‘extreme’ overbought levels.

A streak of this length had not been reached since 2015, and the longest streak since WWII ended in 2003 (768 trading days). All in all, there have now been 27 streaks since WWII where the S&P 500 went at least six months without registering a close in ‘extreme’ overbought territory. Click here to start a two-week trial to Bespoke Premium and receive our paid content in real-time.
For investors who are long equities, it’s hard not to like the way stocks have performed in recent weeks. However, with the market reaching overbought levels after a sharp rally, fears of a pullback increase as moves of this magnitude may be unsustainable. Historically speaking, median returns following the end of prior streaks without an ‘extreme’ overbought reading that lasted at least six months have, in aggregate, been followed by decent returns. For every time period we looked at (next day, next week, one month, three months, and six months), median returns were positive and better than the historical average for all comparable time periods since WWII. Over the next three months, for example, the S&P 500’s median performance was a gain of 4.4% which is 1.8 percentage points better than the historical average for all six-month periods. From a historical perspective at least, when equities reach ‘extreme’ overbought levels after a prolonged period without a similar reading, fears of an imminent reversal were typically unwarranted.

Positivity rates tend to be superior as well, apart from one month forward. Over the next week (which would be through the end of the week in this case), the S&P 500 has performed positively 77% of the time, which is 20 percentage points higher than that of all periods. Over the next three and six months, the positivity rate has been 73%, which is also quite positive. Click here to start a two-week trial to Bespoke Premium and receive our paid content in real-time.

To paint the full picture, the maximum drawdown following these occurrences was in November of 1981, when the S&P 500 fell by 10.8% over the next three months and 11.6% over the following six months. On the flip side, the best performance occurred following the January of 1975 occurrence, when the index went on to gain 14.4% and 17.7% over the next three and six months, respectively. Over the following month, the data has a range of -7.1% to +6.6%. Click here to start a two-week trial to Bespoke Premium and receive our paid content in real time.
Bespoke’s Morning Lineup – 8/15/22 – The Best of Times and the Worst of Times
See what’s driving market performance around the world in today’s Morning Lineup. Bespoke’s Morning Lineup is the best way to start your trading day. Read it now by starting a two-week trial to Bespoke Premium. CLICK HERE to learn more and start your trial.
“A day wasted on others is not wasted on one’s self.” – Charles Dickens
Below is a snippet of content from today’s Morning Lineup for Bespoke Premium members. Start a two-week trial to Bespoke Premium now to access the full report.
Coming out of a four-week winning streak, bad news out of China has put pressure on stocks to kick off the week. S&P 500 futures have been trading down over half of one percent this morning, but that weakness comes after a four-week rally of over 10% which took the S&P 500 to ‘extreme’ overbought levels (more than two standard deviations above 50-DMA) to close out last week.
The week kicks off on the economic calendar with the Empire Manufacturing report at 8:30 Eastern and then Homebuilder Sentiment at 10 AM. Both of these numbers will be for the month of August, so bulls will want to see improvement in both readings to allay any concerns over the health of the economy.
Today’s Morning Lineup discusses earnings and market news from Europe and the Americas, overnight economic data, including the weaker than expected data out of China which prompted a surprise rate cut, and much more.
A lot of people go on vacation in the second half of August, so things often tend to quiet down. In a perfect world, the slowdown would be accompanied by a period where not much occurs in the markets. Every so often, though, less liquidity at this time of year can exacerbate the impact of news and cause an exaggerated move in markets. Usually, the direction is lower. From a seasonal perspective, the upcoming one-week period has historically been one of the weakest of the year. Over the last ten years, the S&P 500’s median decline from the close on 8/15 through 8/22 has been a decline of 0.26% which ranks in just the 22nd percentile of all one-week periods throughout the year. As bad as the upcoming week has tended to be for stocks, the next three months have historically been one of the better periods as the S&P 500’s median gain has been 4.56% which ranks in the 86th percentile of all three-month periods throughout the year.

Start a two-week trial to Bespoke Premium to read today’s full Morning Lineup.