So Much for the Positive Wealth Effect
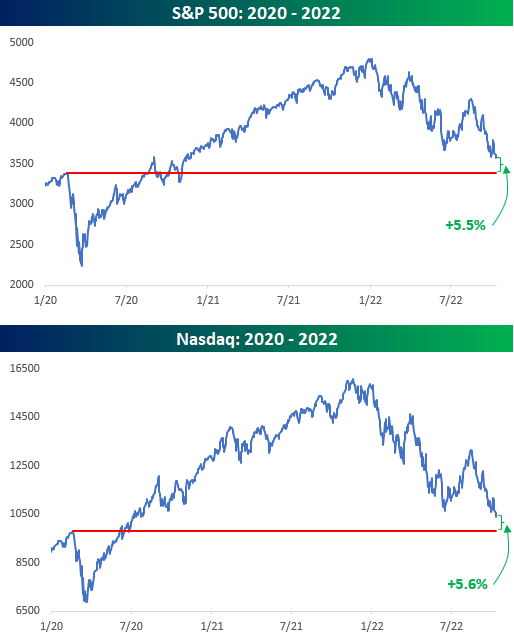
As the weakness in equities continues, we wanted to provide an update on where the major averages stand relative to their pre-COVID highs in February 2020. In the case of the S&P 500 and Nasdaq, they’re both still up, but the gains are quickly fading. It has now been just about two and a half years since the pre-COVID high for the S&P 500, and from that peak to this morning, the S&P 500 is up just 5.5% and the Nasdaq is up 5.6%. On an annualized basis, that works out to less than 2.5%. What’s that phrase people kept saying about irrational moves in stock prices?
As if equity market returns relative to the pre-COVID high weren’t pedestrian enough, keep in mind that once you take the impact of inflation into account, investors are actually now solidly in the red. The charts below show the performance of the S&P 500 and Nasdaq on an inflation-adjusted basis by adjusting historical prices based on headline CPI. After adjustments, the S&P 500 and Nasdaq are both down 7.7% from their February 2020 highs. As bad as the investing backdrop has been for equities, long-term US Treasuries have fared much worse than that. On a nominal basis, long-term US Treasuries have declined 28%, and after adjusting for inflation, the declines have been well over 30%. Click here to learn more about Bespoke’s premium stock market research service.

Bespoke’s Morning Lineup – 10/11/22 – The Roller Coaster Continues
See what’s driving market performance around the world in today’s Morning Lineup. Bespoke’s Morning Lineup is the best way to start your trading day. Read it now by starting a two-week trial to Bespoke Premium. CLICK HERE to learn more and start your trial.
“Sometimes the wheel turns slowly, but it turns.” – Lorne Michaels

Below is a snippet of content from today’s Morning Lineup for Bespoke Premium members. Start a two-week trial to Bespoke Premium now to access the full report.
Equity futures were sharply lower this morning but have rebounded sharply in the last hour. There’s no specific catalyst to the move, but the BoE’s expansion of its bond-buying program has certainly helped. The monthly look at small business sentiment from the NFIB came in slightly higher than expected (92.1 vs 91.6) and increased slightly relative to August’s reading. There are no other economic data on the calendar today, but Cleveland Fed president Loretta Mester will be speaking at noon, and remember that in late September she made some rather hawkish comments suggesting that hell or high water wouldn’t deter the Fed from hiking rates to combat inflation.
Between value and growth stocks yesterday, we saw a modest divergence where the S&P 500 Growth ETF (IVW) traded at a new low while the Value ETF (IVE) did not. At face value, that divergence would sound like a negative for growth stocks. Looking at the price charts of each ETF, though, shows that while the growth ETF made a new low yesterday breaking through its September and summer lows, the value ETF had already broken below its summer lows in late September. So yes, value has outperformed over the last few days, but the technical picture for both is lousy.

Our Morning Lineup keeps readers on top of earnings data, economic news, global headlines, and market internals. We’re biased (of course!), but we think it’s the best and most helpful pre-market report in existence!
Start a two-week trial to Bespoke Premium to read today’s full Morning Lineup.
Energy Surges Without the S&P
Taking a glance across sector ETFs in our Trend Analyzer tool, performance last week through Friday’s close wasn’t fully lost as many sectors managed to hold onto their gains from earlier in the week while others like Real Estate (XLRE), Utilities (XLU), and Consumer Discretionary (XLY) finished more firmly in the red. As was the case earlier this year, the most standout sector has continued to be Energy (XLE). Although the sector has been pretty much trending sideways since the late spring and remains down double digit percentage points from its 52-week high, short term performance has been impressive. Last week the sector ETF rose 13.6% to move from one standard deviation below its 50-day to one standard deviation above. Meanwhile, every other sector remains oversold.

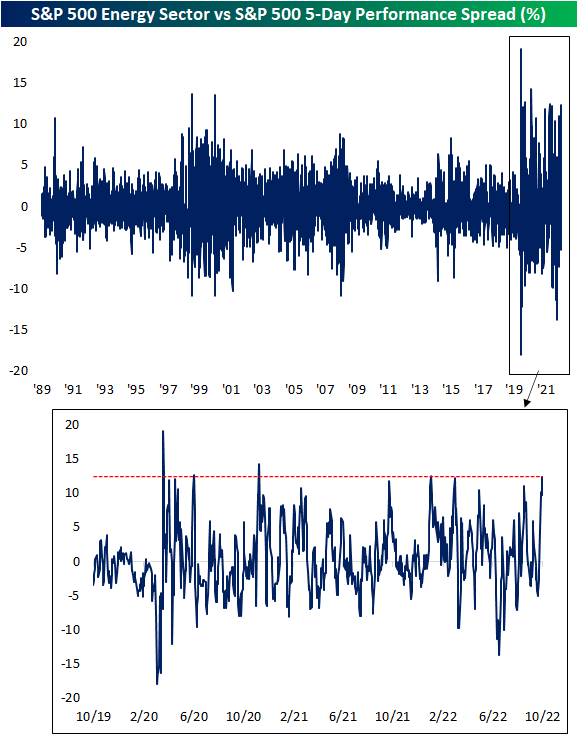
Compared to the S&P 500’s modest gains on the week, Energy’s outperformance has little precedence prior to the pandemic. Below we show the spread of the five day performance of the S&P 500 Energy sector and the S&P 500. Rounding out last week with a high of 12.4 percentage points, the spread hit the highest level since the first week of January. Prior to that, March, June, and November 2020 were the only other recent occurrences with as large of a spread. In our data going back to 1990, the only other time that Energy has outperformed the broader market by as much in a one week span was October 2000 and April 1999. Click here to learn more about Bespoke’s premium stock market research service.
Bespoke’s Morning Lineup – 10/10/22 – Treasury Market Closed
See what’s driving market performance around the world in today’s Morning Lineup. Bespoke’s Morning Lineup is the best way to start your trading day. Read it now by starting a two-week trial to Bespoke Premium. CLICK HERE to learn more and start your trial.
“For the execution of the journey to the Indies I did not make use of intelligence, mathematics or maps.” – Christopher Columbus
Below is a snippet of content from today’s Morning Lineup for Bespoke Premium members. Start a two-week trial to Bespoke Premium now to access the full report.
The bond market is closed today, so at least Treasury yields can’t go up. We wish we could say the same thing about yields across the Atlantic, though, where British gilt yields are all higher and getting back up near their closing highs from less than two weeks ago.
Equity markets are open for trading today, and after opening sharply lower last night, futures have rebounded to move close to the unchanged level. That’s the type of environment we’re in these days when just a modestly negative open to start the day is considered a win. With banks and the treasury market closed for trading, there is no economic data on the calendar today, so expect volumes to be on the light side.
How bad is sentiment out there? In looking through the various Bloomberg headlines this morning, the following three were all out one after the other:
- “Deutsche Bank Strategists See 12% Drop in US EPS Next Year”
- “MS Strategists See Bear Market Continuing Until Earnings Reset”
- “Goldman’s Kostin Sees Strong Dollar as Headwind for US Earnings”
Like the birds overhead, sentiment heading into earnings season has been moving south. Bulls can only hope that sentiment has moved south enough already.
Over the last several years, Columbus Day has seen some extreme market moves. The two best Columbus day performances for the S&P 500 were in 2008 (+11.58%) and 2011 (3.41%), and the one thing both of those years have in common is that they were lousy years for stocks heading into Columbus Day To the downside, the worst Columbus Day performance was in 2014 when the S&P 500 declined 1.65%, and no other year besides 2014 over the last 25 has seen a decline of more than 1%.

While the two best Columbus Days for the S&P 500 came in years when stocks were already down big YTD, there isn’t really much of an inverse correlation between YTD performance and Columbus Day returns. In the seven years over the last 25 when the S&P 500 was down YTD heading into the holiday, the median Columbus Day performance was a gain of 0.13% with positive returns four out of seven times (57%). In the 18 remaining years when stocks were up YTD heading into the holiday, the S&P 500’s median performance on Columbus Day was a gain of 0.05% with gains 10 out of 18 times (56%).

Our Morning Lineup keeps readers on top of earnings data, economic news, global headlines, and market internals. We’re biased (of course!), but we think it’s the best and most helpful pre-market report in existence!
Start a two-week trial to Bespoke Premium to read today’s full Morning Lineup.
Bespoke Brunch Reads: 10/9/22
Welcome to Bespoke Brunch Reads — a linkfest of the favorite things we read over the past week. The links are mostly market related, but there are some other interesting subjects covered as well. We hope you enjoy the food for thought as a supplement to the research we provide you during the week.
While you’re here, join Bespoke Premium with a 30-day trial!
Ukraine
Russia’s Elites Are Starting to Admit the Possibility of Defeat by Tatiana Stanovaya (Carnegie Endowment)
There are emerging signs that Russian elites are losing patience with the disastrous prosecution of the war in Ukraine after months of solid support. [Link]
She’s a Doctor. He Was a Limo Driver. They Pitched a $30 Million Arms Deal. by Justin Scheck (NYT)
A rush to supply arms to Ukraine has led to shady, untested ventures sprawling across countries delivering large scale shipments of weapons to the embattled country. [Link; soft paywall]
Rate Hikes
U.N. Calls On Fed, Other Central Banks to Halt Interest-Rate Increases by Paul Hannon (WSJ)
The United Nations Conference on Trade and Development (UNCTAD) argued that the speed and size of Fed rate hikes risk a global recession and are getting carried away. [Link; paywall]
Fed’s Rate Increases Defy All the Rules by Greg Ip (WSJ)
The Federal Reserve’s monetary policy has departed from a series of different rules that relate inflation, unemployment, and the policy rate. [Link; paywall]
Lives Lived
I just learned I only have months to live. This is what I want to say. by Jack Thomas (Boston Globe)
A heartfelt essay on the meaning of a life spent with family, words, and the many details of life that the author will mis when he shoves off this mortal coil. [Link]
Layoffs
Peloton is slashing 500 more jobs as its CEO says it has 6 months to turn itself around by Grace Dean (Business Insider/MSN)
The exercise technology company has announced a fourth round of layoffs with a fresh 12% of workers being dropped as part of a sprawling turnaround plan that has seen headcount cut in half from its peak. [Link]
New Tech
100% Electric Vehicles = 11% Of New Vehicle Sales Globally! by José Pontes (CleanTechnica)
Fully electric vehicle sales were up 60% YoY and area headed for 1mm units in September; the August sales pace was good for 1 car in 10 globally and that share is only growing. [Link]
Walgreens Turns to Prescription-Filling Robots to Free Up Pharmacists by Sharon Terlep (WSJ)
Machine-based dispensaries have helped Walgreens fill prescriptions by raising productivity; total cost savings are more than $1bn. [Link; paywall]
Real Estate
Hybrid Working, Commuting Time, and the Coming Long-Term Boom in Home Construction by Jordan Rappaport (KC Fed)
With more workers able to spend only a couple of days per week at the office, out-lying suburbs and exurbs could be the source of a major building boom in the coming decades. [Link; 35 page PDF]
House Prices: 7 Years in Purgatory by Bill McBride (Calculated Risk)
Widely-cited housing observer Bill McBride has gotten a lot more bearish on the housing market after the pandemic era surge has reversed into monthly declines: he sees long-term declines ahead for both real and nominal home prices. [Link]
Global Trade
WTO Sees Sharp Slowdown in Global Trade, Pointing to Possible Recession by Paul Hannon (WSJ)
The World Trade Organization sees trade activity growing by 1% in 2023, versus 3.5% growth this year and a 3.4% growth rate previously forecasted. High energy prices, war, and surging interest rates are all key factors. [Link; paywall]
China property woes trigger decline in global cement output by Oliver Telling, Thomas Hale, and Andy Lin (FT)
Collapsing real estate investment in China has driven global cement output down 8% in the first half of 2022 versus the first half of 2021; Chinese cement production (which is about half of the global market) fell 15%. [Link; paywall]
Cargo Shipowners Cancel Sailings as Global Trade Flips From Backlogs to Empty Containers by Costas Paris (WSJ)
After 2021 and early 2022 saw catastrophically high demand for ocean freight capacity, shipping lines are cancelling sailings amidst shipping rates in freefall and collapsing bidding for capacity from North American retail clients. [Link; paywall]
Contras
The Fund That Helped Investors Bet Against Cathie Wood Is Taking on Jim Cramer by Claire Ballentine (Bloomberg)
The ETF provider that gained prominence through a fund designed to move inverse to Cathie Wood’s ARK Invest funds is targeting another big “take the other side” opportunity: bets against stocks recommended by Jim Cramer on CNBC. [Link; soft paywall]
Social Media
Supreme Court takes up a divisive issue: Should tech companies have immunity over problematic user content? by Lawrence Hurley and David Ingram (NBC)
The Supreme Court has agreed to hear a case that could strip internet companies of immunity over content posted by their users; changes could mean much more aggressive content moderation across the political spectrum from companies like Twitter, Facebook, and Google. [Link]
The Call of The Wild
Coyotes Came to New York City, but Not for Our Pizza by Bethany Brookshire (NYT)
While coyotes enjoy the occasional nibble of human chow, even urban packs subsist mostly on the wild foods that they would be eating in any other environment. [Link; soft paywall]
Read Bespoke’s most actionable market research by joining Bespoke Premium today! Get started here.
Have a great weekend!
The Bespoke Report – 10/7/22 – Read Our Lips: No Easing Ahead
This week’s Bespoke Report newsletter is now available for members.
Markets tried and failed once again this week to catch a Fed pivot, but with the central bank refusing to believe inflation has peaked optimism was eventually dashed. Another strong jobs report on Friday sent stocks tumbling in yet another tightening of financial conditions. It’s not just stocks, either. We discuss the move higher in Treasury yields, the rise in the dollar, and rising corporate bond yields from a long-term perspective and in the context of the Fed’s campaign to keep pushing policy tighter. OPEC+ was also in the headlines this week, and we give a full analysis, along with summaries of PMI indices in the United States, a preview of earnings season, analysis of mortgage rates’ surge, discussion of the housing market, recaps of multiple labor market data releases received this week, and much more in this week’s Bespoke Report.
To read this week’s full Bespoke Report newsletter and access everything else Bespoke’s research platform has to offer, start a two-week trial to one of our three membership levels.

Bespoke’s Morning Lineup – 10/7/22 – Warm Jobs Report
See what’s driving market performance around the world in today’s Morning Lineup. Bespoke’s Morning Lineup is the best way to start your trading day. Read it now by starting a two-week trial to Bespoke Premium. CLICK HERE to learn more and start your trial.
“You never know what those Cumberland players have up their sleeve” – John Heisman
Below is a snippet of content from today’s Morning Lineup for Bespoke Premium members. Start a two-week trial to Bespoke Premium now to access the full report.
The above comment was made by coach Heisman during halftime of a game on this day in 1916 when Georgia Tech was beating Cumberland University by a score of 126-0. Bulls are this year’s Cumberland University as financial assets of all types are in the red YTD, and the classic 60/40 portfolio is having its worst year on record. This week, they’ve seen a faint glimmer of hope even as the Fed keeps turning up the heat, but it remains to be seen if they can chip away at the bears’ lead. After taking a 126-point lead at the half, Georgia Tech went on to win 222-0 in what was the most lopsided college football game of all time. The bulls can only hope the next three months don’t play out like the second half of Georgia Tech vs Cumberland and make 2022 one of the most-lopsided years in terms of downside stock market performance.
Today’s employment report isn’t going to help the bull’s cause. While Non-Farm Payrolls only surpassed expectations by 8K (263K vs 255K), the Unemployment Rate came in at 3.5% versus forecasts for an increase to 3.7%. Futures, which were higher heading into the report, have reversed those gains and are now indicated modestly lower.
When the economy was cratering during the early days of COVID, once the Federal Reserve and Congress stepped in with massive stimulus, markets looked right through the weakness and rallied. Two years later, we’ve done a 180. Heading into today’s Non-Farm Payrolls (NFP) report for September, seven of the eight reports for 2022 have come in better than expected. Over the course of these eight reports, the initially reported reading was an average of 133K greater than consensus forecasts. That may not sound like a lot, but prior to COVID, there were only six other NFP reports out of 262 where the actual reported reading exceeded consensus forecasts by more than that amount.
Even as the US employment situation has outperformed expectations this year by an unprecedented margin, stocks haven’t liked it one bit. The table below lists the date of each NFP report this year and summarizes how the initial reading came in relative to expectations along with how the S&P 500 performed on the day (using SPY as a proxy). Of the seven NFP reports that came in better than expected, the S&P 500 gapped lower by an average of 0.48% and finished the day down by an average of 0.55% six out of seven times. The economy may be doing OK, but once again, the market is looking right through it to one of the most aggressive tightening cycles by the Federal Reserve investors have ever seen.

Our Morning Lineup keeps readers on top of earnings data, economic news, global headlines, and market internals. We’re biased (of course!), but we think it’s the best and most helpful pre-market report in existence!
Start a two-week trial to Bespoke Premium to read today’s full Morning Lineup.
Bears Remain Above 50%
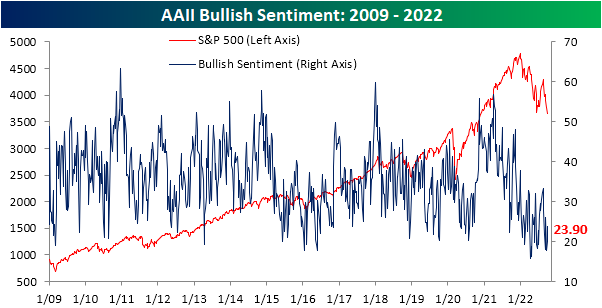
The past week’s rebound in equity prices has bolstered sentiment a bit as the latest AAII survey showed an increase in bullishness. For the second week in a row, bullish sentiment rose week over week to come in at 23.9%. That is, of course, still below the reading of 26.1% only three weeks ago and even further depressed relative to the historical average.
The pickup in bullish sentiment borrowed from bears. After two consecutive weeks of readings above 60% (the first such occurrence in the history of the survey), bearish sentiment has turned lower falling to 54.8%. As with bullish sentiment, that marks some improvement, but much more progress would need to be made to bring bearish sentiment back in line with the historical average of 30.5%.

Although the streak of readings above 60% is over, more than half of the respondents remain bearish. As shown below, that has grown to be the longest streak of such readings since the depths of the COVID Crash. Prior to that, there have only been six other such streaks: four occurring between 2008 and 2009 and the others occurring in August and October of 1990.

With both bullish and bearish sentiment improving, the bull-bear spread has risen up to -30.9 after hitting the lowest level since 2009 only two weeks ago.

Again, in spite of any improvement, sentiment remains heavily in favor of bears as it has for more than half a year. As shown below, the bull-bear spread has remained negative for 27 weeks in a row. That is the second-longest streak of negative readings on record but would need to continue for another two months to surpass the 2020 record.

Not all of the losses to bearish sentiment went to bulls. Neutral sentiment also rebounded slightly rising from sub-20% (the lowest level since April 2020) to 21.3%. Click here to learn more about Bespoke’s premium stock market research service.

The Bespoke 50 Growth Stocks — 10/6/22
The “Bespoke 50” is a basket of noteworthy growth stocks in the Russell 3,000. To make the list, a stock must have strong earnings growth prospects along with an attractive price chart based on Bespoke’s analysis. The Bespoke 50 is updated weekly on Thursday unless otherwise noted. There were no changes to the list this week.
The Bespoke 50 is available with a Bespoke Premium subscription or a Bespoke Institutional subscription. You can learn more about our subscription offerings at our Membership Options page, or simply start a two-week trial at our sign-up page.

The Bespoke 50 performance chart shown does not represent actual investment results. The Bespoke 50 is updated weekly on Thursday. Performance is based on equally weighting each of the 50 stocks (2% each) and is calculated using each stock’s opening price as of Friday morning each week. Entry prices and exit prices used for stocks that are added or removed from the Bespoke 50 are based on Friday’s opening price. Any potential commissions, brokerage fees, or dividends are not included in the Bespoke 50 performance calculation, but the performance shown is net of a hypothetical annual advisory fee of 0.85%. Performance tracking for the Bespoke 50 and the Russell 3,000 total return index begins on March 5th, 2012 when the Bespoke 50 was first published. Past performance is not a guarantee of future results. The Bespoke 50 is meant to be an idea generator for investors and not a recommendation to buy or sell any specific securities. It is not personalized advice because it in no way takes into account an investor’s individual needs. As always, investors should conduct their own research when buying or selling individual securities. Click here to read our full disclosure on hypothetical performance tracking. Bespoke representatives or wealth management clients may have positions in securities discussed or mentioned in its published content.