The Bespoke 50 Growth Stocks — 10/20/22
The “Bespoke 50” is a basket of noteworthy growth stocks in the Russell 3,000. To make the list, a stock must have strong earnings growth prospects along with an attractive price chart based on Bespoke’s analysis. The Bespoke 50 is updated weekly on Thursday unless otherwise noted. There were no changes to the list this week.
The Bespoke 50 is available with a Bespoke Premium subscription or a Bespoke Institutional subscription. You can learn more about our subscription offerings at our Membership Options page, or simply start a two-week trial at our sign-up page.
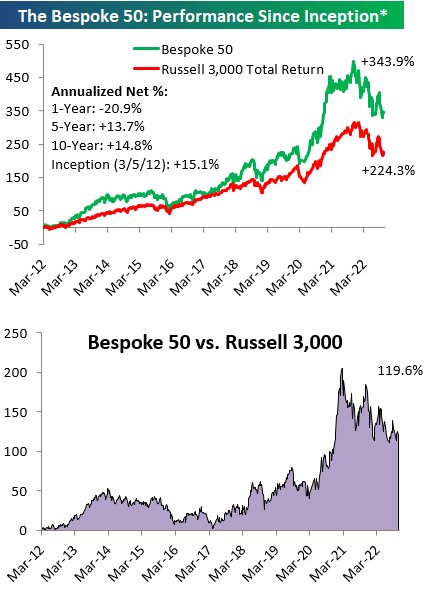
The Bespoke 50 performance chart shown does not represent actual investment results. The Bespoke 50 is updated weekly on Thursday. Performance is based on equally weighting each of the 50 stocks (2% each) and is calculated using each stock’s opening price as of Friday morning each week. Entry prices and exit prices used for stocks that are added or removed from the Bespoke 50 are based on Friday’s opening price. Any potential commissions, brokerage fees, or dividends are not included in the Bespoke 50 performance calculation, but the performance shown is net of a hypothetical annual advisory fee of 0.85%. Performance tracking for the Bespoke 50 and the Russell 3,000 total return index begins on March 5th, 2012 when the Bespoke 50 was first published. Past performance is not a guarantee of future results. The Bespoke 50 is meant to be an idea generator for investors and not a recommendation to buy or sell any specific securities. It is not personalized advice because it in no way takes into account an investor’s individual needs. As always, investors should conduct their own research when buying or selling individual securities. Click here to read our full disclosure on hypothetical performance tracking. Bespoke representatives or wealth management clients may have positions in securities discussed or mentioned in its published content.
Sentiment Streaks Press On
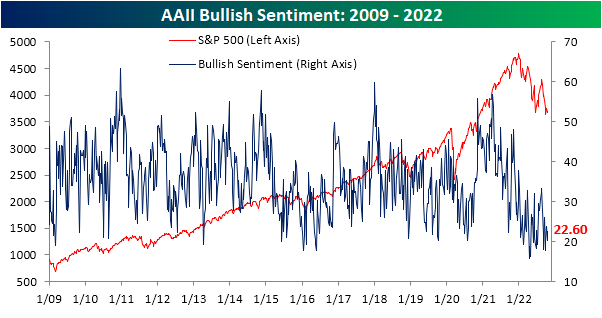
A small equity market bounce over the last week didn’t cause any major changes in investor sentiment, at least based on the weekly AAII numbers released this morning. The latest data from AAII showed 22.6% of survey respondents reported as bullish versus 20.4% the week before.
Bearish sentiment also rose slightly to 56.2% for the highest reading since the end of September when there were back to back weeks of readings above 60%.
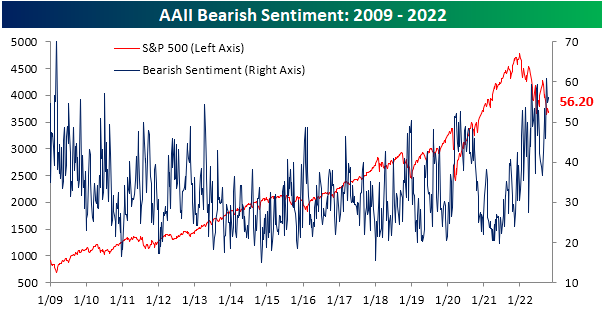
There is little precedent in the history of the AAII survey for over half of respondents to report as bearish for this many weeks in a row. As shown below, this week marked the fifth in a row that bearish sentiment came in above 50%. That is now the second longest such streak on record behind the seven week long streak in the fall of 1990.

Given more than half of responses to the survey have reported bearish sentiment, the bull bear spread continues to show negative readings (meaning bears outnumber bulls). The reading remains at the low end of the past decade’s range at -33.6.
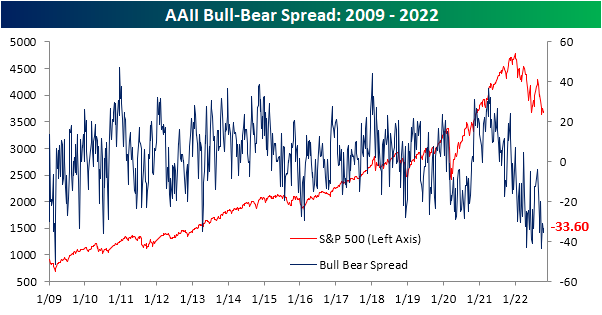
Similar to five straight weeks of 50%+ bearish sentiment, the streak of weeks with a negative bull-bear spread has grown to become the second longest on record at 29 weeks.

Turning to another reading on sentiment—the NAAIM Exposure Index—another notable streak has continued to press on this week. This index measures investment manager exposure to equities with readings ranging from -200 (leveraged short) to +200 (leveraged long) and readings of +/-100 representing responding managers are full long or short. The index has remained below 50 for eight weeks in a row now. That has tied the streak of sub-50 readings in the spring of 2020. Going back through the history of the index dating back to 2006, there have only been seven other periods in which equity exposure by active managers has been as muted for as long of a span as now. In other words, the AAII survey is not alone in showing persistent pessimism. Click here to learn more about Bespoke’s premium stock market research service.

Claims Take A Seasonal Dip
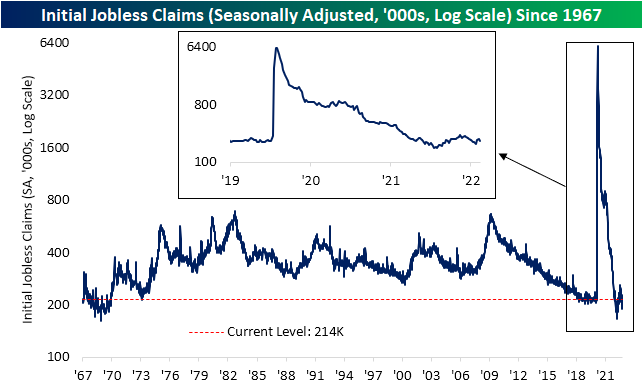
It was a good week for jobless claims as the seasonally adjusted number fell 12K to 214K versus last week’s downward revision to 226K. That compares to forecasts that were expecting claims to rise further to 233K. At current levels, claims remain healthy and within similar levels to the pre-pandemic range.
On a non-seasonally adjusted basis, claims were also lower as might be expected for the current week of the year. Historically, the current week of the year has consistently seen a brief break in the Q4 seasonal uptrend in claims. With that occurring again this year, claims are impressively strong. The only two years in which the comparable week has seen a lower reading in the non-adjusted number were 1969 (155K) and 1968 (151K).
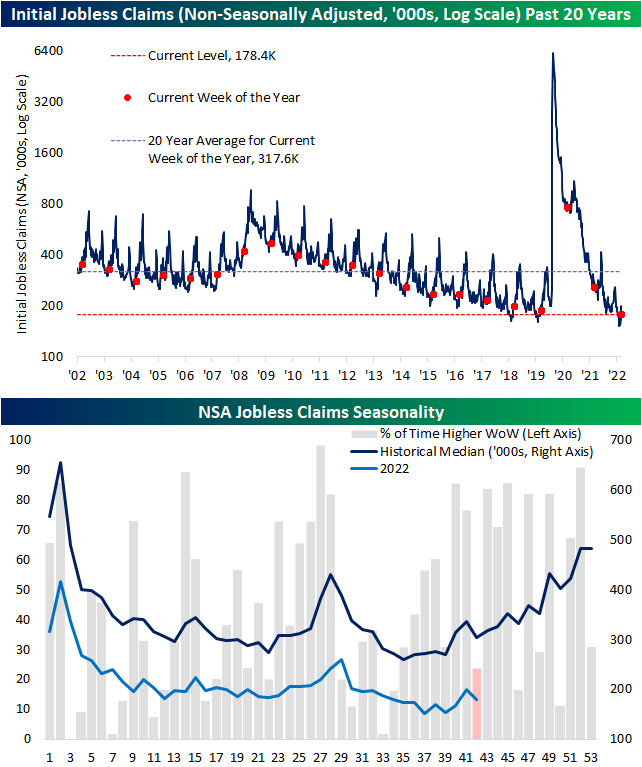
As we highlighted last week, roughly a third of the rise in national claims last week was thanks to Florida which was recently impacted by Hurricane Ian. One week later, claims in that state improved albeit they remain elevated and account for a disproportionally large drag on the national claims number. We would note, that the current hurricane-related spike is similar in size to the fall of 2017 when there was a historically damaging hurricane season (the year of Hurricanes: Harvey, Irma, and Maria).

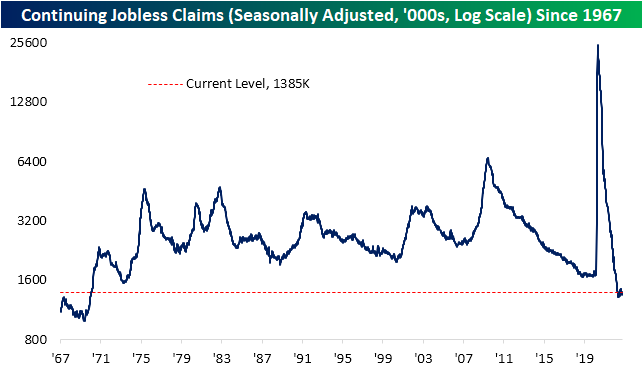
Turning to continuing claims, which are lagged an additional week to the initial claims number, the picture remains unchanged versus recent months. Claims are historically strong at 1.385 million and much lower than initial claims. Click here to learn more about Bespoke’s premium stock market research service.
Bespoke’s Morning Lineup – 10/20/22 – Opposite Week
See what’s driving market performance around the world in today’s Morning Lineup. Bespoke’s Morning Lineup is the best way to start your trading day. Read it now by starting a two-week trial to Bespoke Premium. CLICK HERE to learn more and start your trial.
“It is clearly now the will of the parliamentary Conservative Party that there should be… a new prime minister.” – Boris Johnson 7/7/22

Below is a snippet of content from today’s Morning Lineup for Bespoke Premium members. Start a two-week trial to Bespoke Premium now to access the full report.
Just over three months ago, Boris Johnson resigned as UK PM, and now this morning, his successor, Liz Truss, just announced she will be stepping down as PM. Do you think she had enough time even to unpack her bags? After trading lower throughout most of the night, S&P 500 futures had flipped modestly into positive territory this morning, but in the immediate aftermath of the resignation announcement, they pulled back closer to unchanged while Nasdaq futures are lower. Treasury yields have been behaving with nothing more than modest moves higher in yields across the curve. Crude, however, is rallying an additional 2%+ and back above $87 per barrel while copper is also up over 2%. Over in China, there was some positive news that the country is considering a reduction of the required quarantine time required for travelers in the country.
Here in the US, the general trend in earnings remains primarily positive, but there have been some duds. Tesla (TSLA) is trading lower after reporting weaker-than-expected sales raising concerns over demand, and Allstate (ALL) dropped over 10% after announcing Q3 catastrophe losses of $673 million. Lastly, Alcoa also reported weaker-than-expected EPS and sales and lowered forecasts for shipments, but anyone following the company over the years knows that it is hardly a bellwether.
In economic data this morning, Initial Jobless Claims came in lower than expected (214K vs 233K) while Continuing Claims were only slightly higher than forecasts (1.385 million vs 1.378 million). Also, the Philly Fed Manufacturing report for October improved less than expected rising from -9.9 to -8.7 versus forecasts for a reading of negative five.
This week’s equity market performance has been the opposite of the pattern we have seen this year. Heading into the week, the S&P 500 has averaged negative returns on every weekday this year except Wednesday when the average gain has been 0.20%. This week, the only down day (so far) was Wednesday, and on Monday and Tuesday, the S&P 500 was up well over 1%. While it’s still early, equity futures are once again modestly positive heading into Thursday’s trading. There’s still plenty of time left in the week but wouldn’t that be a welcome trend?

Our Morning Lineup keeps readers on top of earnings data, economic news, global headlines, and market internals. We’re biased (of course!), but we think it’s the best and most helpful pre-market report in existence!
Start a two-week trial to Bespoke Premium to read today’s full Morning Lineup.
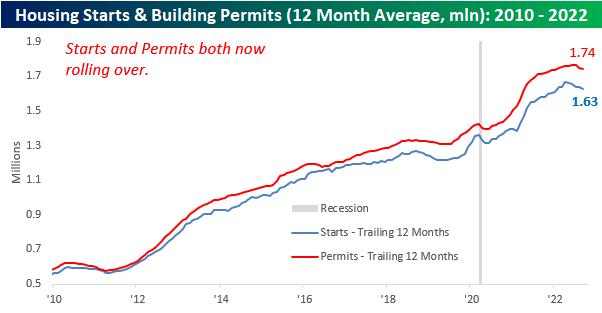
Housing Continues to Roll…Over
The latest update on Housing Starts and Building Permits from the Census Bureau was released this morning, and the results continue to reflect a significant slowdown in the sector. On a y/y basis, both starts and permits saw declines of 7.7% and 3.2%. respectively. The real weakness, however, has been in single-family units where starts are down 18.5% and permits fell 17.3% even as multi-family units were both up by double-digit percentages y/y. On a regional basis, the west was the only region to register a m/m uptick (4.5%) while the northeast was the only region registering an increase relative to last year. For permits, every region except the northeast was up m/m while it was the only region to register an increase on a y/y basis.

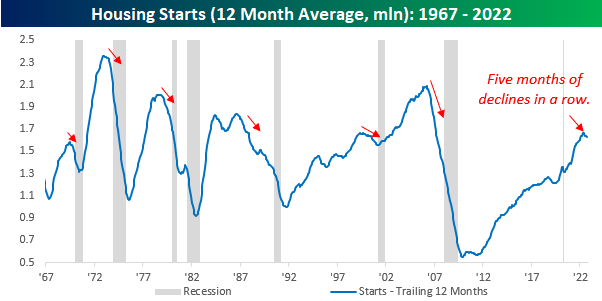
Housing Starts have historically done a good job predicting turns in the business cycle, so the fact that we have now seen five straight months of declines in this reading is just another indication of the risk of a recession on the horizon. We would note, however, that while recessions usually follow peaks in the 12-month average, they weren’t always imminent.
Looking more closely at the last few years, in addition to the decline in Housing Starts, the 12-month average of Building Permits has also started to roll over.
Single-family starts and permits have been even weaker. and both have now declined for five straight months. Also, the magnitude of the recent decline has been steeper than anything seen since the period from 2010 through 2012. Click here to learn more about Bespoke’s premium stock market research service.

Bespoke’s Morning Lineup – 10/19/22 – Worse Than 1987
See what’s driving market performance around the world in today’s Morning Lineup. Bespoke’s Morning Lineup is the best way to start your trading day. Read it now by starting a two-week trial to Bespoke Premium. CLICK HERE to learn more and start your trial.
“It’s the nearest thing to a meltdown that I ever want to see.” – John Phelan, NYSE Chairman (1987)
Below is a snippet of content from today’s Morning Lineup for Bespoke Premium members. Start a two-week trial to Bespoke Premium now to access the full report.
35 years ago today, US stocks experienced their largest single-day decline in history as the Dow dropped 22.6%. Back then, before most Americans had 401Ks, the stock market wasn’t nearly as enmeshed in the lives of Americans as it is today, but the plunge still was THE story of the day prompting questions over whether it was a repeat of 1929 and the depression that followed. With the benefit of time and hindsight, the market and economy quickly moved on from the 1987 crash, and it barely even registers as a blip on long-term stock charts. Since the close on 10/19/87, the S&P 500 has had an annualized total return of 10.71%. Even more notable, though, is that had you invested in the S&P 500 on the Friday before the crash, you’re annualized total return over that span would have still been just short of 10% (9.99%). Not bad for the worst-timed trade of all time.
Moving to the present day, 2022 has actually been worse than 1987. After the crash in 1987, the S&P 500 was down less than 8% YTD. Today, even after a gain of nearly 4% over the last week, the S&P 500 is down more than 20% YTD or twice the decline of the S&P 500 at this point in 1987.
This morning, futures are in the red after trading higher overnight as yields surge with the 10-year nearing 4.10%. Building Permits and Housing Starts were just released and came in mixed relative to expectations with starts missing forecasts while starts came in a bit higher than forecast. Mortgage applications continue to decline, though, suggesting that the sector will continue to face pressure.
It’s now been a week since the S&P 500’s closing low on 10/12 (the intraday low was on 10/13), so we wanted to take a bird’s eye look at where things stand at the index and sector level. Of the Russell 2000 (IWM), Nasdaq 100 (QQQ), and S&P 500 (SPY), IWM probably looks best from a technical perspective. Of the three indices shown, it is the only one that didn’t violate the June lows on a closing basis and is also the only one that made a higher high even if it was just on an intraday basis. For both QQQ and SPY, the charts look very similar as last week’s lows represented lower lows, and the rally over the last few days has yet to make a higher high.

At the sector level, Financials have been leading the charge, rallying more than 6% over the last week. Of the remaining ten sectors, the only one not up more than 2.5% is Utilities. Despite the gains from the last week, though, the only sector that has managed to retake its 50-day moving average is Energy, and four sectors (Technology, Real Estate, Consumer Discretionary, and Utilities) still remain at oversold levels.

Our Morning Lineup keeps readers on top of earnings data, economic news, global headlines, and market internals. We’re biased (of course!), but we think it’s the best and most helpful pre-market report in existence!
Start a two-week trial to Bespoke Premium to read today’s full Morning Lineup.
Not All New Lows for Homebuilders
With mortgage rates running higher unabated and mortgage demand decimated, homebuilder sentiment has continued to tank. The latest reading on homebuilder sentiment from the NAHB hit a new post-pandemic low in October dropping from 46 down to 38. Outside of the weaker readings in May and April of 2020, August 2012 was the last time the index was as low as it is now.
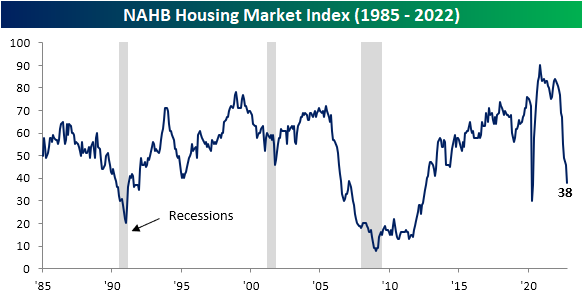
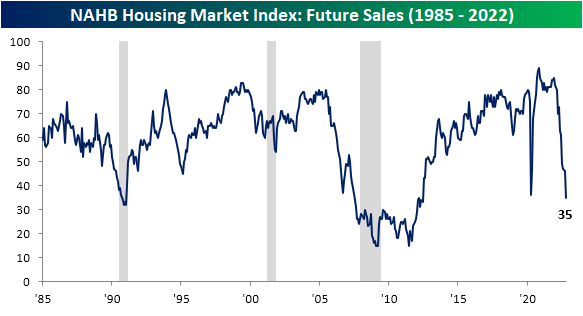
Not only is the index at a new cycle low, but the 8-point month-over-month drop also ranks in the bottom 1% of all monthly moves. The declines in the present and future sales indices rank by similar magnitudes.

Although the headline index as well as sub-indices like present sales and traffic have not yet taken out 2020 lows, the index for future sales dropped to its lowest level since June 2012. As shown above, it has the lowest reading within its respective range historically of each of the sub-indices.
The only other index in the report that is below 2020 levels is the sentiment in the West region. While the Midwest and South have also fallen precipitously, the Northeast actually experienced a modest rebound in sentiment. Relative to other indices in the report, homebuilder sentiment in the Northeast is remarkably stronger with the index in the 62nd percentile relative to historical readings.

As for the technical picture of homebuilder stocks, recent declines have been a bit healthier than the broader market. Whereas major indices set new 52-week lows as recently as last week, the lows for the S&P 1500 Homebuilders Group at the end of September and the end of last week were between 7% and 8% above the June lows. While the line is somewhat choppy, relative strength versus the broader market has also been generally trending upward since the spring. In last Monday’s Closer, we further highlighted the disconnect between housing stocks and macro data.

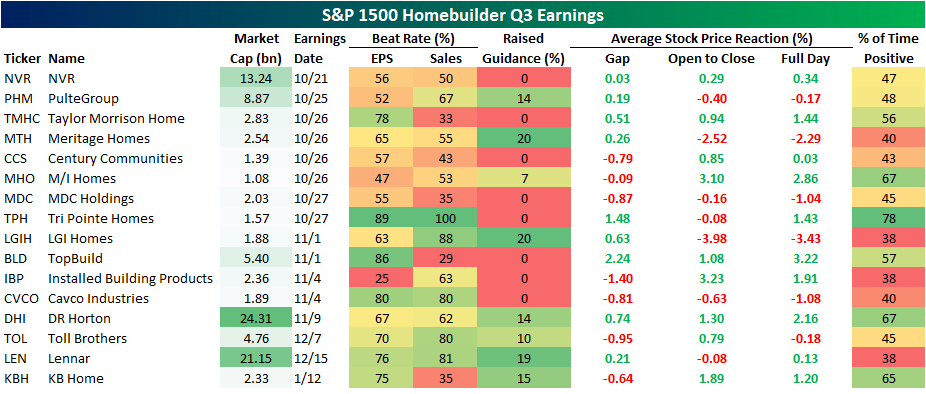
While homebuilder stocks have been holding up surprisingly well, earnings season is on the horizon which has the potential to change that picture; especially if said earnings start to mirror macro housing data. Using data from our Earnings Explorer database, below we show each of the S&P 1500 Homebuilder stocks as well as when they are expected to report earnings and what their historical Q3 earnings beat rates and stock price reactions have been.
Overall, Tri Pointe Homes (TPH) has been one of the strongest performers for Q3 with a positive reaction by the stock 78% of the time as it possesses the strongest beat rates as well. In fact, for TPH Q3 ranks as the best quarter of the year for stock price reactions. That is also the case for TopBuild (BLD) and KB Homes (KBH). Conversely, Q3 marks the weakest response to earnings for LGI Homes (LGIH), Cavco Industries (CVCO), Toll Brothers (TOL), and Lennar (LEN). Click here to learn more about Bespoke’s premium stock market research service.
Bespoke’s Morning Lineup – 10/18/22 – Back to Back 500s
See what’s driving market performance around the world in today’s Morning Lineup. Bespoke’s Morning Lineup is the best way to start your trading day. Read it now by starting a two-week trial to Bespoke Premium. CLICK HERE to learn more and start your trial.
“Though I am often in the depths of misery, there is still calmness, pure harmony and music inside me.” – Vincent Van Gogh
Below is a snippet of content from today’s Morning Lineup for Bespoke Premium members. Start a two-week trial to Bespoke Premium now to access the full report.
Stock futures are pointing sharply higher for the second day in a row this morning. While there are no specific catalysts, better-than-expected earnings against a backdrop of extremely oversold markets provide fuel for at least a short-term rally. Sentiment towards the market has been very negative as well. The latest example is the BofA Fund Manager Survey which showed the highest allocations to cash since 2001. Despite the rally in stocks, bonds are behaving as Treasury yields are modestly lower. In the commodities space, crude oil is little changed while gold is down modestly.
In the stock market lately, it’s either the end of the world or the beginning of a new bull market. In yesterday’s rally, the S&P 500’s net advance/decline (A/D) reading came in at +455 which followed a reading of negative -442 on Friday and +438 Thursday. With futures up nearly 2% this morning, it’s looking like another positive day of everything coming up roses (for now). We classify any day where the S&P 500’s net A/D reading is above positive 400 or below minus 400 as an all-or-nothing day. In the 1990s, all-or-nothing days were generally uncommon. There were seven years in the decade where there wasn’t more than one occurrence in an entire calendar year, and there were three with none.
As ETFs became more popular at the turn of the century allowing investors to buy or sell every stock in the index with one trade, the frequency of all-or-nothing days really picked up and peaked during the Financial Crisis when there were four straight years with more than 45. With all-or-nothing days occurring at a much more regular frequency in the last several weeks (and especially days), 2022 is giving some of those years from the Financial Crisis a run for their money. After three straight occurrences in a row (matching the total for all of 2017), the S&P 500 has now had 38 all-or-nothing days this year, putting 2022 on pace for 48. At that rate, this year would rank tied for third with 2010 trailing only 2011’s total of 70 and 2008’s total of 52.

Our Morning Lineup keeps readers on top of earnings data, economic news, global headlines, and market internals. We’re biased (of course!), but we think it’s the best and most helpful pre-market report in existence!
Start a two-week trial to Bespoke Premium to read today’s full Morning Lineup.
Flip Flopping Like a Politician
With Thursday’s 2%+ rally, followed by Friday’s 2%+ decline, and now today’s 2%+ rally, the S&P 500 tracking ETF (SPY) has now rallied or declined 2%+ for the third straight day. Since SPY’s inception in the early 1990s, the current streak is the 26th time that the ETF has been up or down 2%+ for three straight days (and the second this year). Of those 25 prior streaks, eleven extended to a fourth day, so while 2% moves aren’t especially common (less than 8% of all trading days), when SPY has 2%+ daily moves for three straight days, there has been a 2%+ move the following day 44% of the time. There’s a saying in markets that strength begets strength; a corollary to that phrase would be volatility breeds more volatility. Of the five streaks that lasted at least five trading days, one was in July 2002, three were in 2008 (September, October, and December), and the most recent, which ended up being the longest on record was in March 2020.

While we’ve experienced a short burst of volatility in the last few days, SPY’s average daily move recently hasn’t been particularly extreme. Over the last 50 trading days, SPY has averaged a daily move of +/-1.25%, which while well off its lows from early September, is still well below the levels seen back in June. For all the talk about why the VIX hasn’t seen a major spike, one big reason is that we have yet to see a meaningful uptick in day-to-day volatility. Click here to learn more about Bespoke’s premium stock market research service.

Bespoke’s Morning Lineup – 10/17/22 – Maximum Indecision
See what’s driving market performance around the world in today’s Morning Lineup. Bespoke’s Morning Lineup is the best way to start your trading day. Read it now by starting a two-week trial to Bespoke Premium. CLICK HERE to learn more and start your trial.
“There is no more miserable human being than one in whom nothing is habitual but indecision.” – William James
Below is a snippet of content from today’s Morning Lineup for Bespoke Premium members. Start a two-week trial to Bespoke Premium now to access the full report.
A move by UK finance minister Jeremy Hunt to reverse most of the provisions of his predecessor’s ‘mini-budget’ have global equities and bond prices rallying this morning after Friday’s disappointing negative reversal. No major headlines out of China (good or bad) coming out of the country’s national party congress has also helped to contribute to the positive tone. So far, there hasn’t been much in the way of earnings flow, but earnings from Bank of America (BAC) were better than expected and the stock is trading up a bit more than the broader market. The only economic report of the day was Empire Manufacturing, and that report was weaker than expected coming in at -9.3 versus forecasts for a reading of -1.0. Given the massive swings of the last several days, what do you think an average investor’s confidence level is that the gains hold throughout the day?
For all the fireworks of the last two trading days, neither bulls nor bears really have much to show for it. On Wednesday, the S&P 500 closed at 3,577; by the week’s end, the S&P 500 was just six points higher at 3,583. In between those six points, though, there were some historic swings in equity prices. On Thursday, the S&P 500 gapped down over 2% but then quickly erased those losses before noon and kept rallying throughout the afternoon to finish up over 2.5%. On Friday, it looked as though bulls were going to get some follow-through as the S&P 500 rallied more than 1% in early trading. The positive momentum was fleeting, though, and within an hour of the highs, all the gains were erased, and by the end of the day, equities shed another 2.4% erasing nearly all of the prior day’s gains. In the span of two days, the S&P 500 had two extremely rare reversals in completely opposite directions.

Our Morning Lineup keeps readers on top of earnings data, economic news, global headlines, and market internals. We’re biased (of course!), but we think it’s the best and most helpful pre-market report in existence!
Start a two-week trial to Bespoke Premium to read today’s full Morning Lineup.