Funding Markets Full of Cash
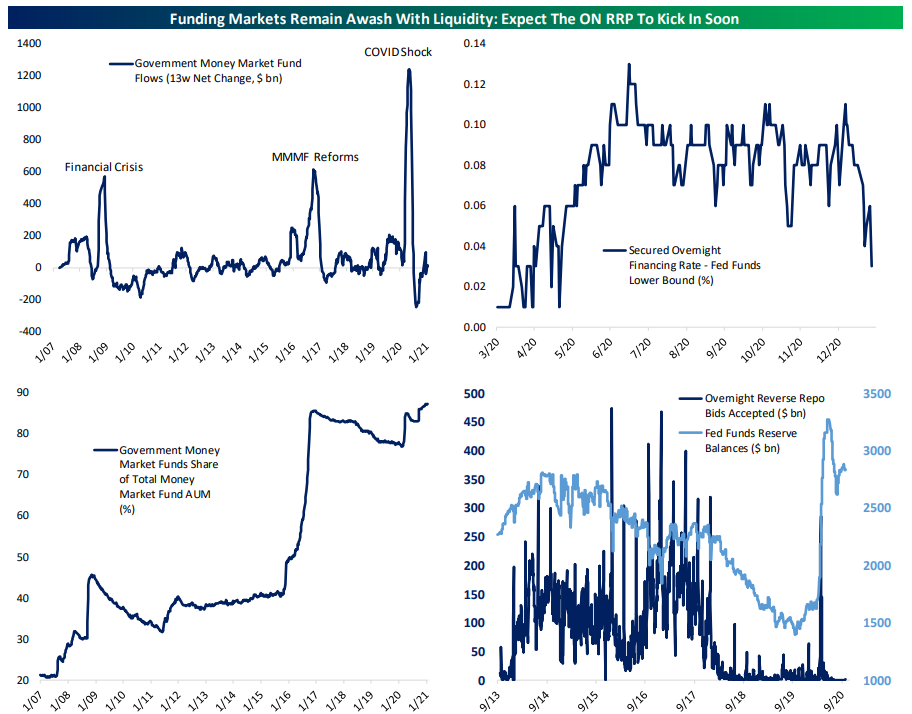
US funding markets are awash with liquidity thanks to ongoing QE purchases by the Fed and the progression of fiscal policy since the end of the year, as well as normal seasonal tailwinds that see more liquidity after year-end balance sheet constraints would roll off. Funding markets refer to collateralized, short-term lending via repo and related wholesale cash transactions.
Government money market funds that are allowed to conduct repo operations as well as buying Treasury and Agency debt are seeing roughly typical inflows, but those come on top of record share of overall money market funds. As a result, repo rates have been plunging. The secured overnight financing rate, which tracks the volume-weighted general collateral repo rate has fallen to 3 basis points above the bottom of the Fed Funds target range. While repo rates falling below the Fed Funds target range wouldn’t be a catastrophe and some parts of the market have gotten there, it’s not in the FOMC’s interest to have funding rates trading far outside its target policy rate range on a regular basis.
The solution already exists, of course: the NY Fed has a standing overnight reverse repo facility first introduced back in 2013 which is likely to start draining cash as investors seek higher returns than the repo markets offer. Reserve scarcity, which roll-off brought to bear in 2018 and 2019, is now reserve plenty, and so many reserves exist that the NY Fed will start draining them with reverse repos. Reserve balances will continue to grow this year thanks to QE purchases and an expected decline in the balance of the federal government’s transaction account at the Federal Reserve. Like what you see? Click here for a free trial to any of Bespoke’s premium membership options, including our Fixed Income Weekly note that features market analysis of this kind.
New High for the Kansas City Fed
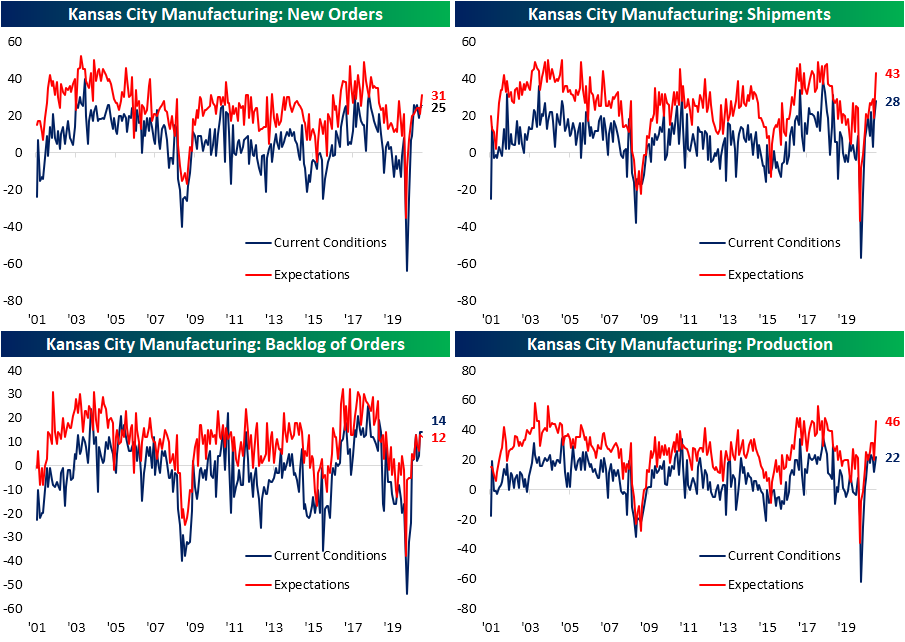
Similar to the Philly Fed’s index and Markit’s preliminary reading on the manufacturing sector, the Kansas City Fed’s manufacturing index exceeded expectations with a strong reading in January. The index was expected to decline to 13 from last month’s reading of 14. Instead, the index rose to 17 which is a new high for the pandemic period and is also the highest level since July of 2018. Similarly, the index for expectations was considerably higher as it now sits at the highest level since September of 2018. These readings are consistent with further acceleration in the growth of the region’s manufacturing economy.

Breadth across the report’s components was very strong with all but two (Backlog of Orders and Materials Inventories) higher month over month. Only the index for Finished Good Inventories is in contraction, but even this index saw a move higher that stood in the top 94% of all monthly changes. Additionally, a number of components are in the top decile of their historical ranges. The indices for future expectations, on the other hand, were not quite as strong, but those also generally point to an optimistic outlook.

Demand appears to be healthy as the indices for New Orders, Backlog of Orders, Shipments, and Production all came in at the top 10% of historical readings. While New Orders and Production sit just below their highs from October, Shipments and Backlog of Orders are at the highest levels since November of 2018. As for expectations, each of these indices with the exception of Backlog of Orders reached the highest levels since 2018 as well.
Just as we have seen in various other readings on the manufacturing sector recently, prices continue to rise for both inputs and final goods. The reading on Prices Paid for Raw Materials rose to a new high of 65. That is a level that has not been seen since April of 2011. As for prices passed onto customers, the index for Prices Received for Finished Products did not see as dramatic of a move higher. With an increase of 10 points (to 19) in January, it is at the highest level in two years. Click here to view Bespoke’s premium membership options for our best research available.

Bespoke’s Weekly Sector Snapshot — 1/28/21
Shorts and Bad Breadth Shakes Sentiment
Outside of the outrageous moves of heavily shorted names, breadth in recent days has actually been on the weak side. As a result of weakening breadth coupled with people questioning the likelihood of a bubble given the oddity of those shorted stocks’ moves, investors appear to have turned a bit more cautious. AAII’s reading on bullish sentiment dropped 4.8 percentage points from 42.5% down to 37.7%. That is the first sub-40 reading since the first week of November and is the lowest reading since the last week of October. The week over week decline was also the largest since the 11.49 percentage point decile coming off the recent peak in mid-November.
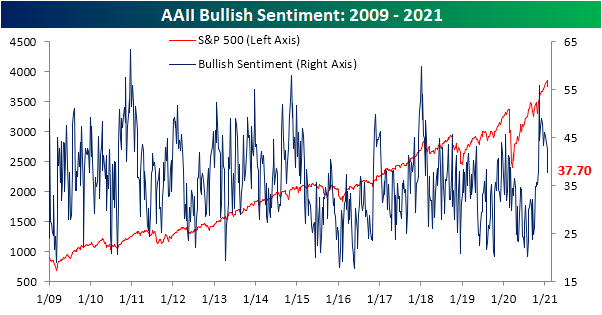
The losses in bullish sentiment were met with a 3.8 percentage point increase in bearish sentiment. That brings bearish sentiment to the highest level since the week of October 8th. Additionally, this was a fourth consecutive week that bearish sentiment has risen; the longest such streak since four weeks of increases during the bear market from the weeks of February 20th through March 12th.

Sentiment has been increasingly less in favor of the bullish camp over the past few weeks, but this week marked the first time since the week of October 15th that bullish sentiment was outweighed by bearish sentiment.

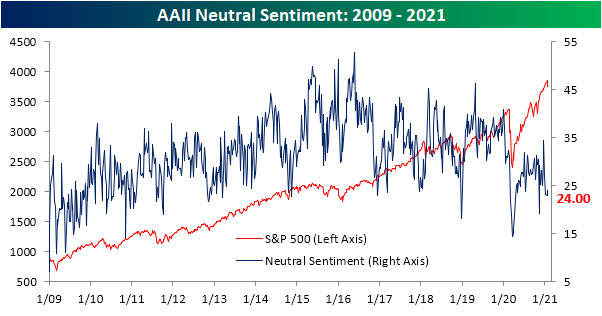
Not all of the losses to bullish sentiment went to bears though. Neutral sentiment was likewise higher with 24% of respondents reporting as such. While higher, that is still below where the reading has stood for most of the past year. Click here to view Bespoke’s premium membership options for our best research available.
B.I.G. Tips – The Greatest Squeeze on Earth
Improvements Resume for Jobless Claims
For the second week in a row, initial jobless claims showed an improvement. Rather than the decline to 875K that had been penciled in by economists, first-time claims fell to 847K from 914K last week. Claims have now fallen 80K since the multi-month peak two weeks ago but are still 136K above the pandemic low of 711K from the first week of November.

On a non-seasonally adjusted basis, claims likewise were lower falling by 101.5K to 874K. Similar to the seasonally adjusted number, while off the peak, that is still well above the pandemic lows from the fall. Additionally, we would note that like last week (the third week of the year), the current week of the year (fourth) has rarely seen non-seasonally adjusted claims move higher. In the history of the data going back to 1967, only 9% of years have seen claims rise week over week in the fourth week of the year.

Last week, we noted how the decline in regular state claims was not necessarily shared by claims for Pandemic Unemployment Assistance (PUA). This week, the two moved more in sync as more than 100K decline in regular state claims was accompanied by a 20.5K decline in PUA claims. Combined, that makes for 1.3 million new claims this week; an improvement from the prior week but not as strong of a number as the start of the year/final weeks of 2020.

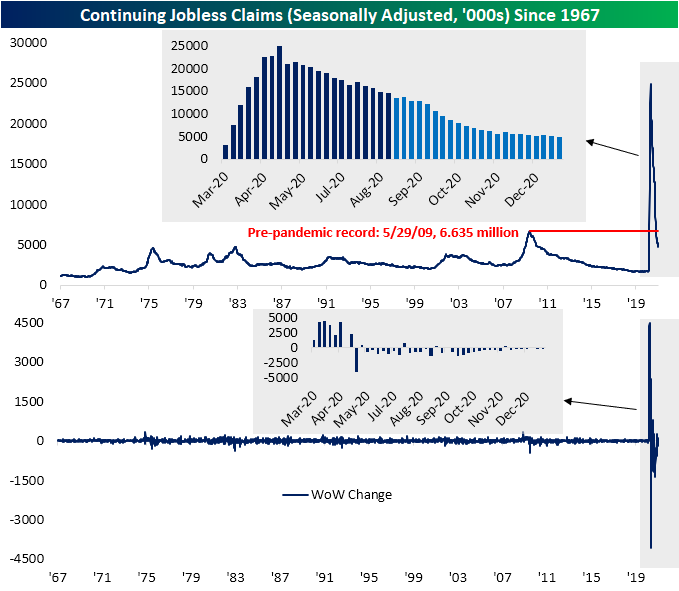
As for continuing claims, there have continued to be improvements as seasonally adjusted claims fell to 4.771 million rather than the 5.088 million reading that was expected. Last week’s reading was also revised lower from 5.054 million to 4.974 million. That means that total continuing claims fell below 5 million last week for the first time since March and stayed below 5 million in the most recent week.
Including all other programs to garner a more complete picture of continuing claims adds a couple of weeks of lag to initial jobless claims data meaning the most recent week is for the week of January 8th. The surge in initial jobless claims for that week showed up as total continuing claims across all programs rose from 16.022 million in the first week of the year to 18.319 million. That was the first uptick of any kind since the week of November 27th when they rose by 1.6 million, and it was also the largest week over week increase since the week of May 8th when they rose by 3.793 million. The bulk of that uptick came from PUA claims which rose 1.627 million, but PEUC claims and the extended benefits program also saw increases of 836.6K and 96.04K, respectively. As we have noted in the past few weeks, those upticks were likely the result of catch up from the end of 2020 as expirations of some of these programs were narrowly avoided with the signing of the spending bill. Click here to view Bespoke’s premium membership options for our best research available.


Chart of the Day – VIX Fixed Above 20
Bespoke’s Morning Lineup – 1/28/21 – Differing Options
See what’s driving market performance around the world in today’s Morning Lineup. Bespoke’s Morning Lineup is the best way to start your trading day. Read it now by starting a two-week free trial to Bespoke Premium. CLICK HERE to learn more and start your free trial.
“There is nothing new in Wall Street. There can’t be because speculation is as old as the hills. Whatever happens in the stock market to-day has happened before and will happen again.” – Edwin Lefevre, Reminiscences of a Stock Operator
After some of the individual stock moves we have seen in the last few days and continue to see this morning, it seems odd to see futures for the S&P 500 only modestly lower. The pace of earnings season has really started to pick up steam in the last 24 hours, and the next 24 hours will be busy as well. So far, companies have been reporting strong results, but given the run-ups we’ve seen in stocks leading up to the reporting period and the high level of expectations, it’s not too surprising to see investors selling the news.
As if all the earnings news wasn’t’ enough to deal with, there’s also a tone of economic date to navigate through over the next two days as well, including today’s releases of Jobless Claims, Q4 GDP, Leading Indicators, New Home Sales, and the KC Fed report.
Be sure to check out today’s Morning Lineup for updates on the latest market news and events, earnings reports from around the world, Economic data out of Europe, an update on the latest national and international COVID trends, and much more.

Yesterday was an interesting day in the market. Interesting may be an understatement, but our point is that while the S&P 500 was down just over 2.5%, the upward move in the VIX was suggestive of a much larger downside move. The VIX’s massive upside move of 14.2 points Wednesday was the 17th day in the index’s history that it jumped ten or more points in a single day. On those days, the S&P 500’s average decline was 6.27% (median: 5.89%). Of those 17 days, yesterday’s 2.57% decline ranks as the smallest decline of them all. Even on the days where the VIX rose by less than it did yesterday but was still up more than 10 points, the S&P 500’s median decline was 5.28%. The smallest one-day decline of those days was -3.5% – nearly a full percentage point more than Wednesday’s decline. Based on the S&P 500’s performance on prior days where the VIX had a large one-day increase, yesterday there was a disconnect between sentiment in the market and the options market.
