Extended Benefits Expand
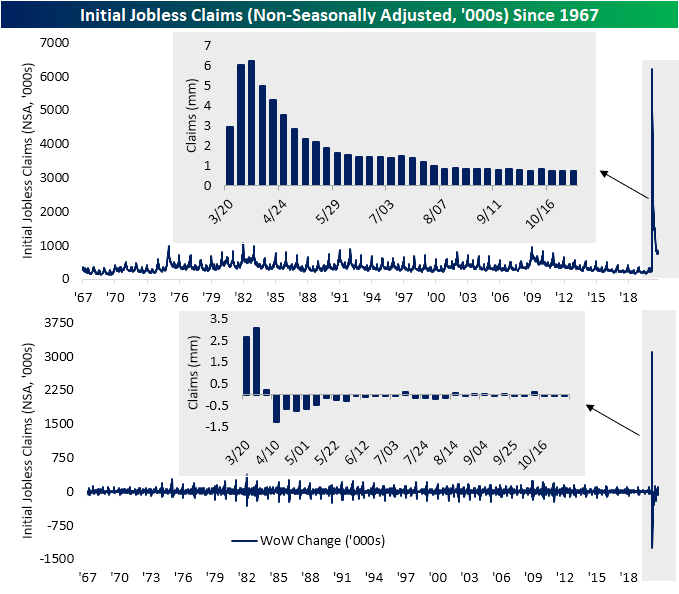
Initial jobless claims for the final week of October came in at another pandemic low at 751K. That would have been unchanged from the previous week’s number, but that was revised up 7K to 758K. Regardless of that revision higher, initial claims have declined for three straight weeks although the pace of decline has been slowing. Given this week’s decline was comparably small to recent weeks, this morning’s release did miss estimates calling for a level of 735K.

On a non-seasonally adjusted basis, initial claims were pretty flat only falling 0.5K to 738.2K. That established a slightly lower post-pandemic low and marked the 14th consecutive week that initial claims have come in below 1 million.
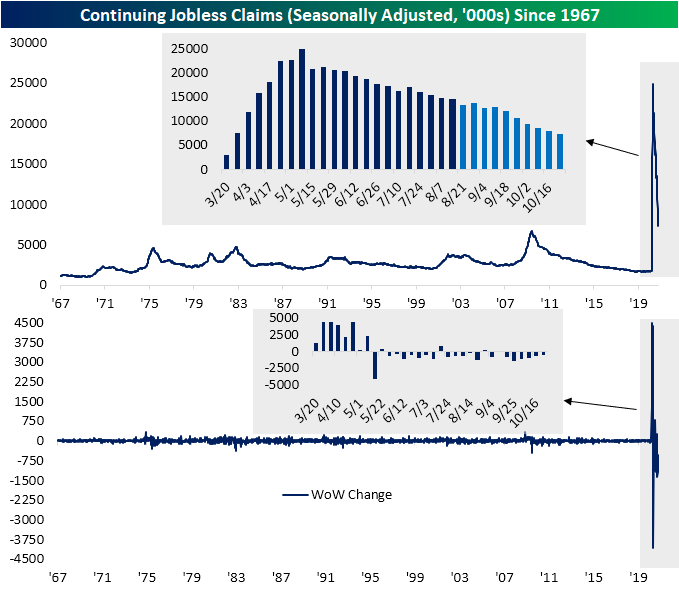
Continuing claims data is released at a one week lag to initial claims, and last week’s sizable decline led continuing claims to also reach a new low for the pandemic. At 7.285 million, it was still above estimates of 7.2 million. Continuing claims have now fallen for 7 of the past 8 weeks, and the one week where they didn’t drop, they were unchanged.
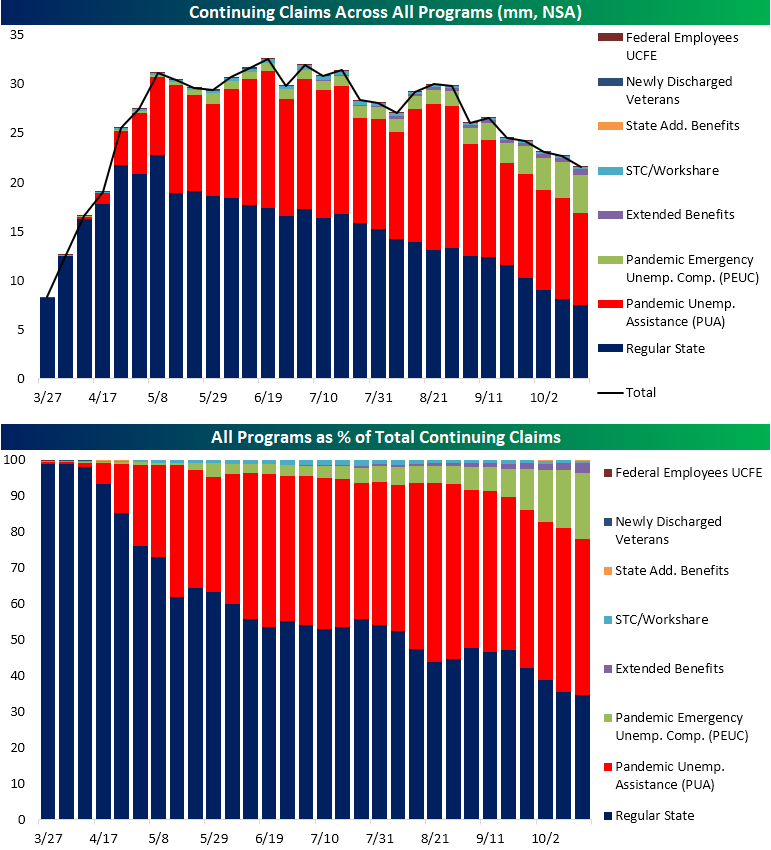
Including Pandemic Unemployment Assistance (PUA) to get a more complete picture, the declines in regular state initial claims have been slightly offset by rising PUA claims. Total initial claims (PUA plus regular state claims) were up this week from 1.098 million to 1.101 million meaning claims continue to hover around 1.1 million as has been the case over the past month. Whereas regular state claims have fallen for three straight weeks with a total decline of 91.5K, PUA claims have risen for three straight weeks totaling 25.66K.

Although inflows to the unemployment insurance system have been stable at around 1.1. million, on net, the number of people receiving benefits has continued to fall. In the charts below, we show the total count (in millions) of continuing claims across all programs. The data is lagged yet another additional week to regular state claims. As of the week of October 16, total continuing claims reached 21.6 million which is the lowest level in seven months. Claims have now fallen in seven of the last eight weeks with regular state claims and PUA claims (the two largest contributors) driving those declines. On the other hand, extended benefit programs for those who have seen their insurance expire like Pandemic Emergency Unemployment Compensation and regular state extended benefits have been on the rise. These two measures are at new highs in terms of both the number of claims and their share of total claims. That means that despite an overall improvement in the number of people on unemployment, there is a growing share that have been unemployed for an extended period of time. Click here to view Bespoke’s premium membership options for our best research available.
Emerging Markets Cheering a Potential Biden Win
The US equity market has seen a massive rally in reaction to what is looking like a Biden victory over President Trump coupled with the Republican party maintianing its majority in the US Senate. None of these results are official at this point, so they are subject to change, but these are the most likely scenarios as of now. Outside of the US, emerging markets have also rallied. In just the last two days, the MSCI Emerging Market ETF (EEM) has rallied 5% and broken above resistance to new 52-week highs. If for no other reason then Biden’s campaign slogan isn’t America First, the rationale behind the rally makes some sense.

The reaction of EEM in the aftermath of this election is very much different from what happened in 2016. Heading into the 2016 election, EEM had been trending higher, but pulled back in the days leading up to the election and broke its uptrend that had been in place since earlier in the year. Again, Trump’s America First approach was understandably viewed as a headwind to emerging market equities.

While the initial reaction of EEM to Trump’s election was negative, that weakness didn’t last long. The chart below shows the performance of EEM in the two months before and one year after the 2016 election. The gray box represents the same period shown in the chart above. Within days after breaking its uptrend after the 2016 election, EEM bounced back, rallied to its 50-DMA, tested its November low, and then in the early days of 2017 it was off to the races as EEM. In fact, even accounting for the post-Election Day declines, one year after the 2016 election, EEM was up 25% which was actually more than the 21% return for the S&P 500! The moral of the story here is that first reactions aren’t always the right reactions, and as an investor it’s not just imperative to know the environment you are operating in, but also when the tides are turning. Click here to view Bespoke’s premium membership options and unlock instant access to our research and interactive tools.

Bespoke’s Morning Lineup – 11/5/20 – Groundhog Day
See what’s driving market performance around the world in today’s Morning Lineup. Bespoke’s Morning Lineup is the best way to start your trading day. Read it now by starting a two-week free trial to Bespoke Premium. CLICK HERE to learn more and start your free trial.
“Information is not knowledge.” – Albert Einstein
When you turned on your TV to one of the financial networks or cable news channels this morning that wasn’t your DVR showing yesterday’s news. The election still hasn’t been decided and equities are once trading sharply higher. Over the course of the last 24 hours, not much has really changed. The path for the President is looking increasingly narrow, and markets seem to be content with the prospect of gridlock.
In economic news, both initial and continuing jobless claims came in modestly higher than expected. Non-farm productivity was a bit weaker than expected, and Unit Labor Costs were less bad than forecast. While it was easy to overlook given all the other news, don’t forget that there is also an FOMC decision this afternoon!
Be sure to check out today’s Morning Lineup for a rundown of the latest stock-specific news of note, election analysis, trends related to the COVID-19 outbreak, and much more.

After the worst pre-election week for the S&P 500 in its history last week, it only makes sense that the S&P 500 would be on pace for one of its best-ever election week performances on record. It is 2020 after all! With futures indicating a 1.5% gain at the open, the S&P 500 is on pace for its second-best election week performance since 1928. To find the best election week performance for the S&P 500 on record, you have to go all the way back to 1932 when FDR won in a landslide.
An interesting trend to note about recent election cycles is that they have become increasingly volatile. Going back to 1996, the S&P 500’s average percentage move the week before Election Day has been a move of +/-3.6%. That’s more than twice the average pre-election move of the prior 17 election cycles going back to 1928. Similarly, the S&P 500’s average election week performance has been a gain or loss of over 4%. Likewise, that’s also just about twice the prior average of election cycles spanning 1928 to 1992!
With all the information investors have had at their fingertips in the last 25 years, you would expect that it would dampen volatility in reaction to big events like elections, but the data of the last 25 years since Netscape – the first mainstream internet browser – was launched shows a much different outcome. Information is often confused with knowledge, but as Einstein succinctly put it, the two aren’t the same.

Services Dip
Whereas Monday’s manufacturing release of the ISM report for the month of October exceeded estimates and continued to rise to new highs for the pandemic, this morning’s service sector report was weaker. The release was anticipated to show a slight decline, falling to 57.5 from 57.8 last month. Instead, that decline was even larger with the headline number dropping to 56.6. That is the lowest level of the index since May, and while it is still indicative of expansionary activity, it was at the slowest rate of the recovery. That has led the composite of the manufacturing and non-manufacturing readings to similarly be a bit on the weak side, falling from 57.5 to 56.9. Again this is consistent with overall growth versus last month, but at a slower rate.

Given the headline number’s decline, breadth in this month’s report was a bit weak. Just six of the ten sub-indices were higher this month. Despite this, every index remains in expansion with those for Inventories and Import Orders actually exiting contraction.

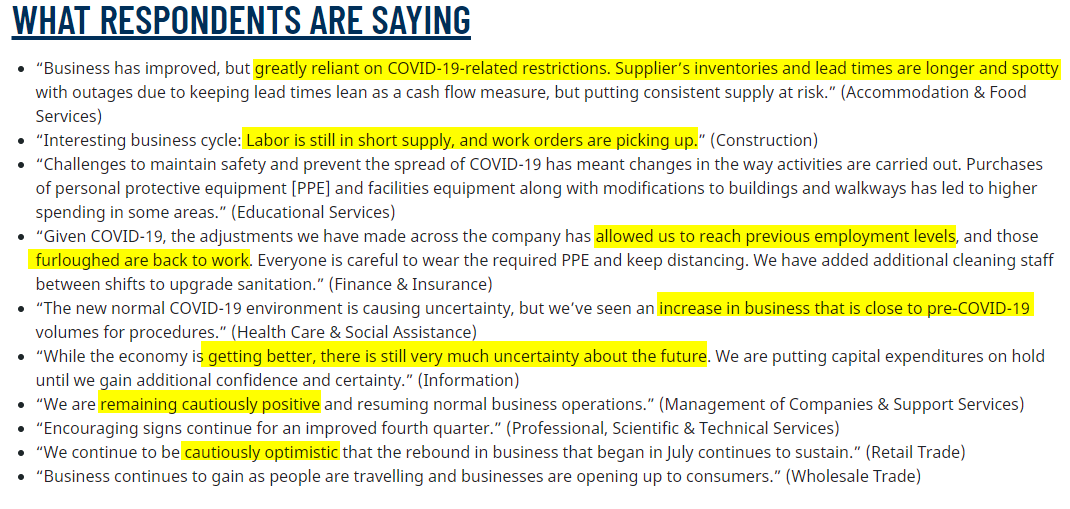
Broadly speaking, the survey showed that conditions have continued to improve but at a slowed pace in October. Given this, the key phrase of the commentary section seemed to be “cautiously optimistic”. Multiple comments made mention that business has gotten better with solid demand and workers coming back, but uncertainty has persisted.
New Orders have continued to grow, but at a slowed pace as the corresponding index fell 2.7 points to 58.8 in October. Unlike the same index for the manufacturing survey which is at multiyear highs, the services index for new orders is in the middle of its historical range. On the other hand, given orders have continued to rise, backlogs have also continued to rise. The index for Backlog Orders rose 4.3 points to 54.4 which is the highest level since the summer.

As demand sits at solid levels, Inventory Sentiment remains historically low. That index fell to 51.1 in October which is the third-lowest level since 1997 behind July and March. In other words, very few businesses are reporting that inventories are too high. Despite this, the index for Inventories actually indicated that inventory levels grew in October as the index rose to 53.1. That compares to a reading of 48.8 last month which is consistent with drawdowns in inventory levels.

Employment experienced its first expansionary reading of the pandemic in September, but in October hiring appeared to slow as the index fell to 50.1. Although that is still indicative of net hirings, it shows that businesses were slower to bring in/back workers. Click here to view Bespoke’s premium membership options for our best research available.

Chart of the Day – Was it the Election or Something Else?
Bespoke’s Morning Lineup – 11/4/20 – Stay Tuned!
See what’s driving market performance around the world in today’s Morning Lineup. Bespoke’s Morning Lineup is the best way to start your trading day. Read it now by starting a two-week free trial to Bespoke Premium. CLICK HERE to learn more and start your free trial.
“The poll that matters is the one that happens on Election Day.” – Heather Wilson
Americans were expecting a wild election night, and that’s exactly what we got. Heading into the results, it was Biden’s election to lose. As early state results came in the odds skewed heavily towards Trump, but overnight and early this morning the odds started to turn in Biden’s favor where they remain now. With all the uncertainty, you would guess that futures would be trading lower, but they’re up across the board with the Nasdaq leading the way. Republicans holding onto the Senate makes the reflation trade less attractive, and that is pushing down interest rates and pushing growth stocks higher.
In economic news, the Employment picture turned a little darker as the ADP Private Payrolls report for October missed expectations by a wide margin as the economy created just 365K jobs compared to expectations for growth of 634K.
Be sure to check out today’s Morning Lineup for a rundown of the latest stock-specific news of note, market performance in the US and Europe, some election analysis, trends related to the COVID-19 outbreak, and much more.
With the outcome of the election uncertain and legal challenges looking increasingly likely, we are immediately reminded of the uncertainty that surrounded the aftermath of the 2000 election. Most of us remember how poorly the market traded during that period, but in the chart below we show the intraday chart of the S&P 500 in the three days that followed the election. In those three days, the S&P 500 traded down more than 4.5%. What’s interesting to note is that in the opening minutes of trading the day after Election Day, the S&P 500 actually opened the day higher before sellers stampeded in.
This will be a key indicator to watch in trading today. Futures are currently firmly in positive territory this morning, and much more positive than they were in 2000 the day after that election. If those early gains can hold, a nightmare scenario of November and December 2000 will look increasingly less likely.

Winners and Losers During Trump’s Presidency
With Election Day upon us, below we take a look at the biggest winners and losers across financial markets during the Trump Presidency from Election Day 2016 through today. First off, below is a chart of the market cap of the Russell 3,000 since Election Day 2000 which George W. Bush eventually won. The Russell 3,000 makes up more than 98% of the total US equity market cap, so it’s a good gauge to use for measuring the overall change in market cap levels. The current market cap of the Russell 1000 is just north of $35 trillion, which is up $11.5 trillion since Election Day 2016. President Obama oversaw US market cap growth of $12.3 trillion over his two terms, while President Bush actually saw market cap decline by $4.1 trillion after his two terms.

Below is a look at the total return of various asset classes since Election Day 2016 using key ETFs listed on US exchanges. The S&P 500 (SPY) is up 70.6% since Trump was elected, while the Nasdaq 100 (QQQ) more than doubled that at +144.3%. Of the broad index ETFs in the matrix, the Smallcap Value ETF (IJS) is up the least since Election Day 2016 at just +17.2%.
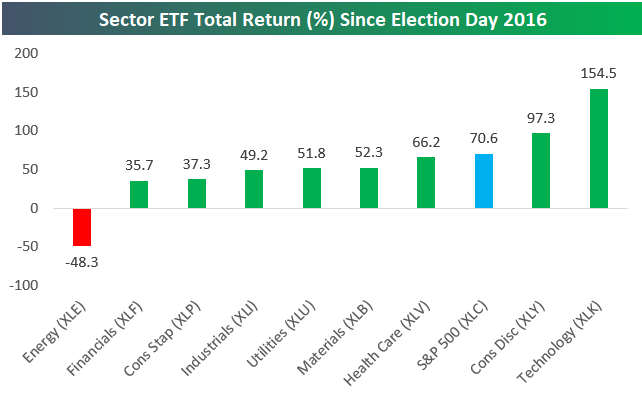
Looking at US sector ETFs, the Energy sector (XLE) is a huge outlier with a decline of 48.3% since Trump was elected. Technology (XLK) and Consumer Discretionary (XLY) are up the most with gains of 154% and 97%, respectively.
Along with Energy stocks, the oil (USO) and natural gas (UNG) ETFs have been more than cut in half since 11/8/16, while gold (GLD) is up 47% and silver is up 29.5%.

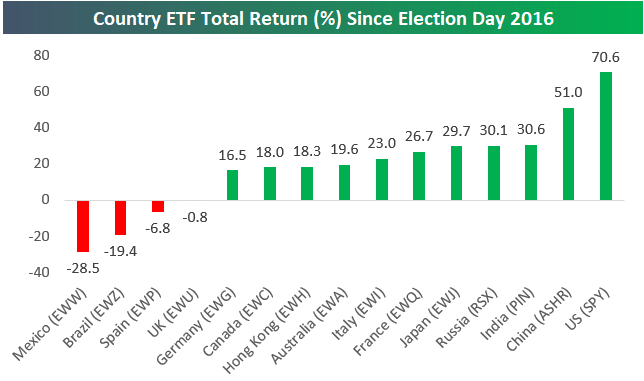
Not every country has seen stock market gains since Trump was elected. As shown below, Mexico (EWW) is down 28.5%, Brazil (EWZ) is down 19.4%, Spain (EWP) is down 6.8%, and the UK (EWU) is just slightly in the red.
The US (SPY) is up more than any other country with a gain of 70.6%, while China (ASHR) is up the second most at +51%. Whatever happened with the trade war certainly didn’t hurt the US and China versus the rest of the world on a relative basis.
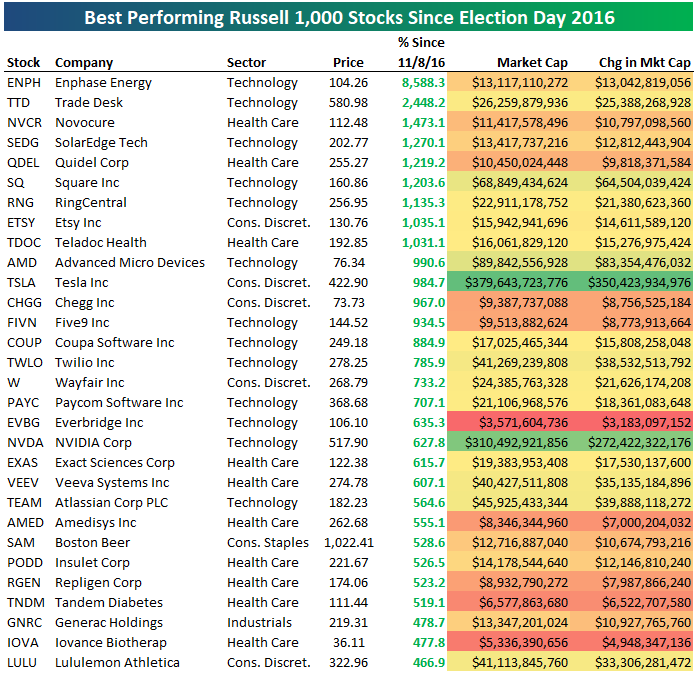
Within the Russell 1,000 in its current form, there are nine stocks that are up 1,000% or more since Election Day 2016, with Enphase Energy (ENPH) at the top with a gain of 8,590%. Trade Desk (TTD) is up the second most at +2,448%, followed by Novocure (NVCR), SolarEdge Tech (SEDG), and Quidel (QDEL). Square (SQ) ranks sixth with a gain of 1,203%. Other notables on the list of big winners since Trump was elected include Etsy (ETSY), Teladoc (TDOC), Tesla (TSLA), NVIDIA (NVDA), Atlassian (TEAM), Boston Beer (SAM), and Lululemon (LULU).
In terms of market cap gains for individual stocks, the numbers below are quite eye-popping. Apple (AAPL) has gained the most in market cap since Trump was elected with an increase of $1.257 trillion! Amazingly, both Amazon (AMZN) and Microsoft (MSFT) have added more than $1 trillion in market cap as well. Prior to the last few years, no company was even close to having a $1 trillion market cap, but at this point, AAPL, AMZN, and MSFT have gained that much in the last four years. Click here to view Bespoke’s premium membership options for our best research available.

World Market Caps Since the 2016 Election
In the table below, we show the standings of 35 global stock markets as a percentage of total world stock market cap. The US is still by far the largest stock market, and it is not even close, accounting for over 40% of total world market cap. China is the only other country to make up a double-digit share of world market cap. For the US, its share of global market cap has grown 1.55 percentage points since the start of the year. Only China has gained a larger share in 2020, rising 2.78 percentage points.
With the election underway, we also wanted to take a look at how this has changed during President Trump’s tenure. As shown, just like this year, since the last election, world market cap has consolidated into the US and China. Back in November of 2016, the US and China accounted for 36.53% and 10.21%, respectively, compared to 41.07% and 11.22% today. For the US, that 4.5 percentage point gain in share of world market cap is by far the largest, and China’s gain was actually not the runner up. Saudi Arabia holds that spot with a share that has risen over 2 percentage points. That outsized gain is thanks to the IPO of Saudi Aramco, one of the world’s largest companies, just under one year ago. On the other hand, the UK and Japan have lost disproportionately large shares in the same time frame. Click here to view Bespoke’s premium membership options for our best research available.
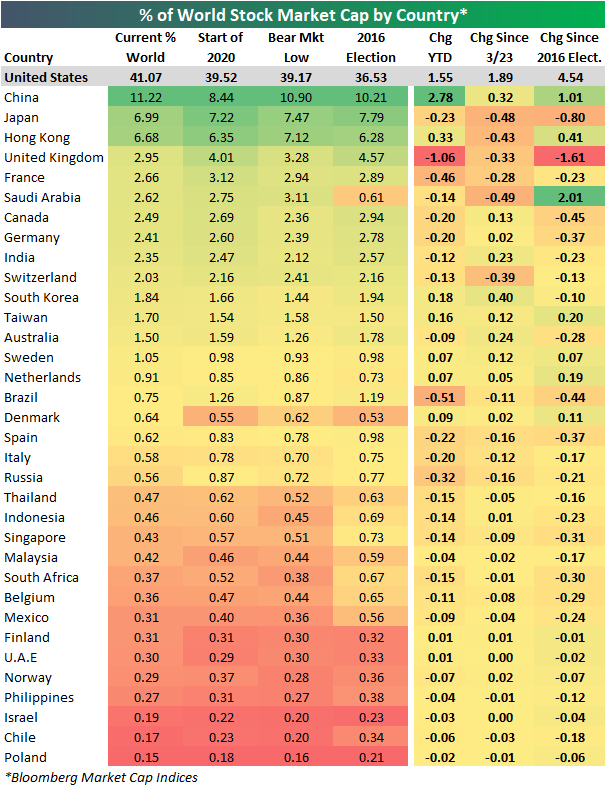

Chart of the Day – Years Like 2020 – The Final Stretch
Eurozone’s Late October Surprise
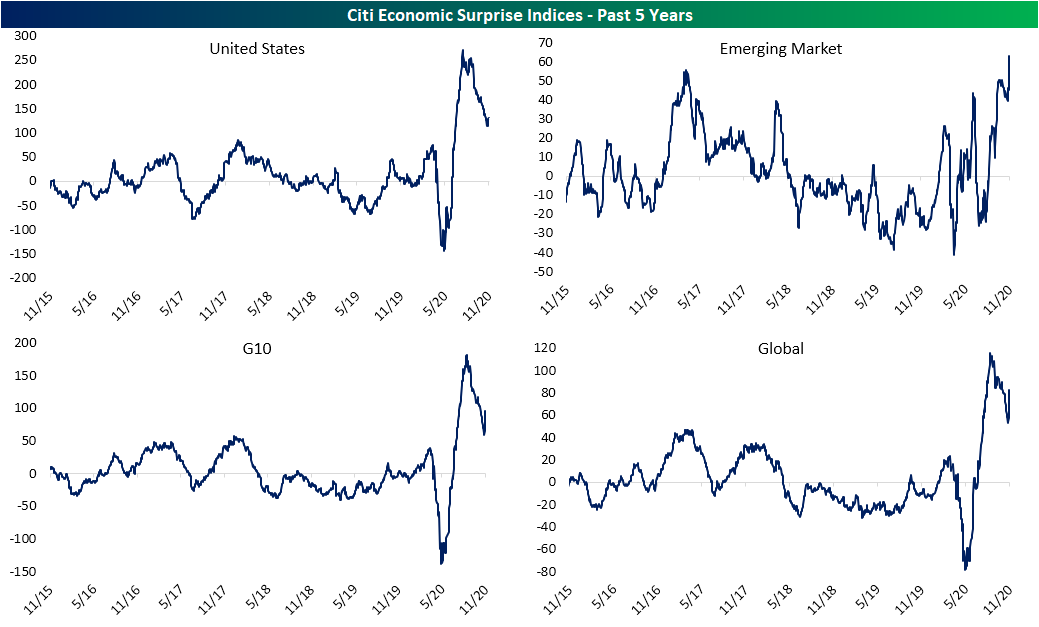
As we noted last week, while earnings beat rates are historically high, economic data is still consistently coming in better than forecasts, but the beats are not as dramatic as they were in the spring/early summer. In the charts below, we show the Citi Economic Surprise Indices for the US and some other regions of the world. Higher readings point to data being better than forecasts and vice versa. At current levels, the US index is down significantly from its July highs and continues to head lower, but it is still well above any readings seen prior to the pandemic. Meanwhile, Emerging Markets data never spiked in the same way the US did, but it has been on the rise recently reaching its highest level in over a decade in the past few days. Of all daily readings, there have only been five other days that the index was higher than Friday’s reading of 63.1. For G10 countries and the global index, trends more closely resemble the US with one caveat. Late last week the indices saw another big turn higher.

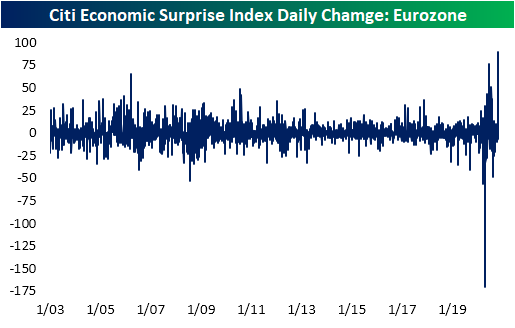
The reason for that jump was the Eurozone. As shown in the charts below, over the past few months the index was headed lower approaching zero, meaning the region’s economic data was not beating forecasts in the same way that the rest of the world has. But that is not so much the case now thanks to a big beat for GDP last Friday which likely holds a massive weight on the index. That resulted in the index to jump by the most ever in a single day. The index rose 89.9 points compared to the historical absolute median daily change of just 3.8 points. That single day move was even larger than any of the readings from the rebound in the more immediate aftermath of the worst days of the pandemic.

Despite deteriorating COVID conditions, new lockdowns, and plenty of other worrisome factors, European equities have seemed to have received a bit of a boost coincident with the turnaround in the economic surprise index. Last week the Stoxx 600 fell below support and out of the past several months’ range, but after reaching extremely oversold levels, the index began to turn higher on Friday. Click here to view Bespoke’s premium membership options for our best research available.
