Mid-Caps Moderate
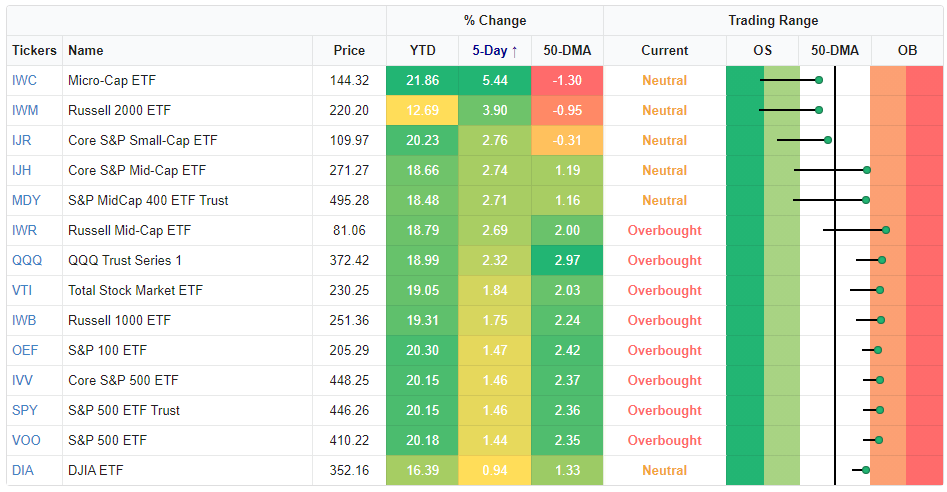
To round out the month of August, the major indices are slightly lower on the day. Overall, in the final week of the month, small caps like the Micro-Cap ETF (IWC) and Russell 2000 (IWM) have generally outperformed although they are coming from below their 50-DMAs, and yesterday they saw a reversal lower. Large caps have posted smaller gains but are reaching new record highs. The price action of mid-caps, on the other hand, has been a mix of small and large caps. Mid-caps, like the S&P MidCap 400 ETF (MDY) and Core S&P MidCap ETF (IJH), are broadly overbought and have also posted solid gains in the past several days of around 2%. Additionally, whereas this week they are on the cusp of extreme overbought territory, last week those same ETFs were still within one standard deviation of their 50-DMAs.

While mid-caps have made a solid move higher over the past five days, like small-caps, they have pivoted lower in the past couple of sessions. From a charting perspective, those moves lower also come right as IJH and MDY made a run at their highs from the final days of April. Having rejected that resistance, there is the potential for nearby support around the highs from earlier this month and early June and then the 50-DMA below that. Click here to view Bespoke’s premium membership options.


Chart of the Day – Air Passenger Traffic: COVID or Seasonal?
S&P 1500 States of Domicile
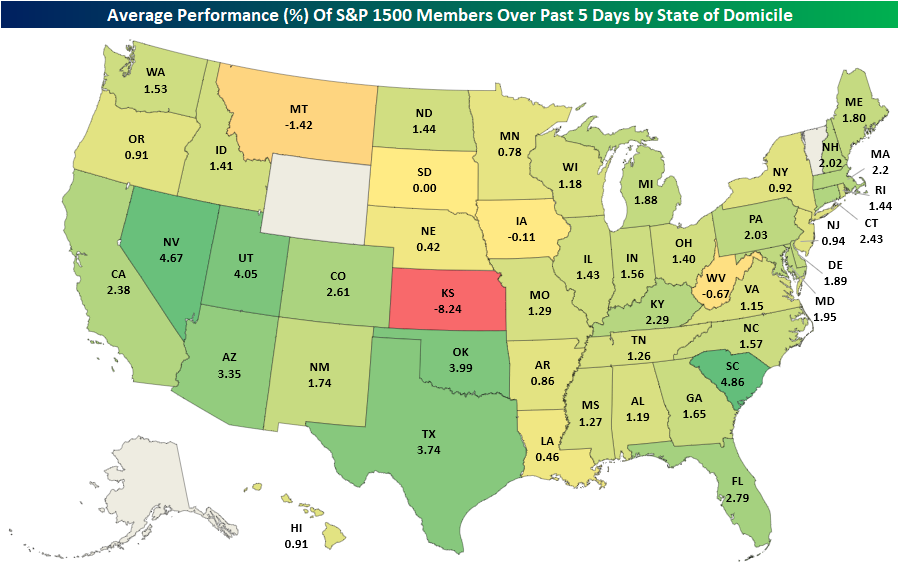
It’s hurricane season and leading the news to start the week has been the landfall of Hurricane Ida on the 16-year anniversary of Hurricane Katrina. In today’s Morning Lineup, we detailed the initial impact of the storm on what will likely be the most impacted sector: energy. As could be expected with a regionally focused event, equities are largely shrugging things off with the S&P 500 and Nasdaq both solidly higher and reaching new records today. As for a more particular look, in the heatmap below, we show the average five-day performance of S&P 1500 stocks based on their state of domicile.
Obviously, this is not an exact read-through of a stock’s geographic exposure—for example, a company may be headquartered in one state, but the bulk of its business is based in others—but Louisiana based equities have, on average, actually seen worse performance than neighboring states or the country more broadly. Of the average performance of stocks domiciled in the 48 applicable states plus DC (no S&P 1500 companies are domiciled in Alaska, Wyoming, or Vermont), Louisiana-based stocks rank as the eighth-worst performers over the past five days. The absolute worst state, though, has been Kansas, but that is primarily due to an over 36% decline in SelectQuote (SLQT). Admittedly, this is an imperfect measure of a company’s geographic exposure, and individual stories related to each specific business are of greater importance than where each company is domiciled. it is interesting to note that S&P 1500 companies domiciled in Louisiana have underperformed the broader market in the past week.
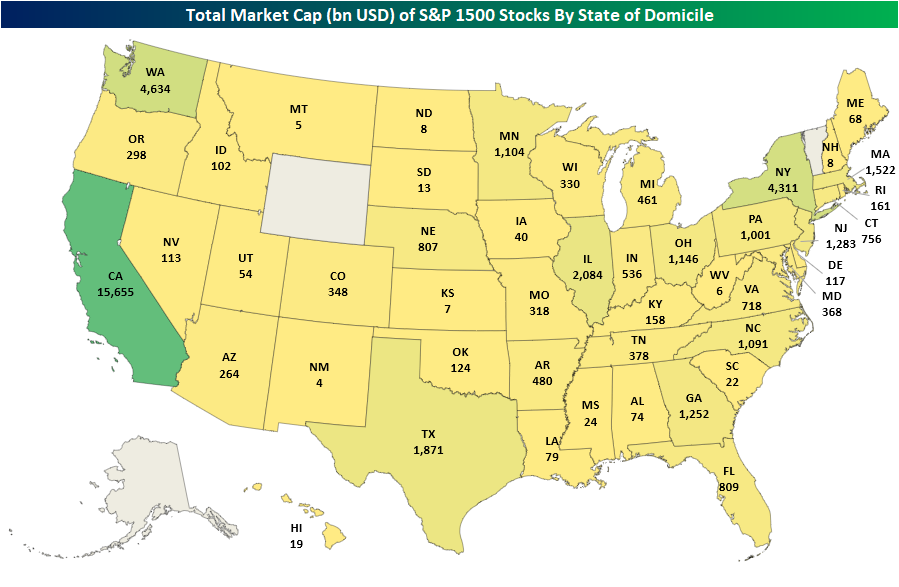
When looking at average performance, we would also caution that various states have dramatic differences in the actual number of stocks domiciled within each state. For example, there are just seven S&P 1500 companies domiciled in Louisiana, and their combined market cap is only $79 billion. That compares to neighboring Texas with 130 stocks that have a total market cap of $1.8 trillion. It also pales in comparison to California’s 223 stocks with a combined market cap above $15.5 trillion. So again, holding constant any more systemic or lasting effects of the storm, looking purely at where stocks are domiciled does not imply Hurricane Ida would necessarily have a massive impact on broad swathes of the market. Click here to view Bespoke’s premium membership options.

Dallas Fed Flops
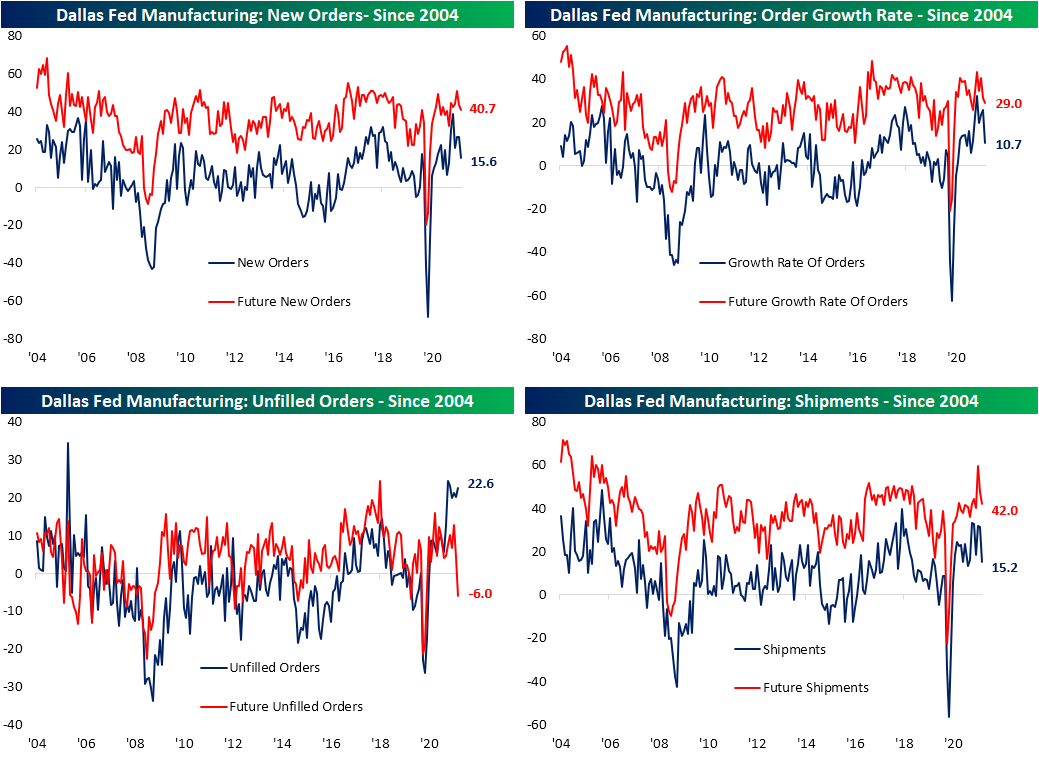
Leading into today, the four already released results from regional Fed banks’ monthly manufacturing reports broadly showed a material slowdown in activity in August which we showcased in the most recent update of our Five Fed Manufacturing Composite in last week’s Bespoke Report. The fifth and final report out of the Eleventh District added more confirmation to that slowdown with its release this morning. The Dallas Fed’s headline index peaked back in April at 37.3 and has declined each consecutive month since then including in August. In fact, this month’s decline was by far the most severe as the indicator dropped 18.3 points versus only 3.8 point declines the prior two months and a 2.4 point decline in May. The 18.3 point decline month over month also ranks as the eighth largest MoM decline on record and the largest since last March when it fell by a record 70.4 points. Another decline had been penciled in this month with the index forecasted to fall from 27.3 to 23, but the drop to 9 made for the eleventh biggest miss versus expectations since at least 2009.

Looking across the various categories of the report, declines were broad across categories with only unfilled orders, inventories, hours worked, and prices paid higher relative to July. Those declines are largely coming off of historically strong readings, though, with many in the top decile of their historical range last month. Even after falling, every category is still above their historical median readings with many still in the upper deciles. In other words, manufacturing activity slowed but remains at solid levels.

Order growth and shipments are the areas to have seen the greatest moderation over the past few months. In August, these indices all saw some of the largest declines in point terms and are now much less elevated than other readings. For example, new orders are only in the 72nd percentile and Shipments are only in the 65th. Those declines leave the indices at similar levels to the start of this year. Again, the declines in these indices do not mean activity is contracting, but rather is decelerating meaning orders are still growing at a healthy level. One example of this is unfilled orders. With order growth at a solid clip, unfilled orders actually ticked higher, remaining at unprecedentedly high levels. We would also note, while businesses reported order backlogs are continuing to grow at historic rates, they do not foresee that to remain the case. Expectations for the category dropped into negative territory this month (the only reading across current conditions and expectations to do so).
Prices and supply chains also appeared to have gotten some relief in August and could be playing a role as to why businesses appear optimistic to work off order backlogs. While still right around record highs, prices received and delivery times were both lower. Unfortunately, while customers saw some price relief, prices paid were slightly higher. Meanwhile, Inventories are starting to grow again as the index rose 12.9 points to go back into positive territory for the first time since March 2019.

Employment-focused categories were a somewhat dour point of the survey. Readings on Employment and Wages & Benefits were both lower in August which was met with a decline in capital expenditures. On the bright side, current readings are still at healthy levels and the expectations index for wages and benefits actually hit a record.

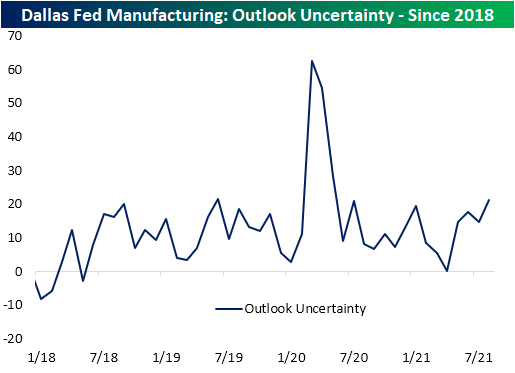
One other point to watch is uncertainty. The Dallas Fed’s reading on uncertainty does not have much in the way of an extensive history, only dating back to the start of 2018, but the index did rise to 21.1 as COVID cases rose through the summer. Those levels are well below the highs reached earlier in the pandemic, but are once again at the upper end of the past few years’ range. Click here to view Bespoke’s premium membership options.
Bespoke Brunch Reads: 8/29/21
Welcome to Bespoke Brunch Reads — a linkfest of the favorite things we read over the past week. The links are mostly market related, but there are some other interesting subjects covered as well. We hope you enjoy the food for thought as a supplement to the research we provide you during the week.
While you’re here, join Bespoke Premium with a 30-day free trial!
Collectibles
Al Capone’s Last Haul: The Gangster’s Family Auctions His Mementos by Richard Morgan (WSJ)
A huge batch of pistols, pocket watches, and other curios like a silver-plated cocktail shaker owned by the gangster are set to hit the auction block. [Link; paywall]
Labor Markets
Driver recruitment wars: Cowan to pay $20,000 sign-on bonus by Todd Maiden (Freight Waves)
With huge demand for freight services, drivers are an extremely scare commodity and are driving a bidding war for CDL holders; sign-on bonuses are going as high as $20k. [Link]
Bad Reviews
Yelp Reviews Fuel Fights Over Covid-19 Vaccine Requirements by Charity L. Scott (WSJ)
Small businesses which opt to require vaccination for clients or customers are being mobbed by hordes of anti-vaccine trolls, which seek to drive down their ratings. [Link; paywall]
Supply Chains
Why Is the Supply Chain Still So Snarled? We Explain, With a Hot Tub by Austen Hufford, Kyle Kim and Andrew Levinson (WSJ)
A step-by-step walk-through of the thousands of parts and intricate assembly that goes into a hot tub, all of which has been snarled by delays and shortages across the entire global supply chain. [Link; paywall]
Exclusive-Ford doubles Lightning production target on strong pre-launch demand -sources by Ben Klayman and Joseph White (Street Insider)
Ford’s electric F-150 model is due for launch next year, and the company has seen reservations top more than 120,000. As a result, it’s targeting production of more than 80,000 by 2024 but only 15,000 next year. The contrast between total demand and what the company is planning to build is striking. [Link]
Investors
Yale Taps Matthew Mendelsohn to Succeed Endowment Chief David Swensen by Juliet Chung and Dawn Lim (WSJ)
Yale’s massive $31bn endowment will have new leadership to replace legendary investor David Swensen, who passed last May. [Link; paywall]
God, Money, YOLO: How Cathie Wood Found Her Flock by Matt Phillips (NYT)
A profile of the manager who has built a massive active ETF empire out of relentless optimism and business analysis that presses that optimism for all it’s worth. [Link; soft paywall]
COVID
Those Anti-Covid Plastic Barriers Probably Don’t Help and May Make Things Worse by Tara Parker-Pope (NYT)
Aerosolized COVID virus is best fought with air flow, not plastic barriers which prevent the turnover of air in a given space by blocking movement. [Link; soft paywall]
Weird News
Baby on cover of ‘Nevermind’ sues Nirvana alleging child pornography by Nadine El-Bawab (CNBC)
The infant baby who was used in the iconic cover of Nirvana’s album is suing on the grounds that the use of his image constitutes child pornography. [Link]
Read Bespoke’s most actionable market research by joining Bespoke Premium today! Get started here.
Have a great weekend!
The Bespoke Report – He Came, We Saw, Bulls Conquered
This week’s Bespoke Report newsletter is now available for members.
For several days, all the market could do was focus on the upcoming Jackson Hole speech from Fed Chair Jerome Powell. Will he signal in September or won’t he? Well the day finally came, and because the conference was changed from in-person to virtual, we all got to see the speech live on Friday morning. Powell didn’t say anything new, and since that followed a number of hawkish comments from other members of the committee, that was all bulls needed to conquer the day and push the S&P 500 to more record highs.
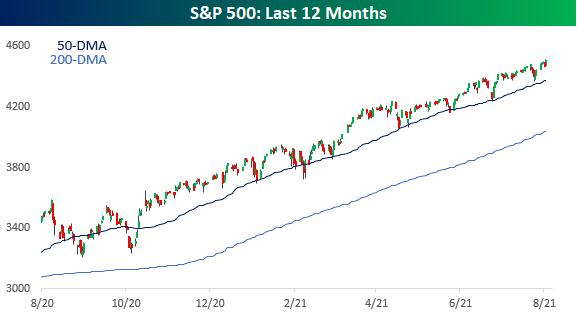
With the exception of last September and October, the S&P 500 has been in one of the steadiest uptrends ever. Tests of the 50-day moving average (DMA) are few, far between, and extremely short. Meanwhile, the S&P 500 is still maintaining ample social distance with the 200-DMA as that trend line shouts, “Remember me?”
In this week’s Bespoke Report, we cover a lot of different topics. Among them:
- A record number of records and Nasdaq 1,000 point milestones.
- A loot at some high-frequency COVID statistics,
- This week’s surge in crude oil and what it means for energy stocks going forward.
- A review of prior market responses to the GOMC Jackson Hole conferences.
- Bitcoin sentiment.
- Low volume rallies. Do they matter?
- The “Montana Curve”.
- Seasonality. And much more.
To read this week’s full Bespoke Report newsletter and access everything else Bespoke’s research platform has to offer, start a two-week trial to one of our three membership levels.


Small-Caps Bounce
ln today’s Morning Lineup, we noted the inverse correlation between performance this week and market caps. As shown in the major US Indices screen of our Trend Analyzer tool, the two best performers over the past five days have been Micro-Caps (IWC) followed by small caps like the Russell 2000 (IWM) and the Core S&P Small-Cap ETF (IJR). Mid-cap ETFs are the next best performers with high 2% gains then most large cap indices have only risen around 1.5% this week with the exception of the Dow (DIA) which has not even gained 1%. As for where these indices are trading relative to each one’s trading range, it is partially a mean reversion story. Small caps were deeply oversold one week ago and are now sitting just below their 50-DMAs. While not to as extreme of a degree, mid-caps were similarly trading a full standard deviation below their 50-DMAs last week. Today, they are on the opposite side of their 50-DMAs and on the verge of overbought readings.
As previously mentioned, small caps like the Micro-Cap ETF (IWC) and Russell 2000 ETF (IWM) were oversold last week. From a charting perspective, each of these indices’ rallies this week are not only bounces from extreme oversold levels, but they also follow brief dips below their 200-DMAs. But whereas the past five days have seen solid gains, yesterday saw IWC and IWM reject their 50-DMAs and the high end of their ranges that have been in place since late July. In other words, even though small caps have led the market this week, they are not out of the woods yet.


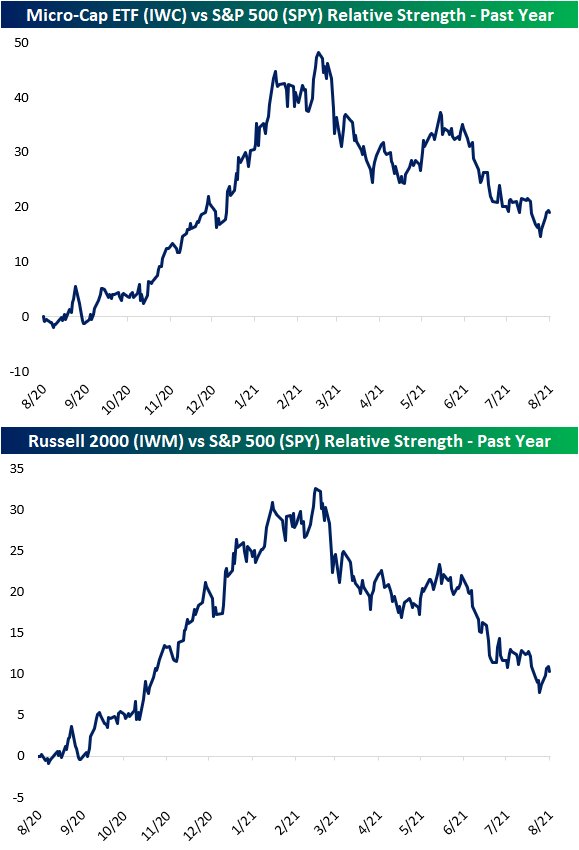
Looking at the relative strength lines of small caps like IWC and IWM versus the large cap S&P 500 (SPY) over the past year, the past week’s outperformance again is a blip on the radar and has only put a small dent in the longer term trend of underperformance.
Where that is not necessarily the case is small market caps versus the smallest market caps. As shown below, the relative strength line of the Micro-Cap ETF (IWC) versus the Russell 2000 (IWM) broke out of the past few months’ downtrend over the past few days. Click here to view Bespoke’s premium membership options.

Chart of the Day: SPAC Update
Bulls Head In Separate Directions
As the major indices have set more record highs in the past week, bullish sentiment has rebounded. The American Association of Individual Investors’ (AAII) weekly reading on bullish sentiment rose 6.4 percentage points to 39.4% this week. That is the highest reading of optimism since the week of July 8th when bullish sentiment was a hair above 40%. While recovered, that reading is still muted versus the past year’s range and is only 1.5 percentage points above their historical average. In other words, bullish sentiment has rebounded but is far from elevated.
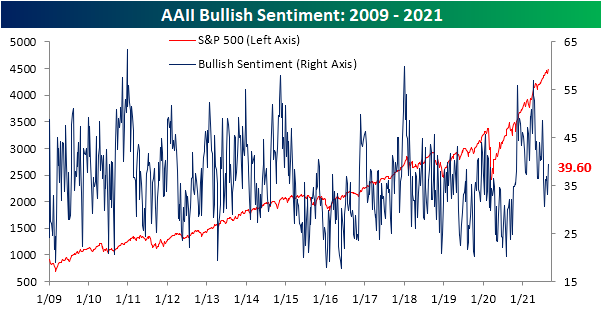
While the AAII survey showed an increase in bullish sentiment, another survey of newsletter writers from Investors Intelligence saw the opposite result. This survey’s reading on bullish sentiment dropped to just 50% this week which is the lowest level since May of last year. Although this reading has now fallen out of the past year’s range, it is still slightly elevated versus the historical average of 45%.

Given the uptick in bullish sentiment, the AAII survey saw only a third of respondents report as bearish versus 35.1% last week. Like bullish sentiment, this reading remains outside of the range it has occupied for most of the past year although that current reading is also not far away from the historical average of 30.5%.

As we noted in last Thursday’s Chart of the Day, the bull-bear spread dipped into negative territory last week for the first time since late January and it was at the lowest level since October 2020. With the inverse moves in bullish and bearish sentiment this week, the spread has moved back into positive territory to its highest level since the last week of July.

Not all of the gains to bullish sentiment came from the bearish camp. Neutral sentiment saw an even larger decline of 4.2 percentage points. That brings the reading down to 27.5% which is the lowest reading since April 15th when it stood at just 21.6%. Click here to view Bespoke’s premium membership options.

NSA Claims Break Below 300K
For the first time in four weeks, seasonally adjusted jobless claims came in higher with claims ticking up to 353K. Additionally, last week’s reading was also revised 1K higher to 349K. Albeit higher, this week’s print does remain at the low end of the range since the pandemic began and is less than 100K away from the March 13, 2020 level of 256K (the last print before claims rose into the millions).

It continues to be a point in the year that regular state claims have the benefit of seasonal tailwinds. The current week of the year has historically only seen claims rise week over week 16.7% of the time on a non-seasonally adjusted basis. This week, claims fell by 11.7K resulting in the first sub-300K print of the pandemic. While regular state claims were lower, PUA claims rose for a fourth week in a row even with the program’s expiration (September 5th) rapidly approaching. This week’s 9.63K increase was the largest of the past few weeks bringing PUA claims up to 117.71K. That is the highest level since the week of April 23rd.

Seasonally adjusted continuing claims were also disappointing this week. Last week’s print was revised higher by 45K to 2.865 million, and while this week’s number was lower at 2.862 million, it was worse than expectations for a decline to 2.72 million. Thanks to that higher revision, claims have now fallen for three weeks in a row and are once again at pandemic lows.
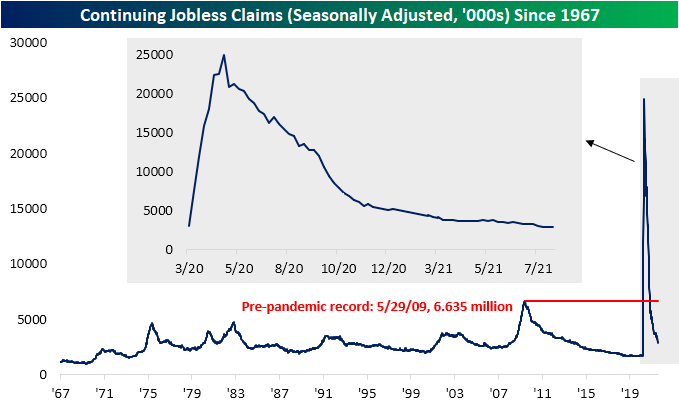
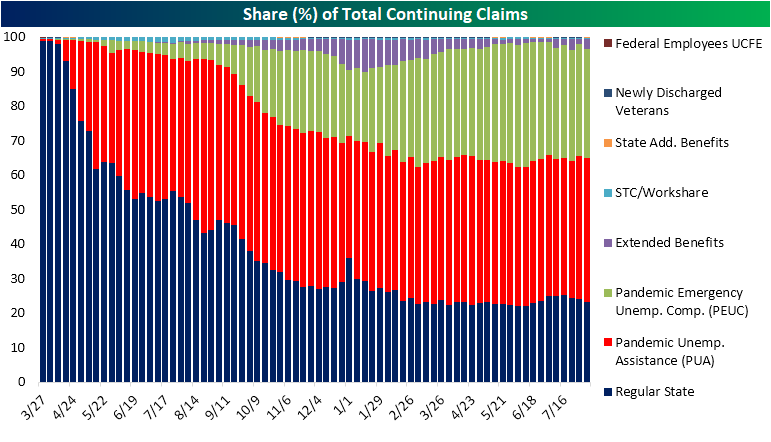
Including all other programs adds another week of delay so the most recent read on continuing claims across all programs is through the week of August 6th. Total claims rose to 12.02 million that week versus 11.84 million in the final week of July. Two of the largest programs, regular state and Pandemic Emergency Unemployment Compensation (PEUC), saw significantly lower claim counts that were offset by increases in PUA and extended benefit claims. PUA claims rose back above 5 million due to a 104.71K increase erasing most of the decline from the second half of July. Extended benefits remain particularly volatile, and this week saw another big move with claims rising 173.5K. At 351.4K, this program is at one of the highest levels since April. While there are still several weeks until the data would catch up, through those most recent readings there are 8.8 million slated to lose benefits with the September 5th expiration for pandemic programs. Click here to view Bespoke’s premium membership options.