The Closer: End of Week Charts — 3/20/20
Looking for deeper insight on global markets and economics? In tonight’s Closer sent to Bespoke clients, we recap weekly price action in major asset classes, update economic surprise index data for major economies, chart the weekly Commitment of Traders report from the CFTC, and provide our normal nightly update on ETF performance, volume and price movers, and the Bespoke Market Timing Model. We also take a look at the trend in various developed market FX markets.

The Closer is one of our most popular reports, and you can sign up for a free trial below to see it!
See tonight’s Closer by starting a two-week free trial to Bespoke Institutional now!
What’s In Store For Unemployment
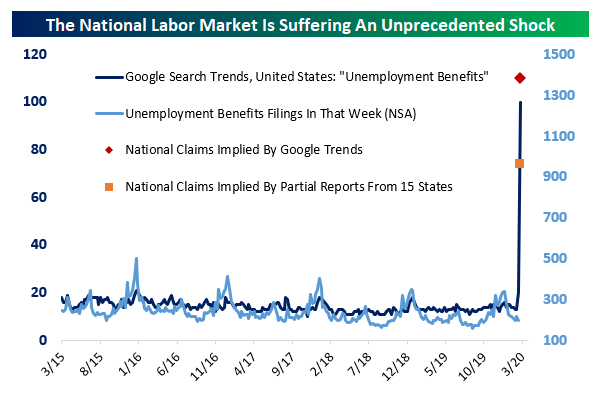
We’ve been keeping track of state jobless claim filings around the country as they’ve been reported in the media, and the numbers are grim. Based on a wide range of states that have reported just a couple of days’ worth of statistics, filings look to be just shy of 1 million for the week (due to be reported next Thursday, March 26th). Of course, those numbers could come in much higher through the week. We saw one broker economics department estimate the total number at 2.5 million. We also like to look at Google Trends data, because it generally tracks claims pretty well. If the numbers from that unofficial data are even close to correct, the US is going to report somewhere between 1.3 million and 1.5 million initial jobless claims in six days.
It’s worth thinking about what that mechanically means for the unemployment rate. The chart below shows a range of four different unemployment rates that would come about from job losses as detailed. Assuming next week’s onslaught of claims is only the beginning, it wouldn’t take long to get to an unemployment rate near the highs around 10% from the last recession. If the US sheds more than a million jobs in the first week as a starting point this week, it’s easy to see how fast the unemployment rate could rise.

Bespoke’s Morning Lineup – 3/20/20 – 6.5 Hours Left
See what’s driving market performance around the world in today’s Morning Lineup. Bespoke’s Morning Lineup is the best way to start your trading day. Read it now by starting a two-week free trial to Bespoke Premium. CLICK HERE to learn more and start your free trial.
Futures started out the overnight session weak, rallied throughout the night, but have been giving up ground ever since. We have no idea where they’ll be by the time the market opens (or closes for that matter). At the recent pace, though, they won’t be positive by the time equities open for trading. We would note that if the S&P 500 does manage to finish the day higher, it would be the first back to back gains for the S&P 500 since February 12th!
Along with US equities, just about every financial asset except for volatility products and the US dollar are higher. The moves higher look pretty reasonable and restrained, and that would be a huge improvement for the function and orderliness of US financial markets even if we have not yet seen a major bottom for equities start to carve out yet. The best thing for everyone is that markets will close for the weekend shortly and give investors, central bankers, lawmakers, and most importantly, health care professionals an opportunity to assess their actions over the last few weeks to see what has worked and what hasn’t. They can also take into account new developments and alter their actions accordingly. Conditions have been very fluid, but a lot still needs to be done. The bottom line is that the status quo of an indefinite economic lockdown is unsustainable for everybody.
Read today’s Bespoke Morning Lineup for a discussion of the latest uptake in Fed liquidity programs, European markets, credit market dislocations, and coronavirus case counts.

Charts like the one of crude oil’s daily changes can be found across just about every different asset class these days. Yesterday, WTI crude oil had its largest one-day daily gain on record, rising by 23.8%. That move followed the second and third largest one-day declines for crude oil on record from 3/9/20 (-24.6%) and 3/18/20 (-24.4%), respectively. Not sure what you want to call it, but it’s far from rational market behavior.

The Closer – Vol Must Fall, Markets Must Clear – 3/19/20
Log-in here if you’re a member with access to the Closer.
Looking for deeper insight on markets? In tonight’s Closer sent to Bespoke Institutional clients, we begin with reason that volatility may come down before turning to fixed income markets. Next we turn to the massive moves seen in crude oil. We finish with a look at weekly consumer comfort data from Bloomberg.

See today’s post-market Closer and everything else Bespoke publishes by starting a 14-day free trial to Bespoke Institutional today!
COVID-19 Collapse vs. Other Major Downturns
Even though equities rose today, the S&P 500 still remains over 28% off of the 2/19 high. As of yesterday’s close, only twenty days after the S&P 500’s peak, the index was down nearly 32% from that high. Below is a look at the current selloff from its high versus prior big selloffs since 1928. We all know about the 1929 and 1987 market crashes, but this one has even those beat in terms of the time it took to fall this much. And the two major peaks and subsequent bear markets of the 21st century both took basically a year to fall the same amount that we’ve fallen in just 20 trading days this time. Start a two-week free trial to Bespoke Institutional to our full library of research and interactive tools.

Sentiment Still Sour
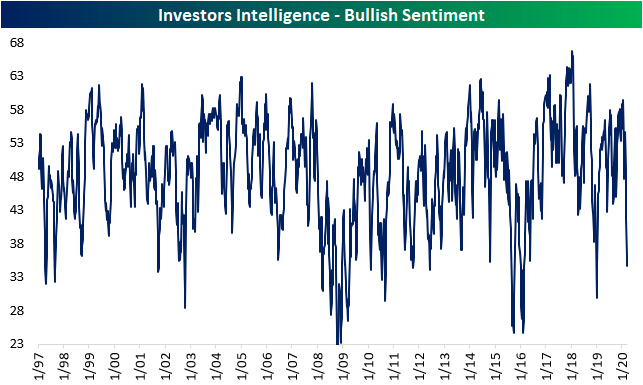
With the S&P 500 only having fallen roughly 1.3% since the last week’s sentiment survey from AAII, bullish sentiment has risen 4.66 percentage points to 34.4%. While bullish sentiment among individual investors is higher, another reading of newsletter writers from Investors Intelligence saw bullish sentiment drop even further. 34.6% of respondents in that survey reported as bullish which is the lowest amount since the first week of last year. That is in the lowest 5% of all readings for that sentiment reading.

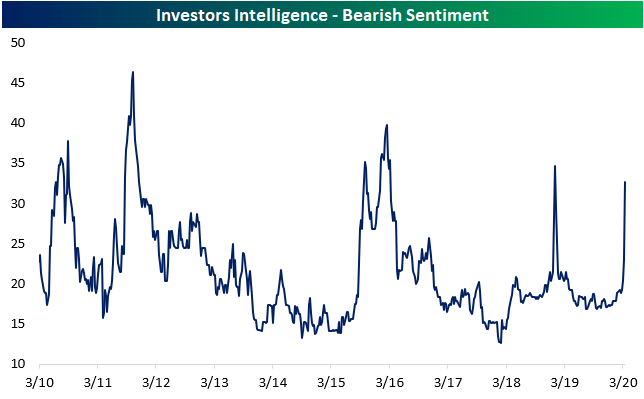
With bullish sentiment picking up, bearish sentiment fell though not by much. Bearish sentiment remains very elevated. For the second week in a row, over half of the respondents reported as pessimistic. That is the first time with back to back readings above 50 since March 2009. The Investors Intelligence survey also remains extremely bearish. 32.7% of respondents in that survey reported as bears which is the highest share since the first week of 2019 when that reading totaled 34.6%.

As for the AAII’s reading on neutral sentiment, for only the 28th time in the survey’s history going back to 1987, less than 15% are reporting neutral sentiment. Now at 14.5%, neutral sentiment is at its lowest level since November of 2010 when it had fallen to 13.95%. Start a two-week free trial to Bespoke Institutional to access our interactive economic indicators monitor and much more.

Oil Slippery
Like a flopping wet fish, it’s been incredibly hard to get a hold on an accurate price of crude oil this week. With a gain of 22.2% so far today, WTI is experiencing its largest one-day gain on record (dating back to 1983). The next closest largest one-day gain was in December 2008 when crude rallied 17.8%. While today’s gain is impressive, keep in mind that it followed yesterday’s decline of 24.4% which ranks as the third-largest one-day decline on record and last week’s 24.6% decline on March 9th. In fact, three of the four largest one-day percentage moves in WTI have all come in the last two weeks!
While a big gain in any asset class always leads to questions over whether it is the start of a new run higher, we would caution that following the prior nine largest one-day gains on record, crude oil’s median change over the next week was a decline of 4.4%. Start a two-week free trial to Bespoke Institutional for full access to our market and economic analysis.

Largest Drop in Philly Fed Manufacturing On Record
Just one month ago, manufacturing businesses surveyed by the Philadelphia Fed indicated the most optimistic outlook since early 2017. Throw in the massive impact of the coronavirus and in one month that picture has been completely turned on its head. Falling from 36.7 last month to -12.7 this month, the headline index is now back to the same level it was at in July of 2012.

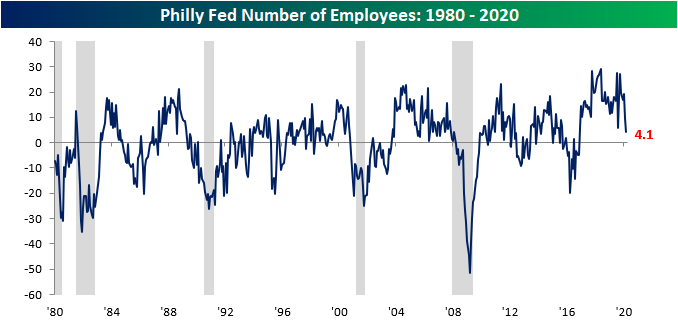
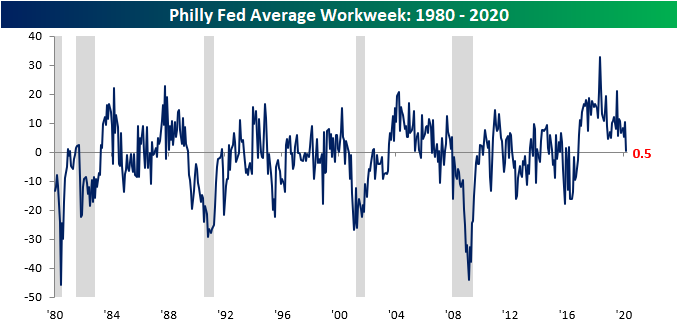
Each of the individual components also fell quite dramatically with all but two, Number of Employees and Average Workweek, falling by double digits. Not a single component rose this month with multiple components, in addition to the headline index, falling into negative territory. The worst decliners were those measuring demand as the indices for new orders and shipments were down sharply. Additionally, manufacturers have also seemed to have drawn down on existing business as inventories and unfilled orders are also down.

One of the key areas of weakness driving into the massive decline in the headline number this month was New Orders. Last month, this index came in at 33.6 which was the highest level since May of 2018 and the fourth-highest reading of all months of the current cycle. Now at -15.5, this is the lowest level since June of 2012 and the third-lowest reading of the current cycle.
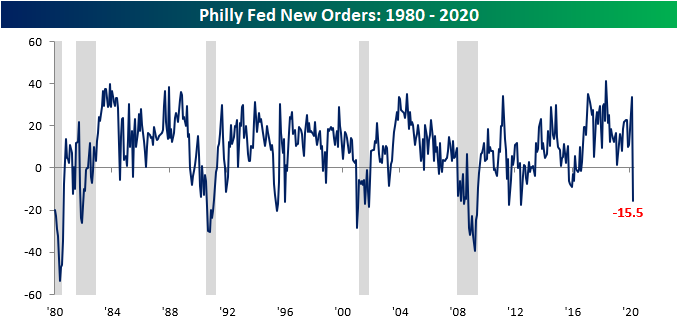
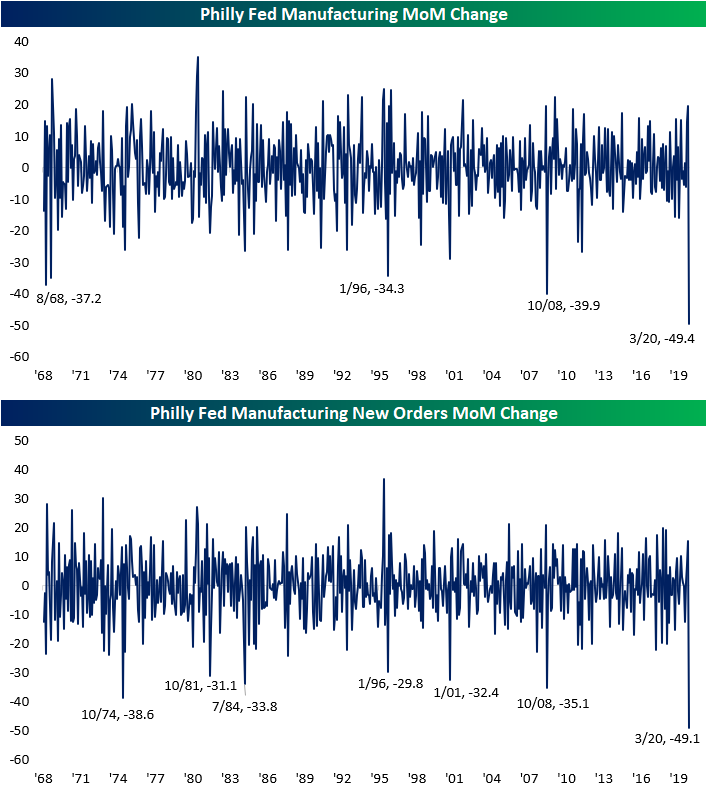
That 49.1 point decline month over month for new orders as well as the 49.4 point drop for the headline index are the largest monthly declines on record (chart below). That seems to suggest that the shock to demand and general conditions reported by the region’s manufacturers has been more sharply negative than even any recessionary period in the past 52 years since the survey began.
While it did not tip into negative territory, shipments are also down sharply, falling 25.2 points to 0.2. That is the fifth largest month-over-month decline on record for this category. This seems to further reinforce the idea that demand has weakened dramatically over the past month.

Given the shutdowns that have taken place and the rise in jobless claims this week, it should come as no surprise that fewer businesses are taking on more workers and the length of the workweek is also being cut down. Considering social distancing has continued to be on the rise and businesses now seem to face a lack of demand, it will not be surprising to see these readings tip negative next month. Start a two-week free trial to Bespoke Institutional to access our interactive economic indicators monitor and much more.
Russell 2000’s Third Largest Drawdown on Record
While US large cap stocks are right around 30% from their record highs a month ago, the carnage in small caps has been even more severe. While the Russell 2000 never quite made a new high this year along with the broader market, it got pretty close. Like the rest of the market, though, it has been crushed. As of yesterday’s close, the Russell 2000 was 43.1% below its all-time high which ranks as the third-largest decline from a record high. The only two periods where the Russell saw a larger decline were in October 2002 when the drawdown reached 46.1% and then in March 2009 when the selling finally stopped at 59.9% on March 9, 2009. Now, if the Russell 2000 were to match either of those prior two periods in terms of magnitude, it would have to fall an additional 4.3% to match the decline of October 2002 or 28.9% to match the decline of March 2009. Start a two-week free trial to Bespoke Institutional for full access to our market and economic analysis.

Claims Spike
As could be expected and as we have been warning this week (see here and here), shutdowns aimed to thwart the spread of the coronavirus have begun to impact weekly jobless claims. Claims exploded higher by 70K to 281K this week. That is the largest weekly increase in the seasonally adjusted number since November of 2012 when they had risen 81K. Going all the way back to the beginning of the data in 1967, there have only been 13 total times (including the two aforementioned instances) that jobless claims have risen by 70K or more in a single week. The largest of these was a 172K spike in July of 1992. While this week’s increase may have been large, just wait for next week’s explosion.

With the massive surge in claims this week, the indicator now sits at its highest level since the spike up to 299K in September 2017. Other than that, the last time claims consistently came in around these levels was back in mid-2015. Given the fact that shutdowns across the country have ramped up over the past week, claims are likely to continue to experience large moves, and it is likely that we will see this number rise even further in the coming weeks.

The moving average has also risen but is not yet at as notable of levels as the seasonally adjusted number. Now at 231.5K, the moving average is only at its highest level since the final week of 2019 when it was 233.5K. But the 16.5K increase versus last week is the largest spike in one week since October of 2013 when the moving average rose by 17K. Additionally, of all weeks since 2000, it is the 14th largest week over week increase.

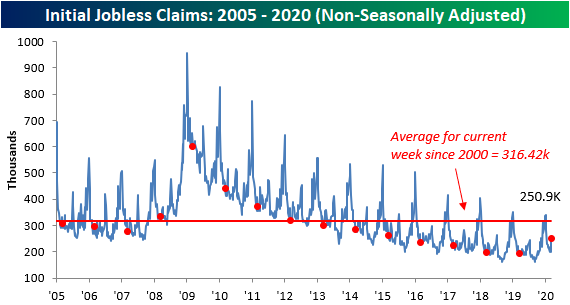
The non-seasonally adjusted number rose by 50.5K this week to 250.9K. For the current week of the year (12th week), that is the highest level since 2015 when it was 260.2K.Start a two-week free trial to Bespoke Institutional to access our interactive economic indicators monitor and much more.