Bespoke’s Morning Lineup – 3/11/21 – Five in a Row?
See what’s driving market performance around the world in today’s Morning Lineup. Bespoke’s Morning Lineup is the best way to start your trading day. Read it now by starting a two-week free trial to Bespoke Premium. CLICK HERE to learn more and start your free trial.
“The key to making money in stocks is not to get scared out of them.” – Peter Lynch
The Dow is looking to make it five in a row today as equity futures are higher across the board. Weekly jobless claims came in lower than expected on both an initial and continuing basis, and are also both at or near their lowest levels of the pandemic. Futures were already higher this morning, but dovish comments from ECB President Lagarde have boosted the mood even further.
Trends related to COVID continue to show improvement on both a national and international basis, as vaccine doses continue to pile up across the country. Also, news from Pfizer (PFE) suggesting strong (94%+) real-world effectiveness of its vaccine based on a study in Israel only makes the outlook for once those doses are administered more broadly even more optimistic.
Be sure to check out today’s Morning Lineup for updates on the latest market news and events, including a recap of Asian and European markets, the latest ECB rate decision, Japanese bond flows, an update on the latest national and international COVID trends, including our series of charts tracking vaccinations, and much more.

Looking at the chart of QQQ, it’s in a bit of limbo heading into today. Last week, the index appears to have successfully tested support at its peak from last September. Despite the bounce, QQQ still remains below its 50-DMA, and even after what is on pace to be a 2% gap at the open, it will still be trading below its 50-DMA. Large-cap tech still has some catching up to do!

Short Interest Update
Short interest numbers as of the end of February were released yesterday. In aggregate across all Russell 3,000 stocks, short interest as a percent of float came in at 3.21%, down from 3.6% at the start of the year. In the table below, we show the 25 stocks in the Russell 3,000 that currently have the highest short interest as a percent of float. Topping the list is Academy Sports and Outdoors (ASO) with 40.6% of shares shorted; unchanged in its ranking from the last report for the period ending February 12th. While it is still the most heavily shorted name in the index, ASO did see short interest as a percent of float fall 1.25 percentage points since the last report, and it is down even more considerably since the start of the year given its over 20% rally in that time. Including ASO, 13 of the top 25 most shorted stocks have lower short interest than they did in the last report. Of these, GameStop (GME) has seen the largest decline. GME has been on another massive rally over the past couple of weeks which has left the stock within 16.5% of its January closing highs. With that rally likely causing some shorts to close out their positions, the stock has seen a 6.36 percentage point drop in short interest as a percent of float in the most recent period, though, it remains one of the most heavily shorted stocks. Conversely, GEO Group (GEO) and Solid Biosciences (SLDB) are the two stocks in the top 25 that have seen short interest rise the most since the last report and YTD. For SLDB, the increase in short interest comes on what have been big gains year to date (+39.84%) while GEO has actually fallen double digits this year.

Not only has SLDB seen the biggest uptick in short interest among the most heavily shorted stocks, but it is also the stock that has seen the biggest increase of the entire index. In the table below, we show the Russell 3,000 stocks that have seen the biggest increase/decrease in short interest as a percent of float since the last report in mid-February. Other than SLDB, no other name saw a double-digit increase from the previous report with the next largest increase coming from Workhorse Group (WKHS) which saw short interest as a percent of float rise 8.4 percentage points. While WKHS saw higher short interest from the last report, the stock is still less heavily bet against than it was at the start of the year. Of the 20 stocks to see the biggest increases, WKHS is the only one that this applies to.
As for the stocks that have seen the biggest declines in short interest, there are three that fell by more than 10 percentage points: Corbus Pharma (BRBP), Dillard’s (DDS), and Kymera Therapeutics (KYMR). It should come as no surprise that once again, GME is not much further down this list with its 6.36 percentage point drop in short interest. On a year-to-date basis, GME is also the stock that has seen the biggest decline in short interest. Dillard’s (DDS), BigCommerce (BIGC), and Ligand Pharma (LGND)—all of which saw some of the biggest declines since the last report—are the runners-up in terms of YTD declines each having seen short interest fall by over 50 percentage points.

Looking across the names in the tables above, one industry group pops up more than any other: the Pharmaceuticals, Biotechnology, and Life Sciences industry. Of the 25 most heavily shorted names, 7 stocks are part of this industry. Meanwhile, of the 20 stocks that have seen short interest increase the most since the last report, 11 are from this industry, though, even 8 of the 20 biggest decliners also belong to the Pharma, Biotech, & Life Sciences industry.
Given this, on an aggregate basis, this industry has the highest short interest as a percent of float; up 6 bps from the last report to 5.46%. That replaces Retailing in the number one spot of the most heavily shorted industry groups. Further, the massive amount of short interest in retail names has appeared to have normalized. Whereas the industry came into the year with over 8% of float shorted, the current reading has fallen down to 5.36%. Similarly, Energy and Transportation stocks have seen aggregate short interest as a percent of float fall by more than 1 percentage point since the start of the year. Not everything has seen short interest decline though. Food, Beverage, & Tobacco, Household & Personal Products, Banks, and Insurance have all seen short interest rise since the start of the year. Since the last report, Food & Staples Retailing, Commercial & Professional Services, and Insurance all have seen the biggest upticks in short interest. Click here to view Bespoke’s premium membership options for our best research available.

Bespoke’s Morning Lineup – 3/10/21 – Inflation Day
See what’s driving market performance around the world in today’s Morning Lineup. Bespoke’s Morning Lineup is the best way to start your trading day. Read it now by starting a two-week free trial to Bespoke Premium. CLICK HERE to learn more and start your free trial.
“The first panacea for a mismanaged nation is inflation of the currency; the second is war. Both bring a temporary prosperity; both bring a permanent ruin. But both are the refuge of political and economic opportunists.” – Ernest Hemingway
Nothing like a quote on the perils of inflation for a day when inflation is on everyone’s mind in the wake of recent market performance and today’s release of the February CPI. Equity futures were modestly higher heading into the release, treasury yields are higher, and bitcoin is above $55K. With the report coming in right in line with expectations at the headline level and slightly weaker than expected ex-food and energy, the positive tone looks to be continuing. We would stress, though, that this is only the initial reaction. There’s lots of time left in the day and even to the opening bell!
Be sure to check out today’s Morning Lineup for updates on the latest market news and events, including a recap of Asian and European markets, French manufacturing output, credit growth and inflation in China, an update on the latest national and international COVID trends, including our series of charts tracking vaccinations, and much more.
After Tuesday’s surge in the Nasdaq and strong rally in the S&P 500, US equities are back in the black for the week, but in many ways, the stocks that led the rally on Tuesday were the exact opposite of the ones that outperformed on Monday. For starters, within the entire Russell 1000, there were only 36 stocks that outperformed the index by more than 1% on both days.
The decile performance of stocks in the Russell 1000 on Tuesday based on their performance Monday also illustrates this trend. As shown in the chart below, the five deciles of top performers Monday all averaged declines on Tuesday, while the five deciles comprising the worst-performing stocks from Monday all saw positive returns on Tuesday. Outside of decile one which was only down slightly less than decile two, the performance rankings of the ten deciles on Monday versus Tuesday was a complete reversal. As noted in the Bible, “the last shall be first, and the first last:”

Small Business Sentiment Slow to Come Back
After crashing following the election, optimism on the part of small businesses remains pretty beaten down, though there was finally an improvement in February. The NFIB’s Small Business Optimism Index was expected to see a 2 point rebound in the month of February, but the increase was even smaller as the index rose from 95 to just 95.8.

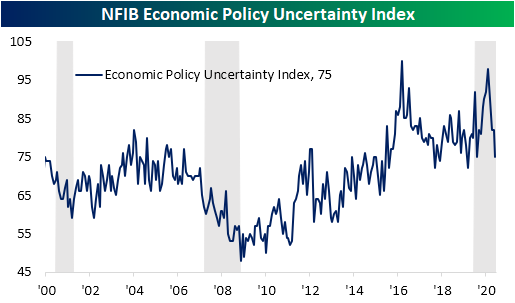
While small business sentiment is far from recovered, uncertainty has improved. After spiking to a near-record high of 98 headed around the election last fall, the index for Economic Policy Uncertainty has continued to fall dropping to 75 in February. That 7 point month-over-month decline stands in the bottom 5% of all monthly changes which brings the index to the lowest level since last April.
Breadth in the report was mostly positive with 10 of the 18 categories higher in February while another 3 went unchanged and the remaining 5 were lower. Although most categories saw an improvement, several readings remain at historically low levels. For example, the indices for Expect Economy to Improve and Expect Real Sales Higher were both in the 3rd percentile of all readings. Other indices also remain at the low end of their historical ranges such as Plans for Capital Outlays and Now is a Good Time to Expand.

Sales metrics generally improved although firms reported as less optimistic for the future. While sales expectations fell deeper into negative territory, small businesses reported higher nominal sales as that index rose 9 points from -7 to 2. That was in the top 5% of all monthly moves and the first positive reading since November. Additionally, the index for Actual Earnings Changes also improved rising 5 points to -11. Due to the strong pace of sales, a higher share of companies reported higher prices. That index rose 8 points to 25. That is the strongest reading for the index since August 2008.

In addition to stronger sales, lower inventory levels also played into those higher prices. The index of Inventory Satisfaction which measures how many firms report current inventory levels as “too low” was flat on the month in the top 1% of all readings. Despite this, fewer firms report plans to increase inventories. The index for Inventory Accumulation actually fell 2 points to the lowest level since May.

While small businesses do not appear to be making plans to increase inventories, they are investing in employment. The index for Hiring Plans rose slightly from 17 in January to 18 in February. Although that is off higher levels from earlier in the pandemic, it is well within the range of the past several years. Compensation Plans were also higher with the index gaining 2 points to 19. Even though firms appear to want to increase employment, they have yet to follow through with hiring. The index for Actual Employment Changes remains negative falling further to -3 in February. Meanwhile, the Compensation index went unchanged. The lack of actual increases to employment is not a demand problem but instead appears to be a labor supply problem. A record number reported job openings as hard to fill while 33% report either cost or quality of labor as the single most important problem for the business; up 5 percentage points from the prior month. That borrowed from firms reporting things like Taxes, Inflation, and “Other” as their biggest issues. Click here to view Bespoke’s premium membership options for our best research available.

Versatile Outperformers
There’s still a lot of time left in the day, but the tone of the equity market has been much different today compared to Monday. Whereas Monday saw tech stocks get creamed while cyclical areas of the market rallied, today we’re seeing tech stocks rebound while cyclicals lag. To illustrate, within the entire S&P 500 there are just 14 stocks that have so far managed to outperform the index by at least one percentage point both yesterday and today. The table below lists each of those stocks, and looking through them, they aren’t the flashy, high-profile names that you always see discussed in the media. Who said boring is a bad thing? In terms of sector representation, there’s also no clear trend as eight of the eleven sectors are represented by the list of just fourteen names!
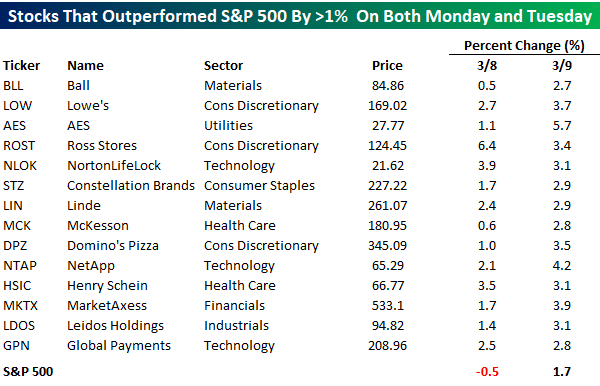
Below we show six-month price charts of each of the 14 names listed above from our Chart Scanner tool. Here again, no clear technical theme links the stocks together. While stocks like AES, Global Payments (GPN), McKesson (MCK), and Ross Stores (ROST) remain close to six-month highs, others like Ball (BLL), Domino’s (DPZ), and Market Axess (MKTX) aren’t far from six-month lows. Click here to view Bespoke’s premium membership options for our best research available.


Bespoke’s Morning Lineup – 3/9/21 – Diverging Markets
See what’s driving market performance around the world in today’s Morning Lineup. Bespoke’s Morning Lineup is the best way to start your trading day. Read it now by starting a two-week free trial to Bespoke Premium. CLICK HERE to learn more and start your free trial.
“There are no facts, only interpretations.” – Friedrich Nietzsche
The Nasdaq is looking to brush the dust off its shoulders after a major beatdown in the high growth area of technology to kick off the week yesterday. S&P 500 futures are also up nearly one percent as the DJIA lags. For now, fixed income markets are cooperating as yields pull back, but we’ll see if these levels can hold throughout the trading day.
Be sure to check out today’s Morning Lineup for updates on the latest market news and events, including revised OECD economic forecasts, trading in overseas markets, Japanese economic data, an update on the latest national and international COVID trends, including our series of charts tracking vaccinations, and much more.
Yesterday was another wild day in the stock market. Depending on your perspective and your benchmark, it was either a good day or a bad day. From the perspective of the DJIA, which was up 0.97%, the week didn’t start off all that bad, but for an investor who follows the Nasdaq, this week started off much differently with a decline of 2.4%.
That kind of divergence where the DJIA is up and the Nasdaq drops over 2% on the same day is pretty uncommon. The charts below show the performance of both indices going back to 1986, and in each one, we have included red dots to show all the occurrences where the DJIA was up and the Nasdaq was down over 2%.
In this span, every prior occurrence was confined to three separate periods. While there were two separate occurrences right after the 1987 crash, there wasn’t another until 1999, when there were three between April and June. After that, the frequency of occurrences really picked up as there were 23 in 2000 and another 7 in 2011. After that, the two indices went nearly another 20 years until July 2020 without any similar occurrences, and now this year, there have been two since 2/22.

Tepper and Treasuries
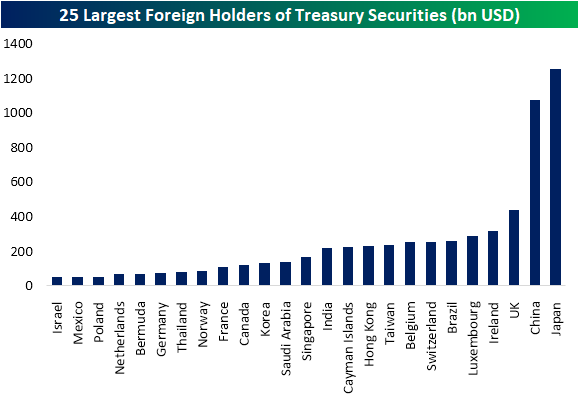
One catalyst being given credit to the generally positive performance equities today were bullish comments in a CNBC interview with Appaloosa Management’s David Tepper. Tepper stated that in his view “rates have temporarily made the most of the move” and ” “it’s very difficult to be bearish.” Tepper also stated a belief in the possibility of Japan stepping in as a buyer for US Treasuries following the recent rise in yields. As for why exactly Japan doing so would benefit Treasuries, it should be noted that Japan is the largest foreign holder of US Treasuries (per Treasury International Capital TIC data). As of December data (January data is set to be released next Monday, 3/15), Japan held $1.25 trillion in Treasury securities. The only other country that comes even close is China with $1.072 trillion in Treasury holdings. Behind those two, the UK is the next largest holder with not even half that amount: $440.6 billion.
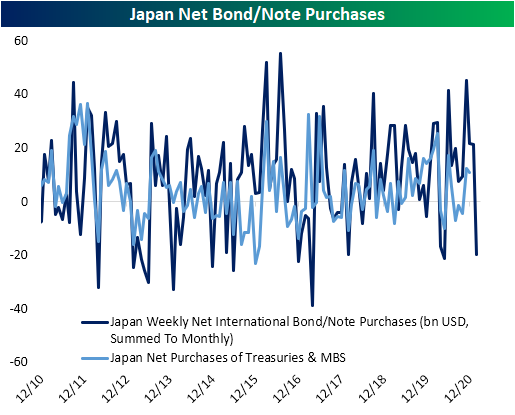
Using the same TIC data, from early 2015 through the end of 2019, Japan was a net seller of US Treasury and Federal Financing Bank securities. For most of 2020, that had changed with Japan becoming a net buyer though that waned towards the end of the year. The recent uptick in yields coincided with Japan returning to being a net seller.

While Japan has purchased fewer Treasuries, they have still been making up the difference as big buyers of MBS. According to the TIC data for December, positive flows of MBS purchases offset the decline in Treasury purchases. As for Japanese data with less of a delay, in the chart below we show weekly net purchases of all foreign bonds and notes in US dollar terms summed by month. As for this more high-frequency data, again, there has yet to be evidence that Japan is buying Treasuries. For the month of February, the country was a net seller of $19.6 billion in foreign bonds and notes. But Click here to view Bespoke’s premium membership options for our best research available.
Bespoke’s Consumer Pulse Report — March 2021
Bespoke’s Consumer Pulse Report is an analysis of a huge consumer survey that we run each month. Our goal with this survey is to track trends across the economic and financial landscape in the US. Using the results from our proprietary monthly survey, we dissect and analyze all of the data and publish the Consumer Pulse Report, which we sell access to on a subscription basis. Sign up for a 30-day free trial to our Bespoke Consumer Pulse subscription service. With a trial, you’ll get coverage of consumer electronics, social media, streaming media, retail, autos, and much more. The report also has numerous proprietary US economic data points that are extremely timely and useful for investors.
We’ve just released our most recent monthly report to Pulse subscribers, and it’s definitely worth the read if you’re curious about the health of the consumer in the current market environment. Start a 30-day free trial for a full breakdown of all of our proprietary Pulse economic indicators.

How Long Can Dividends (DVY) Outperform Growth (VUG)?
Over the past few weeks, high growth names have turned into a pain trade with the Vanguard Growth ETF (VUG) having fallen 11% from its February 12th closing high to the intraday lows last Friday; with a small rally in the second half of Friday’s session which has continued today, the ETF is now down 7.16% since the 2/12 high. Meanwhile, in the same time frame, the iShares Select Dividend ETF (DVY) has risen 8.13% since its February 12th close, breaking out to new all-time highs both on Friday and again today


Looking at the screen of various styles of ETFs in our Trend Analyzer, the recent moves have brought VUG deep into oversold territory as of Friday’s close. Other growth-focused ETFs are similarly oversold. Meanwhile, the strong performance of dividend stocks has resulted in DVY alongside the S&P Dividend ETF (SDY) to be extremely overbought at more than two standard deviations above their respective 50-DMAs.

In the chart below, we show the ratio of the Dividend ETF (DVY) versus the Growth ETF (VUG). Times in which the line is declining indicate outperformance of growth while an upward trending line indicates outperformance of dividend stocks.
As could be expected given the different risk premiums of the two styles of these ETFs, growth stocks have seen fairly consistent outperformance in recent years. But more recently, the opposite has been the case, and in a big way. As shown in the second chart below, over the past month (21 trading days) the ratio of DVY to VUG has risen over 16%. In the history of the data going back to early 2004, the only period that has seen this line rise at a more rapid pace was in September 2008 when it rose by 25.46%. Looking at that instance, the outperformance of dividend stocks did not lead to any sort of a longer-term trend though. In fact, the ratio peaked only a couple of months later erasing the entirety of the move by early March 2009. Click here to view Bespoke’s premium membership options for our best research available.

Bespoke’s Morning Lineup – 3/8/21 – More Tech Pain?
See what’s driving market performance around the world in today’s Morning Lineup. Bespoke’s Morning Lineup is the best way to start your trading day. Read it now by starting a two-week free trial to Bespoke Premium. CLICK HERE to learn more and start your free trial.
“Even a mistake may turn out to be the one thing necessary to a worthwhile achievement.” – Henry Ford
It’s looking like more pain may be in store for tech stocks to start the week as Nasdaq futures are trading down by more than 1%. As bad as that sounds, things were worse about a half-hour ago before comments from David Tepper through CNBC where he said he doesn’t see rates rising in the short-term and that therefore, equities look attractive.
Be sure to check out today’s Morning Lineup for updates on the latest market news and events, the passage of the COVID relief bill, Chinese trade data, an update on the latest national and international COVID trends, including our series of charts tracking vaccinations, and much more.
Last week was a painful one for the Nasdaq 100, but for the majority of other US indices, last week was a positive one with the DJIA up over 1% while the S&P 500 was up just shy of 1%. Following a month-long period of consolidation, all but two of the indices in our Trend Analyzer currently have good timing scores.
