Microsoft (MSFT) Closes in on Apple (AAPL) as World’s Largest
With a gain of more than 4% today in reaction to earnings, Microsoft (MSFT) is suddenly challenging Apple (AAPL) for the title of world’s largest company. Coming into today, Apple had a market cap of $2.468 trillion versus Microsoft’s market cap of $2.328 trillion. That spread of $140 billion has shrunk all the way down to just $27 billion after Microsoft’s gain of $117 billion in market cap today alone.

As shown below, Microsoft (MSFT) had a market cap of $615 billion versus Apple’s (AAPL) market cap of just $15.9 billion back in late December 1999 near the peak of the Dot Com Bubble. From there, Apple began to gain ground with its iPod and iPhone releases in the early and mid-aughts. On May 26th, 2010, Apple’s market cap finally crossed above that of Microsoft and didn’t look back for quite some time. Remember, before shifting focus on the cloud, Microsoft’s business was struggling mightily. The company’s market cap essentially went sideways for 15 years before exploding higher again in the second half of the 2010s as Office 365 took hold.
While MSFT was actually bigger than AAPL at various points between 2018 and 2020, Apple’s widest market cap margin versus Microsoft actually came in January of this year when Apple was at $2.4 trillion versus MSFT at $1.74 trillion. Since that peak on January 25th, though, MSFT has been rapidly gaining ground. It will only take another small move higher on a relative basis for MSFT to eclipse AAPL’s market cap at this point. AAPL reports earnings on Thursday, so how the stock responds to that report will have a big impact on how this relationship stands heading into the month of November. Click here to view Bespoke’s premium membership options.

Tesla (TSLA) Not Enough To Lift ARK Innovation (ARKK)
It has been awhile since we checked in on Cathie Wood’s ARK ETFs, so below is an updated look at their relative strength versus the S&P 500 SPY ETF. After absolutely surging versus SPY in 2020 and early 2021, the ARK funds have generally been underperforming for the past six months. That being said, they’re still well ahead of SPY since the start of 2020 given that all the relative strength lines are solidly in positive territory. As shown, the ARK Next Generation Internet ETF (ARKW) is doing the best versus SPY over the time period shown. Notably, the ARK Autonomous Tech (ARKQ), Genomic Revolution (ARKG), and Fintech Innovation (ARKF) ETFs have all performed roughly the same versus SPY since the start of 2020 even though they cover different industries and groups.

Taking a look at the largest of the ARKK funds, the ARK Innovation ETF (ARKK) has basically been range bound between $100 and $125 over the last six months. As shown below, ARKK recently managed to re-take its 50-day moving average, but it had trouble getting above resistance at its 200-day moving average. That is even with the massive rally we’ve seen in Tesla (TSLA) lately, which is ARKK’s largest holding at 10%.

As previously mentioned, TSLA is by far the largest holding of ARKK, especially after having rallied 17.8% in the past week alone. Skillz (SKLZ) has actually posted an even larger 20.9% rally in the same span, but its weighting is far smaller at only 0.69%, meaning its gains have been much less impactful on ARKK’s performance. As for the rest of the holdings, not even half are in the green over the past five days and only 38% are in the green year to date. Three holdings—Proto Labs (PRLB), Materialise (MTLS), and Berkeley Lights (BLI)—have seen their price more than cut in half since the start of the year. As shown in the snapshot of our Trend Analyzer below, the bulk of these stocks are also in sideways trends.

Now in the throes of earnings season, most of the ARKK holdings have yet to report results but they are scheduled to do so in the coming weeks. Of those left to report, Roku (ROKU) has averaged the strongest one-day gain in reaction to earnings historically with strong beat rates for sales, EPS, and guidance. Speaking of beat rates, DocuSign (DOCU) is notable in having almost exclusively reported Triple Plays throughout its three-year earnings history. Click here to view Bespoke’s premium membership options.

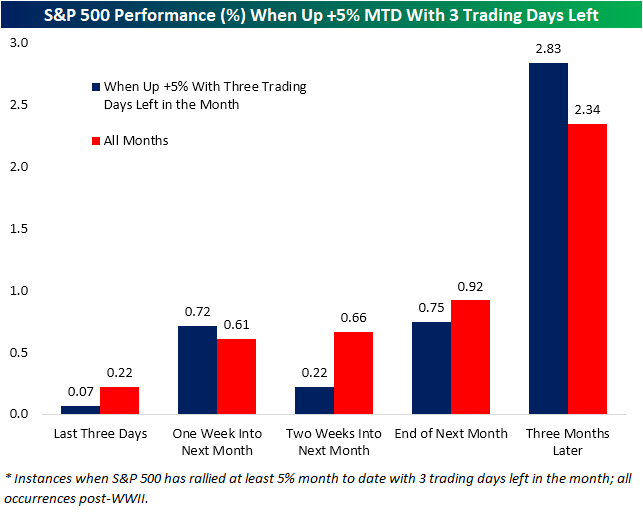
S&P 500 Up +5% With Three Days to Go
There are only three sessions left in the month of October, and the S&P 500 enters them up 6.2% month to date. That marks the best performance through the final three trading days of any month since last November when the S&P 500 was up 11.2% MTD. In the post-WWII period, there have been 95 occurrences where the S&P 500 was up 5% MTD heading into the final three trading days of the month. In those prior months, the S&P 500 has averaged a gain of 7 bps in the final three trading days which is below the average gain of 22 bps in the final three days for all months during that same period. While there is that short-term underperformance, the last three trading days of the given month through the first week of the next month has averaged better than average performance (0.72% vs 0.61%). As for where the S&P 500 goes from there, performance is mixed relative to the norm. Through the end of the following month, returns tend to again be worse than normal, but three months later the S&P 500 has averaged a nearly half percentage point larger gain than the norm. Click here to view Bespoke’s premium membership options.
Bespoke’s Morning Lineup – 10/27/21 – Halfway
See what’s driving market performance around the world in today’s Morning Lineup. Bespoke’s Morning Lineup is the best way to start your trading day. Read it now by starting a two-week trial to Bespoke Premium. CLICK HERE to learn more and start your trial.
“Are you green and growing or ripe and rotting?” – Ray Kroc
With the second and third largest companies in the U.S. reporting earnings after the close yesterday along with dozens and dozens of others, you would have expected to see a larger move in the futures market this morning, but as things stand now, prices are little changed with a slight bias to the upside. Treasury yields are lower with the 10-year back below 1.60% again. The real action in the markets this morning is in the crypto-space, and it’s to the downside as both bitcoin and ether are down over 5% with other smaller assets in the space down even more.
The economic calendar is light today with Wholesale Inventories and Durable Goods hitting the wires at 8:30 and DoE energy inventory data coming out at 10:30.
Read today’s Morning Lineup for a recap of all the major market news and events from around the world, including the latest US and international COVID trends.
With all the earnings reports this week, especially the ones from the largest companies out there, investors were worried about the potential for volatility, but so far, the bulls have won out as the major indices are higher on the week so far (although we do have three full sessions of trading left in the week). Of the ‘big five’ companies reporting this week, Facebook (FB)’s report was met with a disappointing reaction, and last night after the close we heard from Alphabet (GOOGL) and Microsoft (MSFT). In pre-market trading, GOOGL is trading down less than 1% while MSFT trades higher by just over 1.5%. That leaves Amazon.com (AMZN) and Apple (AAPL) for after the close on Thursday, but so far two of the three that have reported have experienced negative reactions to earnings.
As far as the major US averages are concerned, they’re all higher on the week but to varying degrees. The Russell 2000 has been the weakest of the three indices shown below as it was also the only one to trade lower yesterday. The Nasdaq 100 (QQQ) has been the top performer on the week with a gain of over 1%, but it still has yet to take out its record high from early September. Last but not least, the S&P 500 finished off its intraday highs yesterday, but still managed to close at its second record high of the week.

Start a two-week trial to Bespoke Premium to read today’s full Morning Lineup.
Richmond Fed Back to Positive
Like yesterday’s Dallas Fed reading, the Richmond Fed’s Survey of Manufacturing Activity experienced a larger than expected bounce this month as the headline reading rose from -3 to 12. That compares to expectations of a modest increase to only 5. October’s bounce has helped to recover a decent chunk of the steep drops from August and September.

The rise in the composite reading was thanks to broad increases across the report. The only indices that declined month over month were those of Equipment and Software Expenditure, Raw Materials Inventories, Wages, and Prices Paid. Whereas there were several indices in contraction last month, most moved back into expansionary territory.
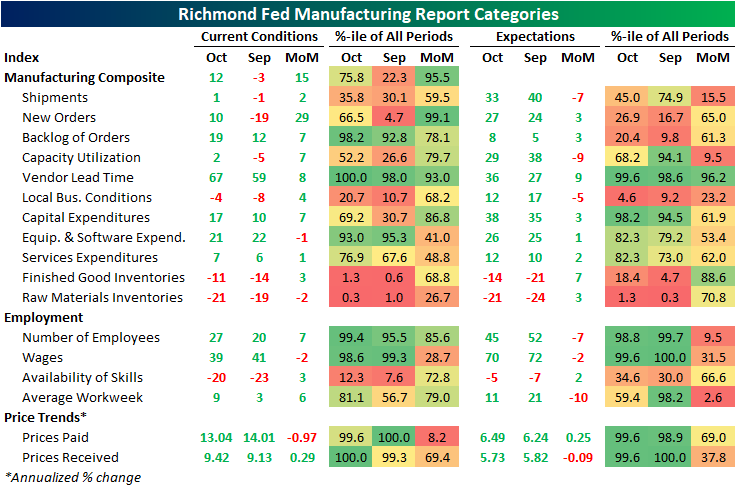
By far the most impressive increase this month was in New Orders. Last month, the index plummeted into the bottom 5% of readings, but after a 29 point increase (which ranks as the fourth-largest monthly gain on record), it is back in positive territory. That was met with a solid uptick in Order Backlogs, but the Shipments component remains much more muted and barely positive. That is likely due to supply chain delays as the index for Vendor Lead Times set a new record high.

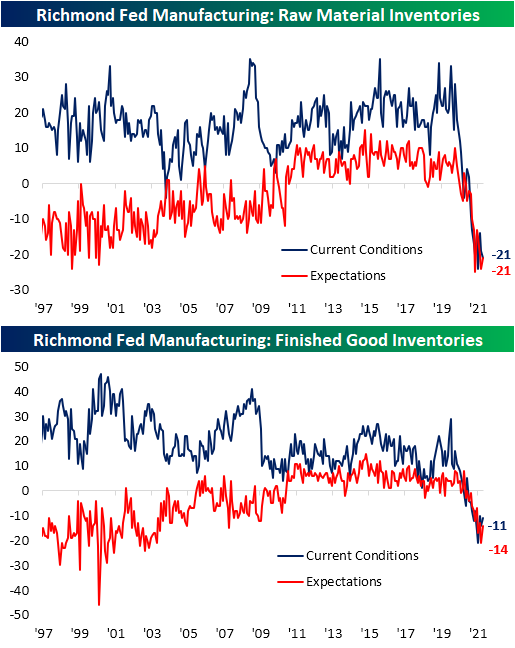
Another issue tied into low shipment growth and delays is rapidly declining inventory levels for both inputs and finished goods. While the former saw a modest bump this month, both indices are only slightly above record lows.
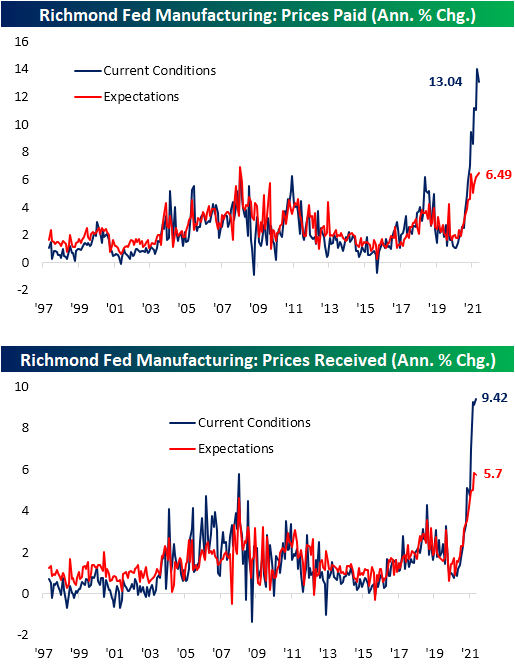
Price indices remain at historic levels and like the indices for inventories, the index for input prices moved lower in October while Prices Received set a new record high at 9.42% annualized. The expectations indices for these two categories saw the opposite results with a new high in Prices Paid and a small decline in Prices Received.
Employment indices were generally stronger in October with upticks in the Number of Employees, Average Workweek, and Availability of Skills. For the Number of Employees, although the current reading is off the peak, it is still above anything observed prior to the pandemic. The same can be said for Wages while the Availability of Skills is back within the range that was in place in the few years leading up to the pandemic. Click here to view Bespoke’s premium membership options.

Short Term Breadth Takes Off
One of the points noted about the recent moves for the S&P 500 over the past few days have been on the outsized impacts of big gains or losses in names like Tesla (TSLA) or Facebook (FB). In spite of the impacts of those single names, the S&P 500’s return to record highs has happened on very strong breadth across sectors. Below, we show 10-day advance-decline line charts from our Sector Snapshot.
The 10-day advance/decline line measures the average daily number of advancers minus decliners in an index or sector over the last ten trading days. It’s a short-term breadth measure that traders use to measure how extended the market is at the moment. Very high readings suggest that the market might be overbought in the near term, and downside mean reversion can be expected. Very low readings suggest the opposite — that the market might be oversold in the near term, and upside mean reversion can be expected.
For the broad S&P 500, the 10-day AD line has hit the highest level since February 12th. Going back to 1990, the current reading stands in the 97th percentile. Looking at each sector, most lines are also in the upper decile of readings since 1990 and only two are not currently overbought: Communication Services and Consumer Staples. Meanwhile, some like Technology and Real Estate are a full two standard deviations above the historical norm. In fact, the Tech sector’s line is the most elevated relative to its respective history of any sector with the current reading in the 98th percentile of all periods. The last time that the line was as elevated as now was in November of last year. No other sector has as long of a gap in time in which it has seen levels similar to the current reading. Most other sectors have seen higher readings as recently as August or September, though current levels are nonetheless elevated. The market has had quite the run over the last two weeks, and we’d expect some sort of cool-off period soon. Click here to view Bespoke’s premium membership options.

High Number of Record Highs
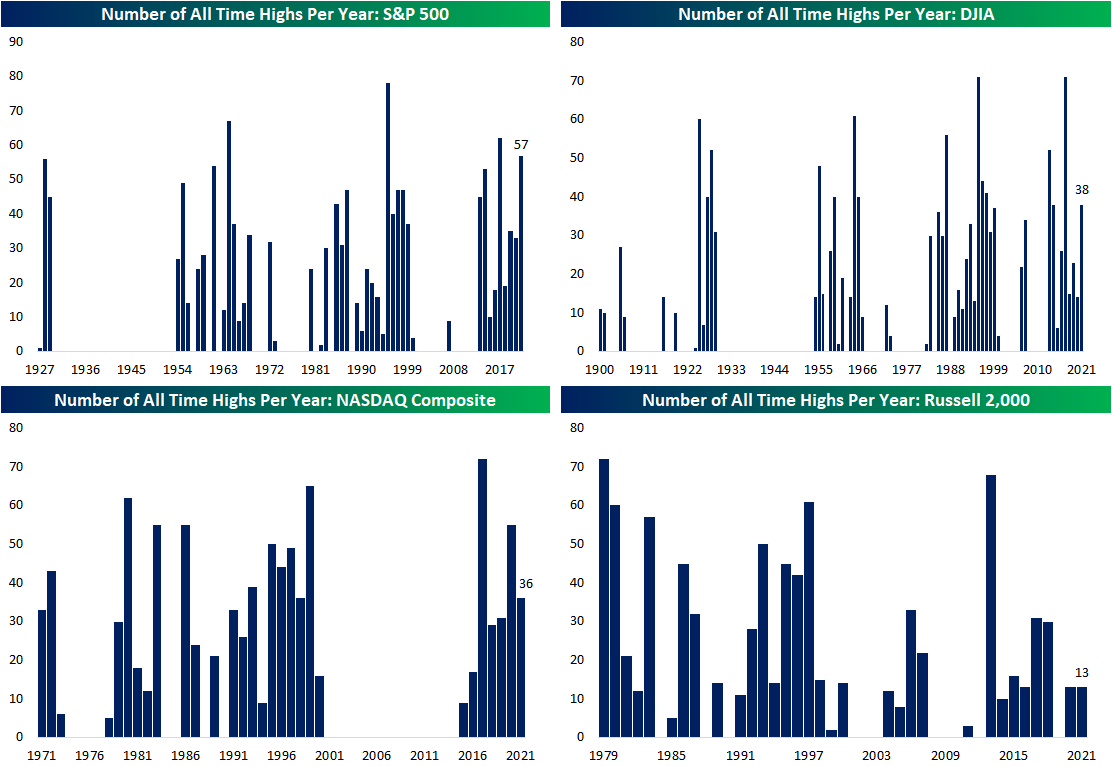
Major US equity indices have returned to all-time highs in the second half of October with the S&P 500 and Dow both hitting record levels today. Meanwhile, the NASDAQ Composite is roughly a quarter of one percent away and the closest to a new all-time high since the last one on September 7th. The Russell 2,000, on the other hand, is at the high end of the past several months’ range, but it is still over 2% below its high from March 15th.
With the S&P 500 having been at new highs over the past few days, it has made 57 new all-time highs year to date. As shown in the top-left chart below, there have only been three other years in the past that have seen more record highs during the full course of the year: 2017 (62), 1964 (67), and 1995 (78). For the other major indices, the pace of record highs is less impressive but still strong. The Dow has made 38 new highs in 2021 which is more than triple the historical average. This year is on pace to see the highest number of record highs for the index since 2017 when it tied 1991 for the record of 71 closes at an all-time high. The NASDAQ Composite has also seen a solid number of highs at 36 which is well above the historical average of 19 per year historically. Given the index has been rangebound essentially all year, the Russell 2,000, conversely, has only seen 13 closing record highs. That is the same number as last year and it is actually below the average of 20 per year historically. Click here to view Bespoke’s premium membership options.
Bespoke’s Morning Lineup – 10/26/21 – Discretionary Leads the Way
See what’s driving market performance around the world in today’s Morning Lineup. Bespoke’s Morning Lineup is the best way to start your trading day. Read it now by starting a two-week trial to Bespoke Premium. CLICK HERE to learn more and start your trial.
“Some people don’t like change, but you need to embrace change if the alternative is disaster.” – Elon Musk
After yesterday’s gain, ten out of eleven sectors have posted positive returns over the last week and are above their 50-day moving averages. With the rally, a number of sectors have now also moved into overbought territory with two – Consumer Discretionary and Financials – now at what we classify as ‘extreme’ overbought levels (more than two standard deviations above their 50-day moving average).

The Consumer Discretionary sector has really surged over the last seven trading sessions after breaking out above resistance earlier this month. It must be optimism on the part of investors over a strong holiday season for the retailers. Right?

Well, not exactly. Normally, when the Consumer Discretionary sector sees a large gain, the reflex response is to pull up a chart of Amazon.com (AMZN) which accounts for about a fifth of the index. But looking at the performance of AMZN over the last several months, it has not contributed anything to the sector’s performance.

The main driver of the Consumer Discretionary sector during this most recent run has actually been Tesla (TSLA). Yes, TSLA is actually classified as a Consumer Discretionary sector stock, and given its recent surge to the trillion-dollar market cap level, it has become an increasingly large share of the sector. In fact, we’re getting to the point where out of a sector of more than 60 stocks, AMZN and TSLA account for close to 40%.

Start a two-week trial to Bespoke Premium to read today’s full Morning Lineup.
Welcome to the Trillion Dollar Club, Tesla (TSLA)
After a 12% gain today on the back of a deal to sell 100,000 Model 3s to Hertz (HTZZ), Tesla (TSLA) joined the trillion dollar market cap club.

In June of this year, Facebook (FB) joined the $1 Trillion Club, bringing the total companies in this exclusive club to five at the time. Below is a look at the one-year forward performance of the five companies that had hit the trillion dollar market cap level prior to Tesla doing so today. Facebook (FB) rallied a bit initially after first crossing $1 trillion, but the stock has been trading lower recently and now has a market cap of ~$925 billion. Amazon (AMZN) did the best in the year after first crossing $1 trillion, followed by Microsoft (MSFT) and Alphabet (GOOGL). Apple (AAPL) initially performed okay after first crossing $1 trillion, but then ran into some speed bumps and was essentially flat twelve months after it became the first company to cross the $1 trillion threshold. It of course remains to be seen how Tesla (TSLA) will do in the year ahead.

Below we extend out even further by showing each of the $1 Trillion Club members’ performance since first crossing the $1 trillion threshold. While Apple trended sideways in the first year after crossing $1 trillion, it surged in year 2 and beyond and currently has a market cap of ~$2.5 trillion. Microsoft (MSFT) has also kept running up to its current market cap of ~2.3 trillion.

The six companies that have been $1 Trillion Club members at any point in time currently represent 25.2% of the S&P 500. With over a quarter of the index being comprised of these names, nearly every investor is tied to their performance in one way or another. The current market cap of these six names is over $10 trillion. To put that into perspective, that is nearly half of US 2020 GDP.

Dallas Fed Divergences
Released earlier this month, the New York and Philly Fed surveys on the districts’ manufacturing sectors both showed larger than expected declines. Next up was the Dallas Fed this morning, and in a breath of fresh air, the results showed activity accelerated by more than expected as the headline reading rose ten points to 14.6.
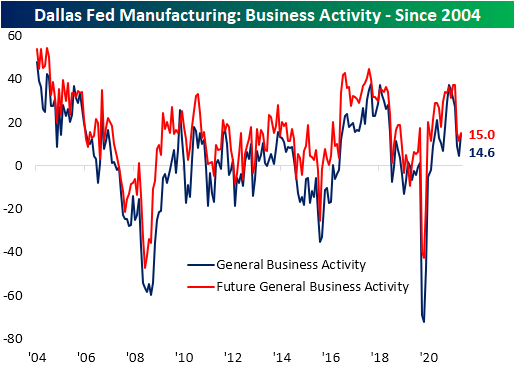
Last month, the index was not far off the historical median, and even after the double-digit increase in October, the index is not necessarily elevated in a historical sense. Some categories are similarly more middling within their historical ranges, but there are several others that remain in the upper few percentiles of readings like Prices Paid and Received, Wages and Benefits, Employment, and Unfilled Orders. The only index in contraction this month was that of Inventories. Additionally, breadth was positive with ten categories higher and six lower MoM.

Demand saw a modest uptick as New Orders came in at a slightly stronger rate. That led the Unfilled Orders index to erase most of September’s move lower as it is now back in the historically elevated range that was in place throughout the spring and summer. While it too moved higher month over month, unfilled orders expectations remained barely negative and significantly lower than the current conditions counterpart. As for another divergence between current and future conditions, the Shipments indices moved in opposite directions this month. Current conditions hit the lowest level since January while expectations rocketed higher by 15.6 points. That ranks in the top 3% of all monthly moves. Outside of the June high of 59.8, it also makes for the strongest reading in three years.

In other words, demand has bounced back a bit, but the region’s businesses are not getting products out the door at as fast of a rate (although that is expected to improve down the road). One likely reason for the weaker reading on shipments is a slowdown in production. That index fell MoM alongside Capacity Utilization. Again, in spite of the decline in current conditions, there appears to be optimism that these readings will be stronger in the future.

The same goes for Delivery Times which rose back to the highest level since June while expectations moderated. Given the higher lead times and deceleration in production amidst higher demand, the inventories index collapsed falling 12.2 points and ranking in the 3rd percentile of all month-over-month moves. While those supply chain-type risks are still evident, the picture for Prices Paid is the same: stalled out albeit at historically elevated levels while Prices Received hit a new record high.

One other area of the report that saw a notable divergence between future expectations and current conditions concerned employment. While the current conditions component made progress in moving back up toward its record high, expectations saw the fourth largest MoM decline on record. Expectations for Hours Worked also saw a significant decline ranking as the tenth-largest on record, though the current conditions index saw a coincident decline. Click here to view Bespoke’s premium membership options.
