Gun Background Checks Down Again
While background checks for the purchase of firearms may not be the most obvious example of an economic indicator, we find that they are worth watching as a gauge of sentiment. For example, if you see a sudden sharp increase in the number of background checks, it could be a signal of increased uncertainty on the part of Americans. After all, when things are going smoothly in the economy and society, people probably don’t feel the need to go out and buy a gun. A perfect case in point is last year during the early days of the pandemic in the Spring. In January 2020, right before COVID, there were 2.7 million background checks for the purchase of firearms. By March, even with most of the economy locked down, background checks surged 37% to 3.7 million. After that initial COVID surge, background checks dropped off a bit but then rebounded throughout the summer as protests flared up across the country. Then, after President Biden was elected and Democrats gained control of the House and the Senate, there was one last surge to a peak of 4.69 million in March 2021.

From that peak in March 2021, background checks have plunged over the last six months to a pre-COVID level of 2.63 million. Not only that, but with six straight months of declines, there has only been one other period in the last 20 years where background checks declined for as many consecutive months. That was back in June 2013 just after President Obama was re-elected. Since Democrats are traditionally more anti-gun than Republicans, any time they do well in elections, it creates a short-term surge in people looking to buy firearms in order to get ahead of any potential anti-gun legislation.

While a drop in firearm purchases suggests an easing level of uncertainty on the part of Americans, it’s obviously not good for the manufacturers of firearms. As shown in the charts below, both stocks are well off their recent highs and are currently testing support levels. Smith and Wesson (SWBI) has actually nearly been cut in half from its highs in the Summer, and while Sturm Ruger (RGR) has held up much better, it is still down 20% from its high. Read Bespoke’s most actionable market research by joining Bespoke Premium today! Get started here.


Bespoke Brunch Reads: 10/3/21
Welcome to Bespoke Brunch Reads — a linkfest of the favorite things we read over the past week. The links are mostly market related, but there are some other interesting subjects covered as well. We hope you enjoy the food for thought as a supplement to the research we provide you during the week.
While you’re here, join Bespoke Premium with a 30-day free trial!
Conflicts of Interest
131 Federal Judges Broke the Law by Hearing Cases Where They Had a Financial Interest by James V. Grimaldi, Coulter Jones and Joe Palazzolo (WSJ)
More than 685 lawsuits heard between 2010 and 2018 involved judges that had an explicit financial conflict due to ownership of stocks impacted by the suits. [Link; paywall]
Kaplan Steps Down as Dallas Fed Chief, Hours After Rosengren by Catarina Saraiva and Craig Torres (Bloomberg)
After revelations that two different regional Fed Presidents traded individual stocks during 2020 and called their objectivity into question, both have stepped down within hours of each other. [Link; soft paywall]
Investing Business
Fidelity Brings Fractional Share Trading to Advisors by Diana Briton (Wealth Management)
RIA custody clients of Fidelity will get the ability to trade fractional shares for their clients across both single stocks and ETFs. Custody clients will get the benefit slightly later. [Link]
Franklin to Buy Custom Indexing Firm O’Shaughnessy to Help Personalize Portfolios by Justin Baer (WSJ)
Asset management giant Franklin Resources is betting on custom indexing, buying a modest asset manager whose core strength is a technology platform that allows investors to create and get exposure to custom indices. [Link; paywall]
University Endowments Mint Billions in Golden Era of Venture Capital by Juliet Chung and Eliot Brown (WSJ)
Numerous colleges saw their endowments gain more than 50% in the year ended June as favorable base effects and huge returns from venture investing sent the value supporting private colleges to their best years on record. [Link; paywall]
Downfall
Graveyard of the bikes: Aerial photos of China’s failed share-cycle scheme show mountains of damaged bikes (Straits Times)
The explosive growth of bike sharing programs in China didn’t lead to the sort of permanent demand that had been expected and the result is massive “graveyards” for scrapped bikes which are discarded when riders don’t turn up. [Link]
The Ancient People Who Burned Their Culture to the Ground by Blair Mastbaum (Atlas Obscura)
A pre-Roman society in Spain that was one of the most developed and powerful in the region is being unveiled by a site in Extremadura that suggests a self-destructive end. [Link]
TV
Why Is Every Young Person in America Watching ‘The Sopranos’? by Willy Staley (NYT)
A wandering investigation of why so many younger Americans – many far on the political left – are jumping into The Sopranos. The show is less about the Mafia, and more about American decline, or so many new enthusiasts argue. [Link; soft paywall]
How Peyton and Eli Manning Are Changing Television by Jason Gay (WSJ)
Three weeks in to the NFL season, ESPN’s experimental Manning-only version of their Monday Night Football broadcast has achieved rave reviews for its Twitch-like approach to covering sports. [Link; paywall]
Inflation & Shortage
An Obscure Chinese Mining Law Is Hobbling Global Energy Security by Alfred Cang (Bloomberg)
Back in March, Chinese coal miners faced stepped-up requirements for miner safety, which has made it harder to expand production of the critical energy resource. Tighter climate enforcement has also played a role, but this key factor has flown further under the radar. [Link; soft paywall]
Dollar Tree to Sell More Items Above $1 as Costs Rise by Sarah Nassauer (WSJ)
Famous for selling nothing at more than a single dollar bill, Dollar Tree has decided to shift strategy amidst supply chain costs and high demand. Previously the chain had experimented with higher-dollar items, but this latest choice is a more widespread one. [Link; paywall]
The Return of Empty Shelves and Panic Buying by Andrea Felsted (Bloomberg)
Supply chain snarls have left some grocery shelves empty in a vibe reminiscent of pandemic panic buying back in March and April of 2020. COVID restrictions around the world are also playing a role. [Link; soft paywall]
COVID
Merck to seek emergency US approval of oral COVID treatment by Will Feuer (NYPost)
Clinical trials for a 5 day course of pills designed to fight COVID severity went so well that the trial was discontinued in order to give all participants the drug. It appears to prevent hospitalization entirely. [Link]
Newsom orders COVID vaccines for eligible students, the first K-12 school mandate in nation by Howard Blume, Rong-Gon Lin II, and Taryn Luna (LAT)
All eligible school children in the country’s largest state will be required to receive COVID vaccinations per a mandate from Governor Gavin Newsome on Friday. [Link]
Real Estate
Squamish Nation moves Vancouver forward with transformative Senakw project by Kenneth Chan (Daily Hive)
Frustrated by anti-development elements in Vancouver, the Squamish Nation is using its special legal status to opt out of approval by the city government, giving the stiff-arm to anti-housing advocates and introducing 50+ story residential towers to Kitsilano. [Link]
Fedcoin
Analysis: U.S. Fed navigates policy minefield with impending digital dollar report by Jonnelle Marte and Michelle Price (Reuters)
The Fed is due to release a report exploring adoption of a digital dollar not reliant on bank liabilities like deposits. Some helpful background explains how the central bank is likely to come down on the issue in this read. [Link]
Emissions
Electric Cars Have Hit an Inflection Point by Robinson Meyer (The Atlantic)
After years of slowly building momentum, EV adoption and production have reached a point of critical mass. Climate subsidies and charging network rollouts well help smooth the process, but even without more state support the shift towards zero emission driving is here to stay. [Link]
Hole in the ozone layer widens as recovery remains in the distance by Camilla Hodgson, Claire Buchan and Steven Bernard (FT)
While the end of CFC use means that the ozone layer will repair itself over time, this year has still seen a record large gap in UV protection over Antarctica. [Link; soft paywall]
Irrational Investors
Individuals Embrace Options Trading, Turbocharging Stock Markets by Gundan Banerji (WSJ)
Retail investors continue to sway markets, with options the latest space to get large flows of retail trading that was scarce or inconsistent only a few years ago. [Link; paywall]
MIT Study Finds Older Men Are More Likely to Panic Sell Stocks (Bloomberg/The Wealth Advisor)
Three critical factors made investors more likely to dump stocks during selloffs: being male, being over the age of 45, being married, or having a self-described “excellent” level of investment experience. [Link]
Texas
JPMorgan’s Texas Muni Work Becomes Latest Culture War Fallout by Amanda Albright and Danielle Moran (Bloomberg)
Texas laws designed to punish private companies for taking stances on certain political questions will shut JP Morgan out of the $58bn Texas muni underwriting market. [Link; soft paywall]
Read Bespoke’s most actionable market research by joining Bespoke Premium today! Get started here.
Have a great weekend!
The Bespoke Report Newsletter — 10/1/21
This week’s Bespoke Report newsletter is now available for members.
September 2021 ended with a thud this week with the S&P 500 falling 1.2% on the last trading day of the month. The turn of the calendar to October marked a turning point for the market as well, as the S&P rose 1.15% on the first day of the month to close out the trading week. This week’s Bespoke Report looks closely at the recent action in leading groups and sectors like the semiconductors and the transports. We also check in on the economy as the Delta wave recedes. There are a ton of insights on both markets and the economy in this week’s newsletter, and you can read it now with a two-week trial to our subscription service — Bespoke Premium. Click here to learn more about Bespoke Premium and start a two-week trial if you’re interested.


Mega Caps Underperforming as Energy Explodes
In November of last year, we took a look at the performance spread between the equal and market cap weighted versions of the S&P 500. The chart below provides an update through the end of September where positive readings indicate outperformance of the equal-weight S&P 500 and negative readings indicate outperformance of the market cap weighted index. In March 2020, as the market was plunging from the February peak and bottoming towards the end of the month, mega-caps such as Apple (APPL), Microsoft (MSFT), Alphabet (GOOGL), Amazon (AMZN), and Facebook (FB) significantly outperformed the broader market, resulting in a 5.68 percentage point spread between the return of the equally weighted and market cap weighted S&P 500. Whereas the equal-weighted index declined 18.19% in March 2020, the market cap weighted index dropped ‘just’ 12.51%. In a reversal of these trends, the equal-weighted index outperformed between the months of September 2020 and March 2021, rallying 30.84% while its market cap weighted counterpart gained 18.14%. Over these months, there was a maximum monthly spread of 3.37 percentage points in favor of the equal-weighted index, which occurred last December. In recent months, mega-caps briefly took back the reins before the trend reversed in September when the equal-weighted index outperformed by 0.82 percentage points.

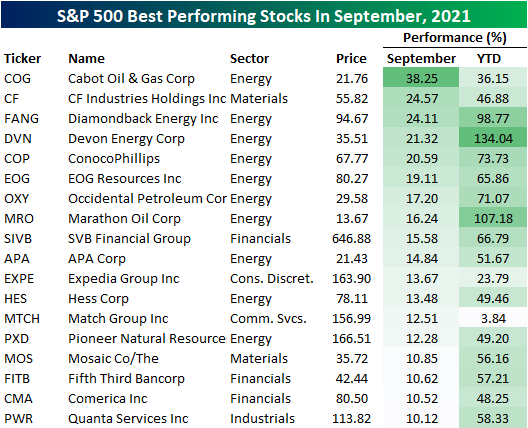
With the month of September behind us, the table below lists the 18 stocks in the S&P 500 that finished the month up over 10%, and less than a quarter of the stocks in the index (22%) finished the month higher. Overall, the average performance of stocks in the index was a decline of 3.7 percentage points. While short-term performance has been weak, on a YTD basis, 81.42% of S&P 500 stocks are up on the year, and the overall average gain is 18.90%. Of the stocks that have rallied 10%+ in September, more than half are from the Energy sector and another three come from the Financials sector. Click here to view Bespoke’s premium membership options.
Q3 Asset Class Performance
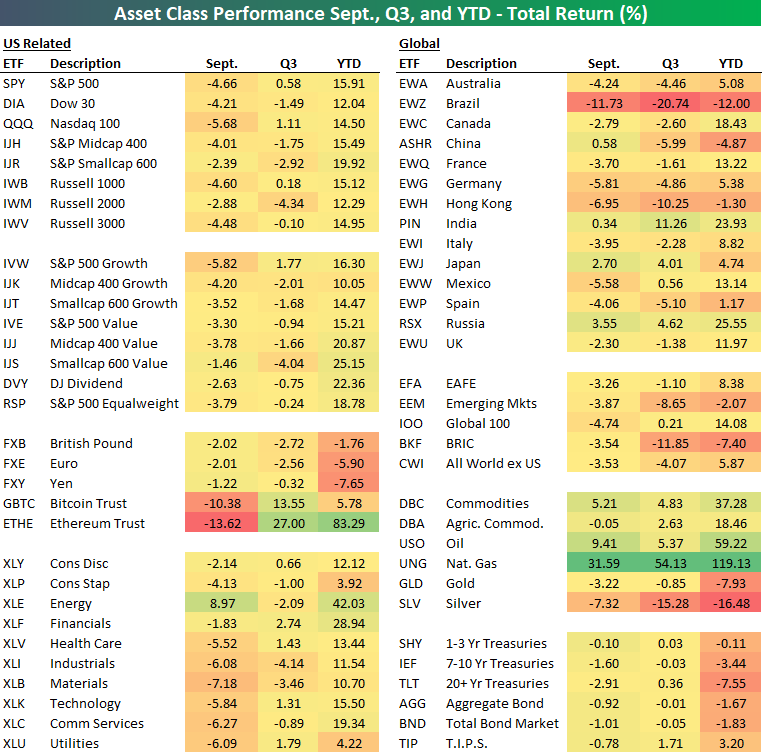
Q3 and the month of September are now in the books, and it was not a great period for US equities. As shown in our asset class performance matrix below, the sole portion of the US equity market that was higher in September was Energy stocks. Every other sector, theme, and major index was lower on the month. As for global equities, performance was more mixed with declines ranging from 11.73% for Brazil (EWZ) to a 3.55% gain for Russia, though, most country ETFs were lower on the month.
Commodities had a good month particularly in the energy space with crude oil (USO) gaining 9.41% and Natural Gas (UNG) rising an astounding 31.59%. That lifted the total gain in Q3 to 54.13% while it has returned almost 120% year to date; the best performer for both time periods. Precious metals, namely silver (SLV), on the other hand, was hit particularly hard. As for cryptos, Ethereum (ETHE) was another top performer YTD and in Q3, but September pared those gains. ETHE fell 13.62% in September while Bitcoin (GBTC) also fell by double-digit percentages. Click here to view Bespoke’s premium membership options.
Bearish Sentiment Back Above 40%
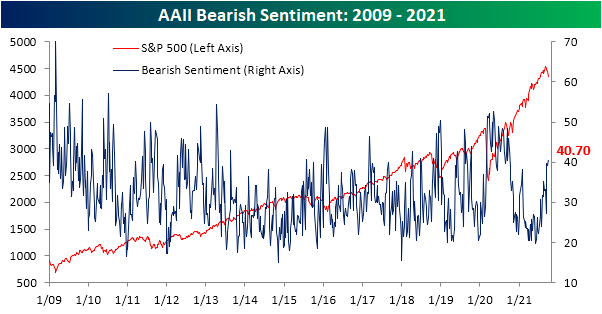
As the S&P 500 continued to decline over the past week, survey results from the American Association of Individual Investors have shown investor sentiment has taken a more negative tone. 28.1% of respondents this week reported as bullish versus 29.9% last week. While lower, that is still several percentage points above the recent low of 22.4% from a couple of weeks ago.

Bearish sentiment picked up the bulk of those losses to bullish sentiment as 40.7% reported pessimistic sentiment this week. That is the highest reading in exactly a year. With bearish sentiment having risen by 13.5 percentage points since the low of 27.2% in the week of September 9th, it is now a full standard deviation above its historical average of 30.55%.
Even though bearish sentiment came in at a new high, the bull-bear spread was only slightly lower at -12.6. That is still above the low of -16.9 from two weeks ago.

Bearish sentiment did not pick up all of the losses to bullish sentiment either. Neutral sentiment was also slightly higher this week gaining 0.2 percentage points.

Other readings on sentiment are also echoing the decline in optimism. One other sentiment indicator, the National Association of Active Investment Mangers’ Exposure Index, has also seen a significant drop this week. This index shows how exposed managers are to equities with a reading of 200 being the max and meaning respondents are leveraged long whereas -200 would be leveraged short. A reading of +100 (-100) would indicate managers are full long (short), and a reading of zero would indicate they are market neutral. The index has fallen in back-to-back weeks now with this week seeing a 22.68 point drop to the lowest level since May. That week over week change also ranks in the bottom 5% of weekly moves going back to the start of the data in 2006, although there have been a handful of similar if not larger drops in the past year like a 26.98 point decline in mid-August and a 40.93 point drop back in May. Now at 55.02, the index indicates managers have stepped back and are far less exposed to equities than they have been for most of the past year. Click here to view Bespoke’s premium membership options.

Pandemic Claims Evaporate
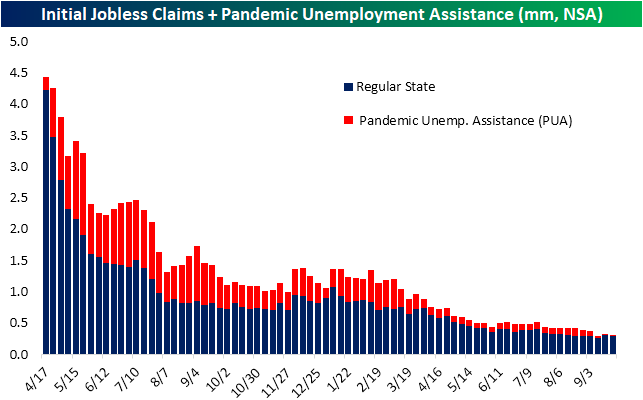
This week’s initial jobless claims number disappointed with a surprise increase to 362K rather than the anticipated 21K decline to 330K. After that increase, claims are at the highest level since the first week of August when total adjusted claims were 15K higher at 377K.

While seasonally adjusted claims were disappointing, the unadjusted number actually improved week over week falling back below 300K. Albeit lower, claims are still off their low of 265.9K from two weeks ago which could be expected given the seasonal tendency for claims to rise at this time of year. With the program’s official end date now a few weeks in the rearview, PUA claims remain muted, but there was actually an increase of early 2K this week.
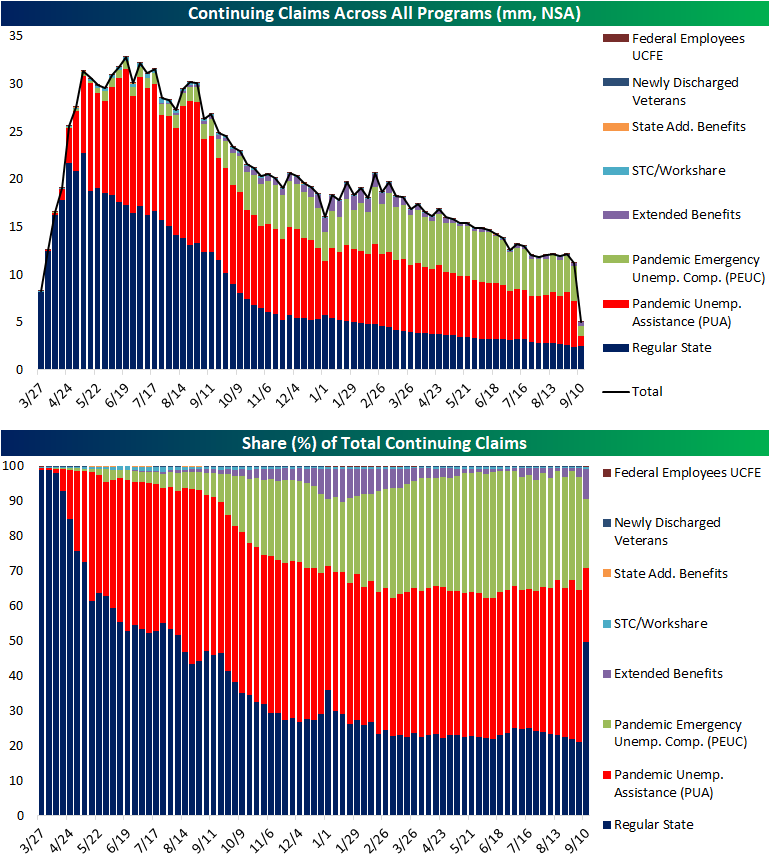
Seasonally adjusted continuing claims fell this week to 2.802 million. Although lower, that was not as large of a decline as expected. That makes for the second-lowest reading of the pandemic outside of the first week of September when continuing claims came in at 2.715 million.

On a non-seasonally adjusted basis and including all auxiliary programs creates a couple of weeks of lag to the data making the most recent reading through September 10th. That was the first week of data to encapsulate the end of pandemic programs, and the drop was significant. Total claims across all programs were more than cut in half falling 6.22 million to 5.03 million. As could be expected, declines in PUA and PEUC claims drove that decline with the two programs shedding a combined 6.49 million claims. That being said, these two programs still have a total of over 2 million claims left on the table and likely to fall off over the coming weeks. Click here to view Bespoke’s premium membership options.
How Has the 10 Year Yield Historically Correlated to Growth Stock Performance?
Recently, all it seems investors can talk about is the relationship between the performance of growth stocks and interest rates. The general idea is that rising yields have a negative impact on the performance of growth stocks as the risk-free rate of return increases and future cashflows for high-growth companies are discounted at a higher rate. To highlight this relationship, today we wanted to take a look at a comparison between the relative strength of the Vanguard Mid Cap Growth ETF (VOT) versus the Vanguard Value ETF (VOE) versus the yield on the 10-year US Treasury.
Looking first just at the relationship between the two this year, the chart below shows the relative strength of growth vs value (blue line) compared to moves in the 10-year US Treasury (red line). When the blue line is rising, it indicates that growth stocks are outperforming value and vice versa. For pretty much the entire year, when yields have moved higher, growth stocks have underperformed, but when yields have pulled back, growth stocks start to lead the market. Over the last several days, the inverse relationship has been even more pronounced where the two lines have completely moved in the opposite direction. For this year at least, higher interest rates have been kryptonite for growth stocks.

The chart below is the same as above but goes all the way back to 2010 instead of just this year. Looking at the chart, while there were periods of inverse correlation in the early and mid-2010s, the trend really didn’t fully take hold until late 2018/early 2019. Since then, when rates have fallen, growth has outperformed and vice versa.

The inverse correlation has reached extreme levels this year. The chart below shows the correlation coefficient between the daily ratio of the VOT (mid-cap growth) versus VOE (mid-cap value) versus the yield on the 10-year US Treasury. Since 2010, there have been five years where the correlation coefficient was positive and in only three of those years was the positive reading anything more than negligible (2012, 2015, and 2018). In each of the past three years, what we’ve seen is the inverse correlation only intensify. Back in 2019, the only other year before that where the inverse correlation was more pronounced was in 2016, but then 2020 saw what was at the time the most inverse correlation since 2010. Based on this year’s relationship, though, 2020’s record may not last long. Through Tuesday’s close, the correlation coefficient between the relative strength of growth stocks and the 10-year yield was -0.87. While the inverse relationship between growth stock performance and interest rates may not continue to be as pronounced as it is now in the future, any continued increase in long-term interest rates is likely to act as a headwind for the performance of growth stocks. Click here to view Bespoke’s premium membership options.

Richmond Back in the Red
The fifth and final manufacturing survey for the month of September from the regional Federal Reserve banks was released this morning, and it did not end the month on a high note. The Richmond Fed’s headline reading fell into contractionary territory this month for the first time since May 2020 as the index dropped 12 points month over month falling from +9 down to -3. Relative to all the other regional Fed reports, Richmond only Richmond reported contraction in September.
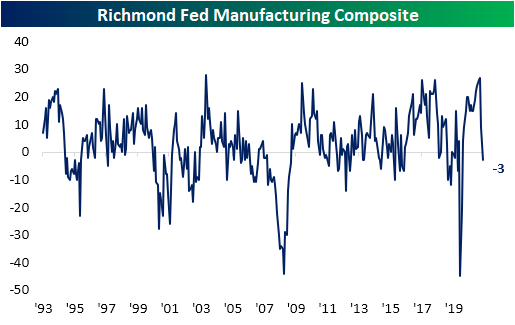
The 12 point decline month over month in the headline reading was significant ranking in the bottom 5th percentile of all monthly moves. But it was actually a smaller decline than last month when the index dropped 18 points. Regardless, the 30-point combined decline over the past two months is the second largest on record behind the 38 point drop in April of last year.
Factoring into that headline weakness, most of the categories of the report were also lower month over month. Given those declines, most readings are also now in the bottom end of their historical ranges with some exceptions. Order Backlogs, Vendor Lead Times, Equipment and Software Expenditures, Employees, Wages, and price indices are all still in the upper decline of readings.
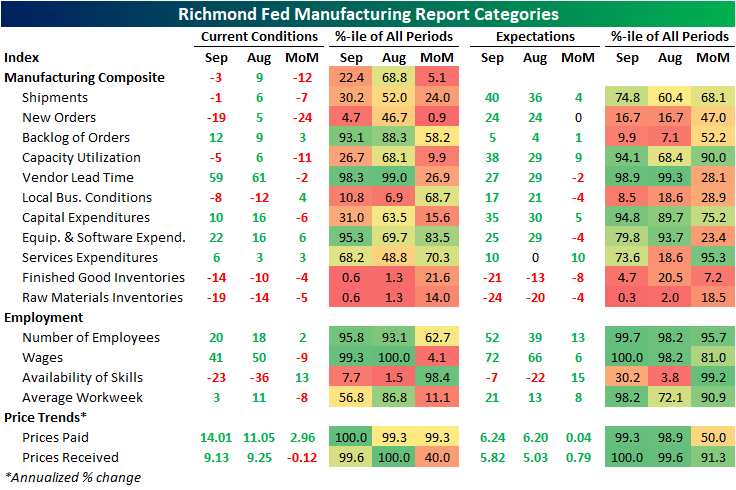
By far the largest decline in September was for New Orders. That index plummeted 24 points versus August for the fourth-largest decline on record and putting the index in the bottom 5% of its historical range. In other words, demand slammed on the brakes in September. In spite of that decline, expectations have held up relatively well at 24; unchanged month over month. Shipments also fell into contraction albeit less dramatically. Meanwhile, Vendor Lead Times improved as the index fell 2 points, but that remains an extremely elevated reading indicating continued pressures on supply chains.

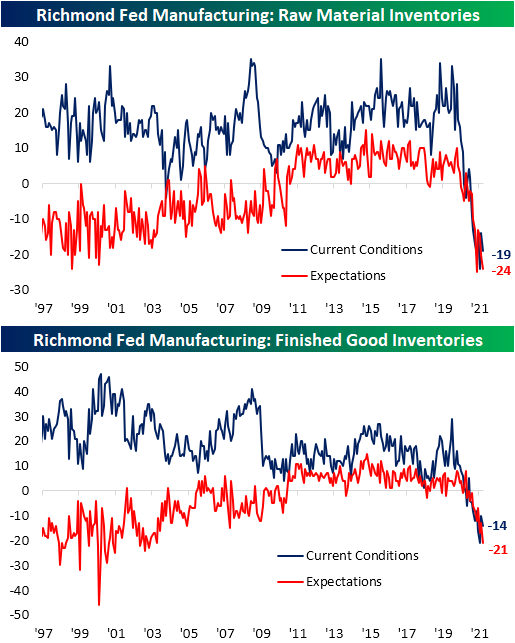
One potential reason for shipments having pulled back is a complete lack of inventories. Both readings on raw materials and finished good inventories fell month over month and are at historically depressed levels across both current conditions and expectations.
Indices tracking employment were perhaps the healthiest area of the report. The index tracking the Number of Employees edged higher to 20 while expectations saw an even larger jump, stopping just short of a record high. Wages, meanwhile, declined 9 points from a record high. That reading is still the third-highest on record, though, and expectations were at a record high. While the Average Workweek index was also lower MoM, there has been another improvement in the number of firms reporting a lack of availability of skilled workers.

The other area of the report to touch records this month concerned prices. Prices paid came in at a new high with prices increasing 14% annualized. Prices Received were slightly lower at 9.13%, but that is well above other readings throughout the survey’s history and the expectations index set another record. Click here to view Bespoke’s premium membership options.

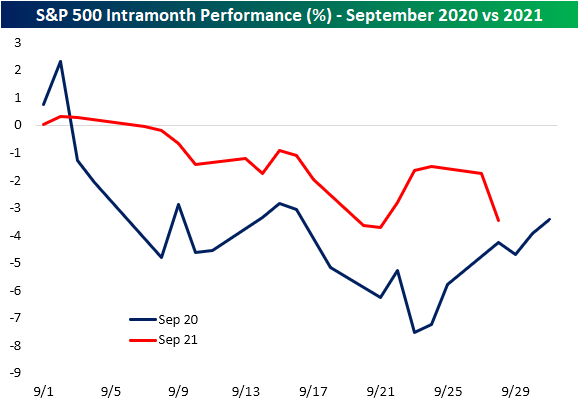
September 2020 vs 2021
September 2nd of last year marked a notable turning point for the US equity market. The S&P 500 put in a short-term peak on that date and it also marked the beginning of what we dubbed “The Big Shift”. That shift was marked by the outperformance of value over growth and solid breadth with the equal-weight S&P 500 outperforming the market-cap weighted index. Fast forward one year, and yet again the close on September 2nd has marked the recent high for the S&P 500 as shown below. In addition to the highs coming on the same day, some of the intra-month patterns are also similar including a small rally in the middle of the month. With that said, the declines last year were more severe, especially at the start of the month, and this year has not seen a consistent rally into month’s end as was the case in 2020.
As previously mentioned, one of the most notable changes of the Big Shift last September 2nd was a reversal of a long-term trend of growth’s outperformance. Growth’s outperformance versus value peaked on September 2nd last year, and it also peaked in early September this year as well. Below is a chart showing the relative strength of growth versus value since the COVID Crash low for the broad market last March 23rd. A rising line means growth is outperforming, while a falling line means value is outperforming. The months of September 2020 and September 2021 (through 9/28) are highlighted in red. As you can see, growth peaked versus value at the beginning of September of both 2020 and 2021 after a period of sharp outperformance in the months prior. September 2020 was only the start of value’s outperformance, which continued up until this spring when growth began to outperform again. It remains to be seen if the same “value” trade will now continue in the months ahead like it did last year, but it’s certainly interesting how similar the growth/value trade has been this September versus last September. Click here to view Bespoke’s premium membership options.
