Sovereigns Soar
All around the world, government bond yields are on the rise and hitting some significant levels. In many cases, the rapid increase in yields over the past month has resulted in multi-month, if not multi-year, highs. For Spain and Italy, today’s level of yields are the highest since May and June 2020, respectively. The 10 year US Treasury yield has reached the highest level since January 2020 as Canada, France, the UK, and Germany meanwhile have the highest yields since the spring of 2019. In the case of Germany, the bund yield even moved back into positive territory for the first time since 2019. As the 10-year yield on Swiss bonds has reached the highest level since the fall of 2018, it too has moved back into positive territory in recent weeks. While it has also seen a big rise in yields, Brazilian bond yields remain further off of prior highs.
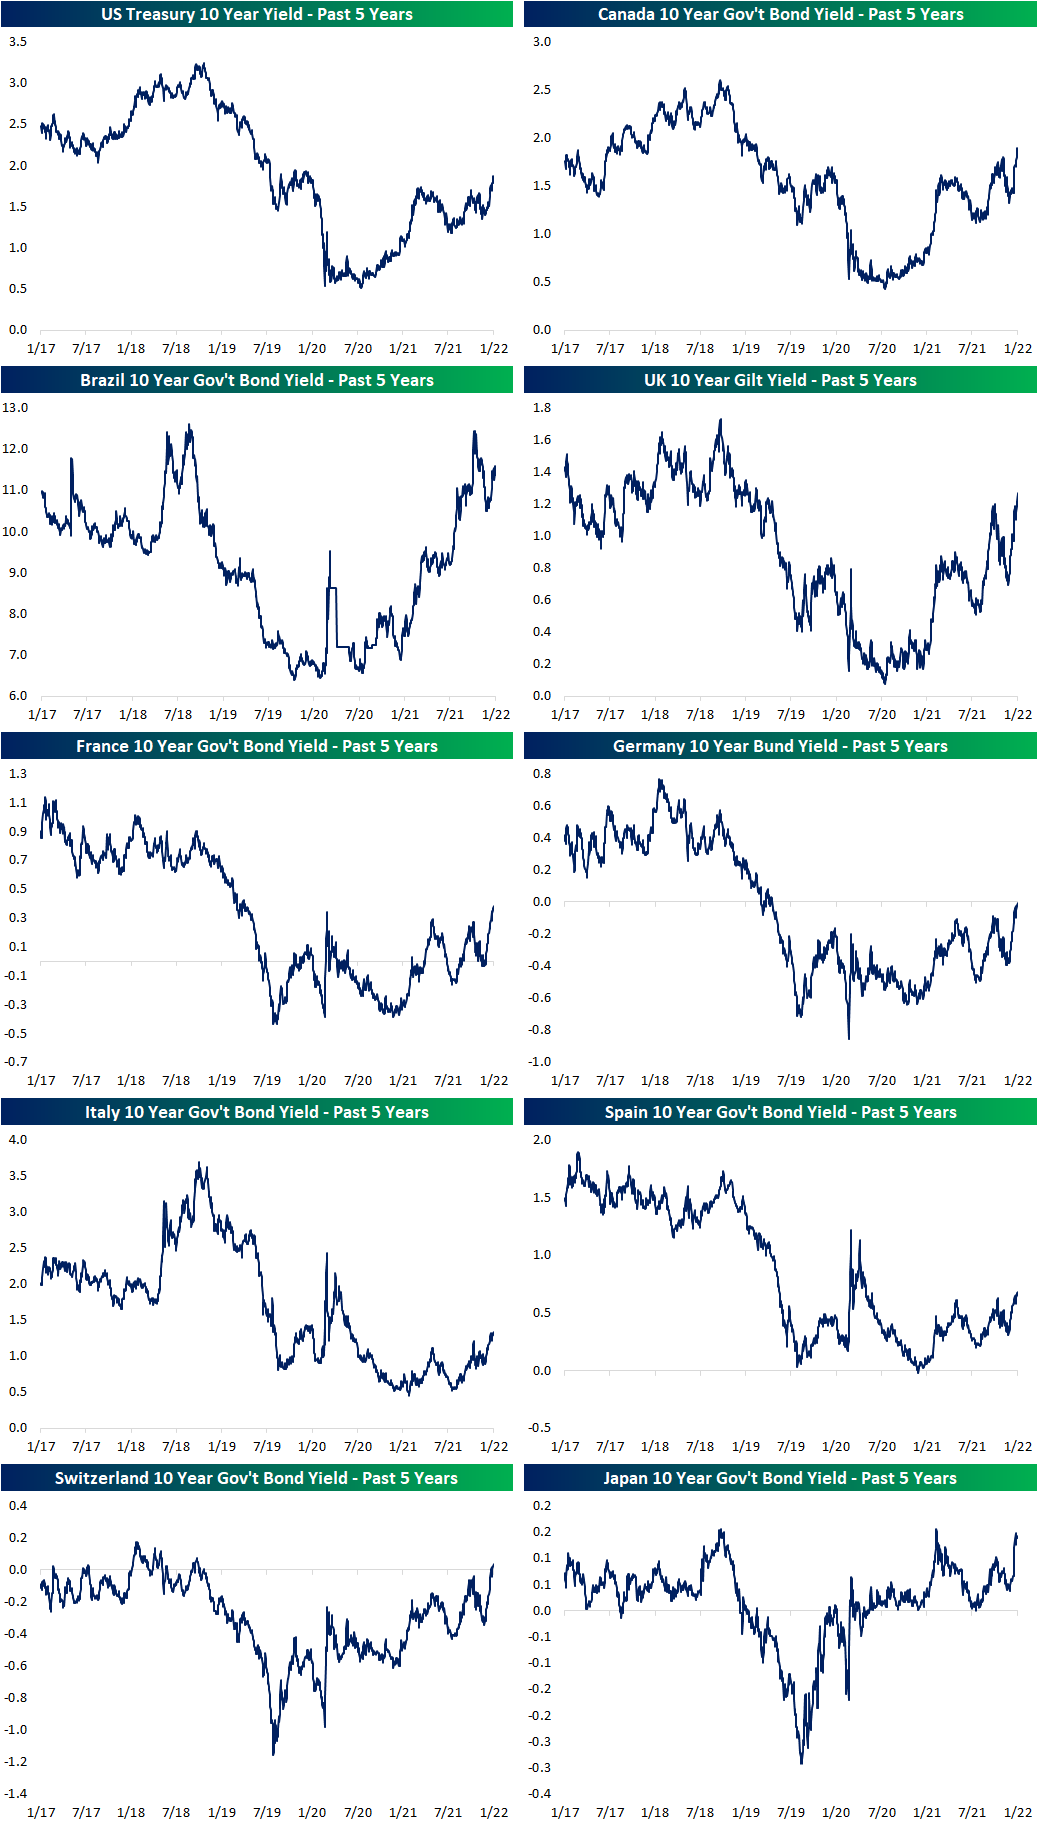
As previously mentioned, the broad move in yields in the past month has been rapid. In the charts below, we show the one-month change in the 10-year yields for these countries’ bonds going back over the past five years. In most cases, the current run has been the sharpest increase since around the time of the COVID crash. For each country shown, those one-month changes also rank in the top few percent of all monthly changes over the past two decades. In fact, for Canadian bonds and UK Gilts, the moves rank in the top 1% of all monthly moves over the past twenty years. In today’s Fixed Income Weekly, we take a closer look at the moves in yields for a range of countries, and the implications for foreign exchange. Click here to view Bespoke’s premium membership options.

Energy Exploding (Relatively Speaking)
To help get a gauge on which sectors are out- or underperforming the broader market, in the charts below, we show the relative strength lines of each of the eleven sectors versus the S&P 500 over the past year from our Sector Snapshot. Market trends in the prior days and weeks have resulted in some notable moves across these relative strength lines.
With Consumer Discretionary one of the weaker sectors of late as high growth areas have gotten hit hardest, its relative strength line has broken below its most recent low. While Consumer Discretionary has broken down on a relative basis, Communication Services, which has seen a massive string of underperformance since the summer, has seen a modest reversal higher, although the steep downtrend of the relative strength line is still in place.
The Tech sector has also seen a breakdown in its relative strength line recently with a collapse in the past month. Conversely, Real Estate has held onto its uptrend with its relative strength line bouncing over the past couple of days.
Consumer Staples, Financials, and Industrials, meanwhile, have been in downtrends over most of the past year. The recent strength of Staples and Industrials have broken those downtrends materially while Financials have failed to break out in the past several days after a big leg higher in the preceding weeks. Utilities similarly has failed to move out of its downtrend. At that same time, Energy has essentially made a vertical move higher after what was generally a sideways move in the past year.

The last couple of years has certainly seen a strong run for the Energy sector, but taking a longer-term look at performance relative to the broader market it is hard to tell. In the chart below, we show the relative strength line of the Energy sector versus the S&P 500 starting on 7/1/08, when the ratio of the sector to the S&P 500 hit its all-time high. As shown, there has been secular underperformance from Energy stocks since the Global Financial Crisis which hit its most extreme level during the COVID crash. Since the lows in the spring of 2020, the Energy sector has rebounded, and the relative strength line is at some of the highest levels in the past couple of years, but there is still a long way to go in order to break the longer-term downtrend. Stay on top of market trends by becoming a Bespoke subscriber today. Click here to view Bespoke’s premium membership options.

Decimated Demand Drops Empire Fed
The new year’s first regional manufacturing reading came out of New York this morning. Covering the month of January, today’s Empire Manufacturing report was outright bad at the headline level. While the December reading was at the high end of the post-pandemic and historic range (in the 95th percentile of all months), the January reading was far weaker falling into the bottom quartile of historic readings. At -0.7, it was the first contractionary reading for Empire Manufacturing in eighteen months (since June 2020). That 32.6 point drop was also the third-largest month-over-month decline on record behind March and April 2020.

Looking under the hood of the report, the massive drop in general business conditions is to a certain extent misleading and there is nuance to the various categories. Breadth was in fact bad indicating a broad deceleration in activity across categories, but the massive drop in general business conditions was largely due to a massive slowdown in demand. Like the headline number, both the indices for New Orders and Shipments fell dramatically. Alongside General Business Conditions, only New Orders saw a contractionary reading on that move. Again, other areas of the report did not help the headline index with only Inventories rising month over month. That being said, current levels remain far more elevated for those other categories with many in the upper decile of their historical ranges.

The decline in New Orders points to demand falling for the first time since August 2020. As a result, Unfilled Orders also fell significantly as Inventories rose, but the readings remain much healthier in the 93rd and 95th percentiles, respectively. In other words, even though there wasn’t the same massive inflow of orders as we’ve seen over the past year and a half, there is still plenty of demand left to be fulfilled. Unfortunately, Shipments decelerated sharply and only increased slightly which could be a result of higher COVID case counts holding back production/fulfillment.

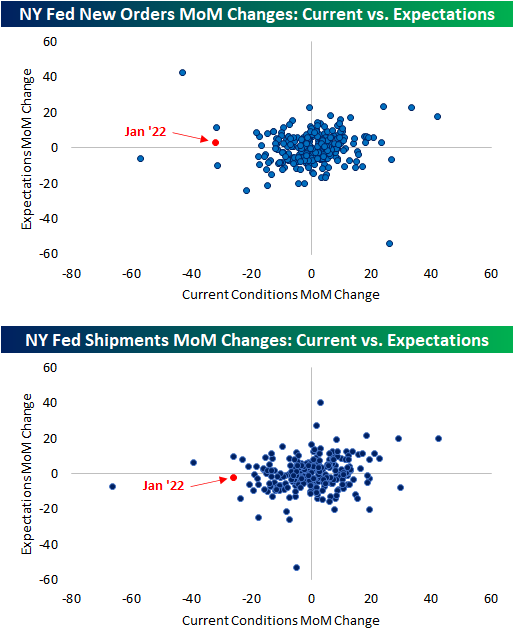
One interesting aspect to note for demand and shipments (and this also applies to the headline index) is the huge disconnect between the moves in current conditions and expectations. Expectations indices remain far healthier in comparison to current condition indices, and the drops, if any, were much more modest this month. In fact, in the charts below showing the month-over-month changes of all months on record between the two series, January was certainly an outlier month. A heavy burden from absentees as a result of COVID could be extrapolated as a reason for this disconnect. In other words, New York area firms were hit hard by COVID in January but they do not expect the current wave’s impact to last out through six months.
Even though New York area manufacturers were not seeing growth in the pace of getting products out the door as in past months, working in their favor has been a significant improvement in supply chains. Delivery times remain well above any period prior to the pandemic, but the index fell for the third month in a row.

Another more welcome sign of the report was that Prices Paid and Prices Received have both peaked. The drop in Prices Received was more significant of the two. On the downside, expectations have continued to rise unabated with each index hitting a record high.

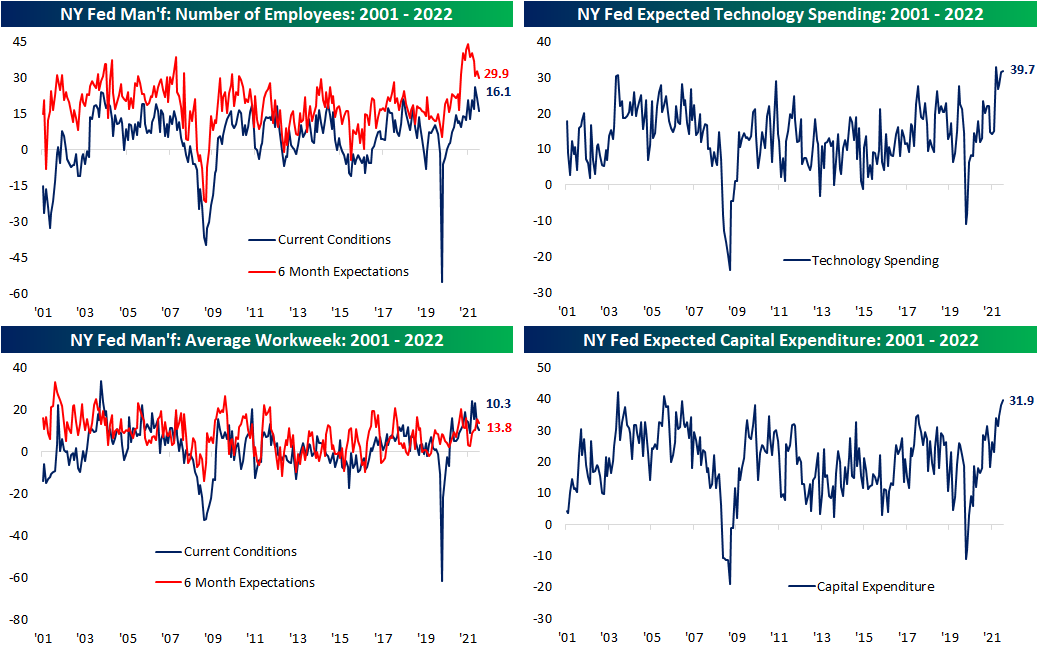
Hiring pulled back in January as did Average Workweek with the weakest readings since last August. Expectations for Number of Employees hit its lowest level since last February. Meanwhile, manufacturers plans for spending on Tech and Cap. Ex. is far more optimistic with January readings in the top 1% of all months on record. Click here to view Bespoke’s premium membership options.
Bespoke Brunch Reads: 1/16/22
Welcome to Bespoke Brunch Reads — a linkfest of the favorite things we read over the past week. The links are mostly market related, but there are some other interesting subjects covered as well. We hope you enjoy the food for thought as a supplement to the research we provide you during the week.
While you’re here, join Bespoke Premium with a 30-day free trial!
Politics
Flush With Cash, California Has Problems That Are No Quick Fix by Christopher Palmeri, Romy Varghese, and Laura Curtis (Bloomberg)
California has a budget surplus of nearly $50bn, California has lots of money to throw at a range of priorities which are steadily mounting, including homelessness and climate vulnerability. But lager problems, like a falling population and drought. [Link; soft paywall]
Women Legislators and Economic Performance by Thushyanthan Baskaran, Sonia R. Bhalotra, Brian K. Min, and Yogesh Uppal (SSRN)
The authors find areas that elect women to state legislative assemblies enjoy higher economic growth, with lower criminality and corruption, higher effectiveness, and lower political opportunism than their male counterparts. [Link]
Scarcity
A Simple Plan to Solve All of America’s Problems by Derek Thompson (The Atlantic)
Many of the economic problems of the last two years can be traced back to a failure to create abundance, which is easily attainable given American technology and productivity, but has not been the focus of policymaking or investment. [Link; soft paywall]
Supply-Chain Issues Leave New Homes Without Garage Doors and Gutters by Nicole Friedman (WSJ)
The ever-rising number of uncompleted homes is being driven by bottlenecks for a relatively small and inexpensive number of components which are preventing final completions of mostly-constructed new units. [Link; paywall]
COVID
Coronavirus Can Persist for Months After Traversing Body by Jason Gale (Bloomberg)
A new study reviewing autopsy results for 44 patients who died after contracting the virus reveals how serious infections can let the virus in to every one of the body’s organ systems. [Link; auto-playing video, soft paywall]
Cannabis compounds stopped COVID virus from infecting human cells in lab study by Kanoko Matsuyama (Fortune)
A new study shows that two different compounds fund in hemp may prevent COVID from entering in to human cells, making them a potential treatment for the disease. [Link; soft paywall]
Multiple Sclerosis
Longitudinal analysis reveals high prevalence of Epstein-Barr virus associated with multiple sclerosis by Bjornevik et al (Science)
A landmark study of US military personnel identifies the Epstein-Barr virus (which causes mononucleosis) as an extremely likely cause of multiple sclerosis. The study shows a 32-fold increase in risk of developing MS after infection with Esptein-Barr. [Link; paywall]
Trucks
Tesla Cybertruck Is Delayed Again, This Time Indefinitely by Nick Yekikian (Edmunds)
After being announced in 2019, Tesla expected its pickup truck to start deliveries by the end of 2021. But now the company has removed references to 2022 deliveries from its site, and nobody knows when the actual release will come. [Link]
Extreme RVs Grow Bigger, Bolder With Younger Consumers by Hannah Elliott (Bloomberg)
Glamping, meet tramping: adventure-seeking younger car buyers are leaving civilization and buying increasingly large and well-equipped vehicles to do it. [Link; soft paywall]
Fads
These TikTok Stars Made More Money Than Many of America’s Top CEOs by Josephy Pisani and Theo Francis (WSJ)
The highest-paid personalities on Tik Tok earn tens of millions per year, making them much better-paid than most large publicly traded companies. [Link; paywall]
Wordle Is a Love Story by Daniel Victor (NYT)
A once-a-day word guessing game has exploded in popularity, turning an idle side project for a Brooklyn software engineer into an obsession for hundreds of thousands of users. If you’d like to try your luck, you can play the game here. [Link; soft paywall]
Investors are paying millions for virtual land in the metaverse by Chris DiLella and Andrea Day (CNBC)
Real estate in the metaverse is selling for millions as investors eagerly anticipate a gold rush of users into virtual environments. [Link]
Economics
Don’t Extrapolate From This Fake Business Cycle by Dario Perkins (TS Lombard)
An argument that the data on the current economy is totally unique, with convincing arguments as to why the pandemic era is not a good indicator of longer-term economic trends or trajectories. [Link]
Climate Change
The 100th Meridian, Where the Great Plains Begin, May Be Shifting by Kevin Krajick (Columbia Climate Society)
The barrier between the humid, fertile east and the arid, dry west has historically run north-south along the 100th meridian. But desertification and climate change may be starting to shift that divide to the east, changing crop yields and drying out the plains. [Link]
Network Effects
Why Apple’s iMessage Is Winning: Teens Dread the Green Text Bubble by Tim Higgins (WSJ)
Younger mobile users fear being branded with the green bubble, illustrating the extremely strong network effects of the iMessage and broader iOS ecosystem Apple controls. [Link; paywall]
Read Bespoke’s most actionable market research by joining Bespoke Premium today! Get started here.
Have a great weekend!
Bulls Back Off
The past week has seen the S&P 500 pull back to retest its 50-DMA which has put a dampener on investor sentiment. This week’s AAII survey showed that less than a quarter of respondents reported bullish sentiment. That is down from 32.8% last week and the lowest since 9/16.
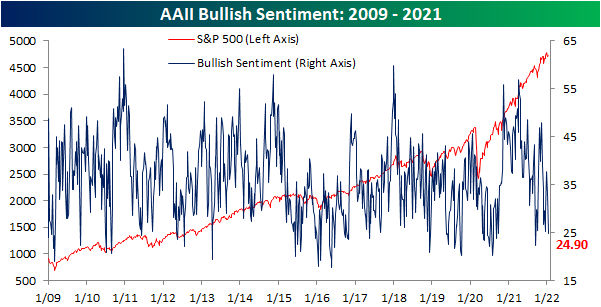
Bearish sentiment picked up most of the difference rising five percentage points to 38.3%. This brings bearish sentiment to a fairly elevated level relative to its historical average of 30.56%, though, it is still within a standard deviation of that reading. While higher, this week’s increase was actually only the biggest uptick and highest level of bearish sentiment since the week of 12/16.

Given those moves in bullish and bearish sentiment, the bull-bear spread has fallen deeper into negative territory. At -13.4, the spread is now at the lowest level since mid-December.

Whereas bearish sentiment jumped 5 percentage points this week, neutral sentiment has gained 5 percentage points after the back-to-back increases over the past two weeks. Neutral sentiment now stands at 36.8% which is the highest level since 12/9.

As for other sentiment readings, both the Investors Intelligence survey and NAAIM Exposure index took more bearish tones in the most recent week. As a result, our Sentiment Composite, which combines the bull-bear spreads of the AAII and Investors Intelligence surveys with the NAAIM exposure index’s reading, has fallen back below zero meaning overall sentiment is broadly bearish, but not to a degree in which it is outside the range of recent readings. Click here to view Bespoke’s premium membership options.

Seasonal Peak in Claims
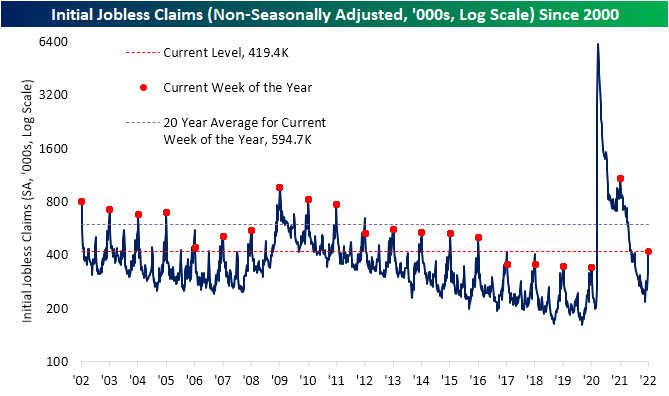
After hitting multi-decade lows at the beginning of December, initial jobless claims have been on the rise with the most significant increase in that time occurring in the latest week. The seasonally adjusted reading increased by 23K to 230K this week which is the highest level since the week of November 12th. While there has not been much improvement in claims in the past month, current levels are still right around those from just before the pandemic. On a longer-term basis, these readings are also some of the strongest since the early 1970s.

On a non-seasonally adjusted (NSA) basis, the current week of the year typically marks a seasonal peak in claims. In fact, the current week of the year has historically seen claims rise 85.2% of the time week over week. As such, NSA claims surged over 100K this week from 315.8K to 419.4K. In spite of that seasonal headwind alongside the additional issue of rising COVID cases—which we cannot parse out how much each factor is contributing to the rise in claims—that was actually slightly below the average weekly change of 111.6K for the current week of the year. Of course, the current level of claims is a major improvement from where things stood this time last year, but it is still decently above levels from comparable weeks of the few years prior to the pandemic. Assuming this week marks the seasonal high as it has in the past, claims will now have tailwinds combating any COVID headwinds in the coming months.

Although initial claims were somewhat disappointing this week, seasonally adjusted continuing claims were very strong coming in at the lowest level since the week of 6/1/73. Claims by this measure are delayed an extra week to initial claims, but the most recent reading for the last week of 2021 showed only 1.559 million claims. The 194K week over week decline was the largest since mid-October when the reading fell by 241K. Click here to view Bespoke’s premium membership options.

Energy Stocks to Oil Ratio Below Average
Oil has had a strong start to the year thus far, and Energy has been the best performing equity-market sector on a year to date basis by a wide margin. This is due to the fact that the performance of the Energy sector (XLE) tends to be highly correlated to the price of oil, holding a correlation coefficient of 0.81. Currently, the ratio of the price of XLE versus oil is below historical averages. The current level is 0.77 and the average since XLE began trading is 0.99, suggesting there may be upside in the energy sector should oil hold its current levels. However, the ratio is still in a ‘normal’ range, as it is less than one standard deviation away from the historical average.

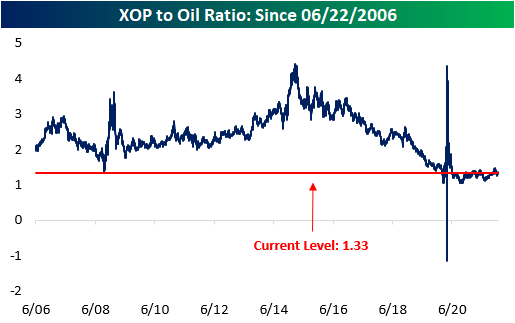
The Oil and Gas Exploration and Production industry (XOP) tends to be correlated with the price of oil as well (coefficient of 0.80). Historically, the ratio of XOP versus Oil has an average of 2.36, but the current level is far lower at 1.33. Additionally, the ratio is 1.7 standard deviations away from the average, which may imply that there is an opportunity to capitalize on a mispricing of XPO relative to the price of oil. However, since the start of 2020, the ratio has been suppressed and there is little evidence to suggest that this will change any time soon. Stay tuned as we will be releasing a deeper dive into oil tomorrow! Stay on top of market trends by becoming a Bespoke subscriber today. Click here to view Bespoke’s premium membership options.
As always, past performance is not a guarantee of future results. This is for informational purposes only and is not a recommendation to buy or sell a specific security.
Targeting Prices By Industry
Below we show how far the average stock is trading versus its consensus analyst price target by S&P 500 industry group. As shown, Media and Entertainment stocks are currently the most depressed versus price targets with the average stock in that industry over 20% below its target. That would indicate analysts either need to revise their targets far lower or those names need to rebound to catch up with expectations. On the other end of the spectrum, after a massive run for Consumer Staples stocks in the final months of 2021 and the first few days of this year, the average stock in that industry is actually above its price target. That is the only group in which that is the case, but Automobiles and Components, Food, Beverage, and Tobacco, and Bank stocks are all low single digit percentage points away from their price targets on average.

Given the sector’s massive weight, Tech is one area worth looking at, and under the surface, it is pretty split with regards to stocks’ current price and price targets. Technology Hardware and Equipment has rallied 23.64% since its recent October 4th low, retracing some of those gains this year. With such a rally over the past few months, the industry’s stocks have on average closed the gap on price targets. At the end of December, a little under half of the industry traded above its price target, and the average stock was only 2.3% away from its price target. Meanwhile, other areas of Tech like the Semiconductors and Software and Services have traded at more of a discount to where analysts believe they should be. Software and Services, in particular, has seen some of the weaker readings of the COVID era.


Consumer Staples and Financials have been two of the strongest performing sectors over the past couple of months. As could be expected given this, their stocks are relatively close to analyst price targets. For Consumer Staples, the Household & Personal Product industry is by far the strongest. While there are a small number of stocks in the industry (only six members), the average stock in this sector has actually traded above its target price the past two months and it ended December without a single stock below its target price.
Turning to the Financial sector, the Banks have put themselves ahead of the pack in a similar way. The average stock is only 3.25% below its price target compared to a 12.38% spread at the end of 2021. Additionally, in November and December there were no members of the industry above price targets, but today that number is nearly a third of the industry. Click here to view Bespoke’s premium membership options.

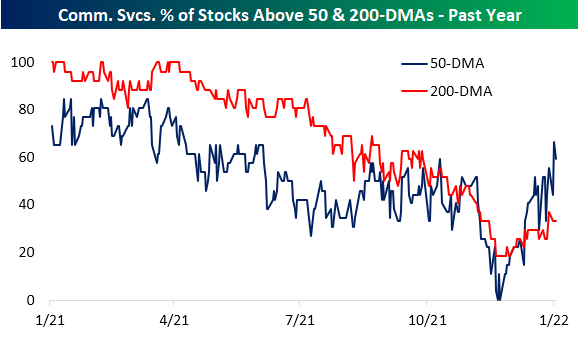
Communication Services Regaining Its Footing
In the past year, one interesting internal disconnect for the S&P 500’s Communication Services sector has been between price and breadth. By the time price peaked in the late summer, breadth, as measured by the cumulative advance-decline (A/D) line, had been trending lower for several months. In other words, in the middle of last year, an increasingly smaller number of stocks were pulling the sector higher. This past fall, bad breadth hit a climax as the cumulative (A/D) line started to collapse just after the sector’s price set a lower high. Since the recent low for both price and breadth in the first days of December, the two lines have been moving more in tandem with each other.
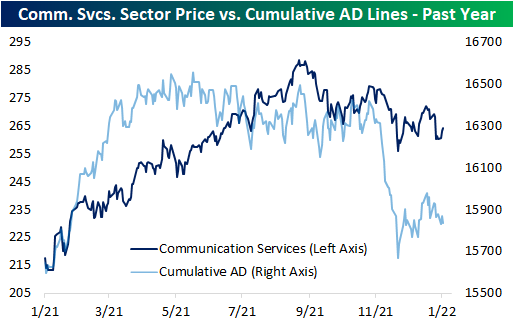
While the cumulative A/D line and price still have plenty of room for further improvement, there has been a significant pickup in the percentage of the sector’s stocks that are trading above their 50 and 200-DMAs. While the reading pulled back slightly to 59.26% yesterday, two-thirds of the sector finished last week above their 50-DMAs which was the strongest reading since April of last year. That reading comes just a little over a month after there was not even a single stock in the sector above its 50-day. The percentage of stocks above their longer-term 200-DMAs has been less impressive with only a third of stocks in the sector currently above that level, but that too has improved in recent weeks. The start of December saw readings in the high teens which marked the worst readings since the COVID Crash. Click here to view Bespoke’s premium membership options.
Another CPI Spike… Now What?
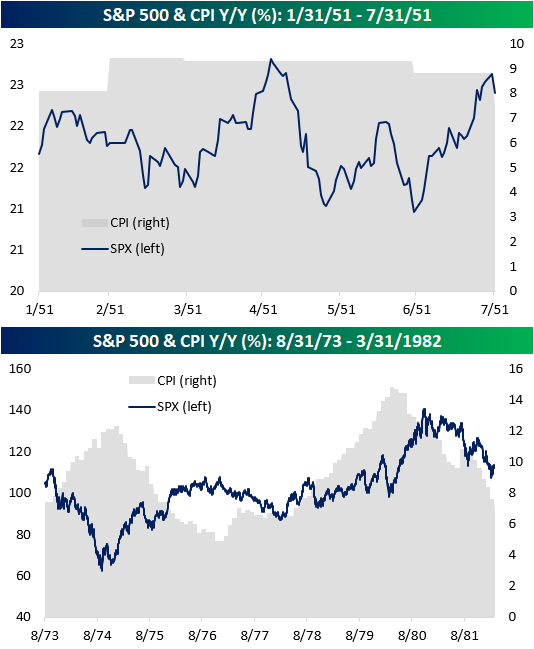
As mentioned in today’s Morning Lineup, the consumer price index (CPI) rose 7.0% year over year in December, the highest rate of increase since 1982. Consumers across America are paying higher prices for everything from bread to gas due to supply chain constraints, labor shortages, easy fiscal and monetary policy, and robust demand. Although this number was in line with estimates, the y/y increase is certainly notable.

As shown in the chart above, there have only been four other periods since 1950 that y/y CPI reached 7.0% or more (1951, 1973, 1977, 1978), and in the table below we have summarized the performance of the S&P 500 during and after each of those prior periods. Overall, returns were mixed. In January 1951, the S&P 500 was just 0.4% off of its 52-week high when CPI first eclipsed 7%. During the seven months in which CPI remained above 7% on a y/y basis, stocks rallied 3.4%, and one year later, the S&P 500 was up 11.4%.
The longest streak of 7%+ y/y readings occurred between 1978 and 1982 and spanned 46 months. During this streak, the S&P 500 gained just 15.1% over the course of almost four years and just 1.8% in the year following the first reading over 7.0% in May 1978.
In between the 1951 and 1978 periods, there were two other occurrences where CPI eclipsed 7% on a y/y basis in 1973 (28 months) and 1977 (one month), and during both of these periods, equities traded lower.

As you can see from the charts below, the S&P 500 has acted differently each time CPI topped 7.0% on a Y/Y basis. In the first half of 1951, it appeared to trade independently of the elevated inflation readings, moving sideways as CPI readings remained elevated. For much of the 1970’s, however, CPI and the S&P 500 tended to move in opposite directions. Nonetheless, much of the gains experienced in the 70’s were in periods when the rate at which prices were increasing was on the decline. Inflation has typically been considered a negative backdrop of equity prices but a key factor behind that performance is how long-lasting the inflation is. In the early 1950s, when the elevated level of inflation was short-lived, equities, which were already near 52-week highs, performed fine. In the 1970s, though, when inflation was more entrenched, the backdrop for equities was negative. Stay on top of market trends by becoming a Bespoke subscriber today. Click here to view Bespoke’s premium membership options.