Harder and Harder to Keep Up
You don’t need us to tell you how confusing this market and economy have been. On Friday, the March preliminary read on sentiment from the University of Michigan showed lower levels of optimism than at the depths of the COVID crash. Despite the pessimism, though, on Monday, the New York Fed’s monthly Survey of Consumer Expectations showed that wage growth expectations for the next year broke out to 3.04% which is the highest level in the history of the survey.

If consumers are expecting wages to grow at the fastest pace in at least a year, why are they so negative? Doesn’t seem to make sense, does it? The reason for the disconnect can be summed up in one word. Inflation. In that same monthly survey of consumer expectations from the NY Fed, inflation expectations for the next year came in at a record high of 6.0%.

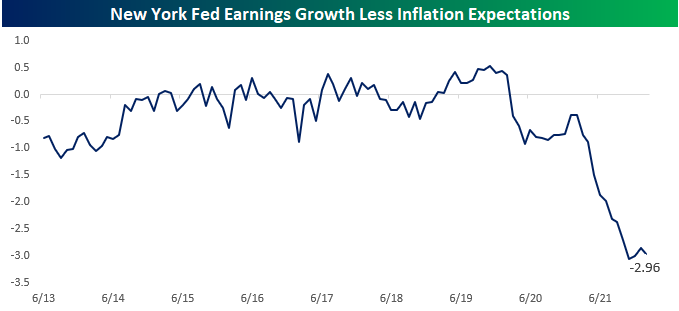
You don’t need a calculator or a chart to figure out that earnings growth of 3% isn’t enough to offset the impact of 6% inflation, but we’ll show you anyway. Below, we show the spread between the monthly readings of year ahead wage growth expectations versus inflation expectations. From the start of the New York Fed’s consumer survey in 2013 right up to before COVID, the spread between the two oscillated in a band of -1.25 to +0.5 percentage points. Once the initial phases of the COVID lockdowns passed and the economy started to reopen, though, all hell broke loose. For the last year, inflation expectations have been rising much faster than earnings growth expectations, resulting in the widest gap in the history of the survey. American consumers have found it hard enough over the years to climb the income ladder in normal times, but with inflation surging over the last year, even moderate levels of wage growth haven’t been enough for consumers to no longer feel as though they’re running up the down escalator. Click here to try out Bespoke’s premium research service.
Bespoke’s Morning Lineup – 3/15/22 – Round Trip
See what’s driving market performance around the world in today’s Morning Lineup. Bespoke’s Morning Lineup is the best way to start your trading day. Read it now by starting a two-week trial to Bespoke Premium. CLICK HERE to learn more and start your trial.
“In times of rapid change, experience could be your worst enemy.” – J. Paul Getty
Equity prices are recovering off early lows as commodity prices, especially oil, plummet. The cause of the decline could be attributed to either concern over weaker demand as the latest COVID wave washes ashore in China, or optimism over the war in Ukraine and the potential for a ceasefire. Those are two very different catalysts and would both have very different implications for the market and global economy as well.
In economic data, February PPI was just released and it came in weaker than expected at both the headline and core levels. Core PPI came in at just 0.2% which was tied for the lowest reading since the end of 2020. While inflation data was weaker than expected, Empire Manufacturing was a disappointment falling 11.8 versus expectations for a level of 6.8. That March reading for Empire Manufacturing was the weakest since May 2020.
Read today’s Morning Lineup for a recap of all the major market news and events from around the world, including the latest US and international COVID trends.
What a month it has been for crude oil. After finishing off February at a level of $95.72, WTI rallied nearly 30% on a closing basis and over 35% on an intraday basis in the span of just over a week. After hitting that multi-year high just a week ago, crude oil has practically round-tripped its entire early March gain, falling more than 22%. If these levels hold through the end of the day, it would rank as the largest decline from a 52-week high in the span of a week or less for WTI on record! Now, if prices at the pump would only reverse that quickly.

Start a two-week trial to Bespoke Premium to read today’s full Morning Lineup.
The Closer – Bonds and Stocks at the Lows, Recession Signals, China COVID, EM – 3/14/22
Log-in here if you’re a member with access to the Closer.
Looking for deeper insight into markets? In tonight’s Closer sent to Bespoke Institutional clients, we start out tonight by taking a look at prior instances of both stocks and bonds hitting six months lows, followed by a look into recession odds based on the recent action in equity and credit markets. We then take a look into the effects of China’s COVID-zero policy, and finish with an analysis on emerging markets.
See today’s post-market Closer and everything else Bespoke publishes by starting a 14-day trial to Bespoke Institutional today!
Record Decline in Chinese Internet Stocks
As we mentioned in our Morning Lineup today, Chinese equities have been hurt over the last few trading sessions due to a few reasons. First of all, Omicron is just now penetrating the country, and their COVID-zero policy has resulted in the temporary shutdown of ports, lockdowns in cities, and highly restrictive rules for businesses. In addition, US and Chinese regulators alike have been vocalizing the risk for the delisting of many Chinese equities on US exchanges due to concerns over audit standards. To top all of this off, the international community is uncertain regarding whose side of the Ukrainian conflict China stands, and Russia allegedly asked the Chinese for military equipment over the weekend. If China were to oblige to Russia’s request, it would only further escalate the icy relationship between the US and China.
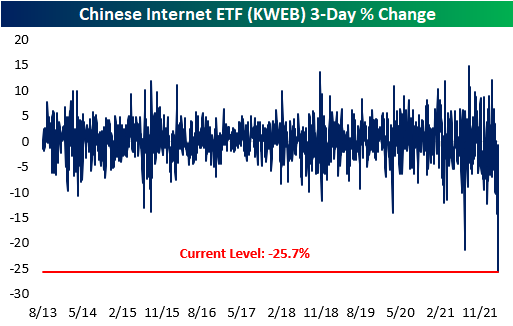
Over the last three trading sessions, the KraneShares Chinese Internet ETF (KWEB) has lost 25.7% of its value, the largest three-day decline in the history of the ETF. To put this into perspective, the worst three-day drawdown for KWEB during the COVID crash was ‘only’ 14.1%. After bottoming during the beginning of the pandemic, the ETF performed strongly until February of 2021, gaining 152.2% from trough to peak. Since then, the ETF has shed 78.4% of its value and is currently trading more than 50% below the COVID bottom.

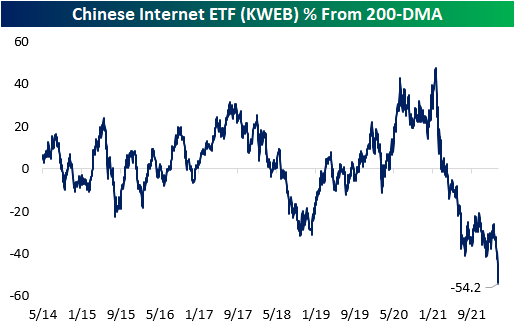
There’s no questioning that this has been a painful trade for anyone invested in this ETF or the securities it holds. The decline has been consistent, but the ETF is currently the furthest below its 200-DMA it has been since it was launched in 2013. Just to get back to the current level of the 200-DMA, KWEB would need to more than double from here.
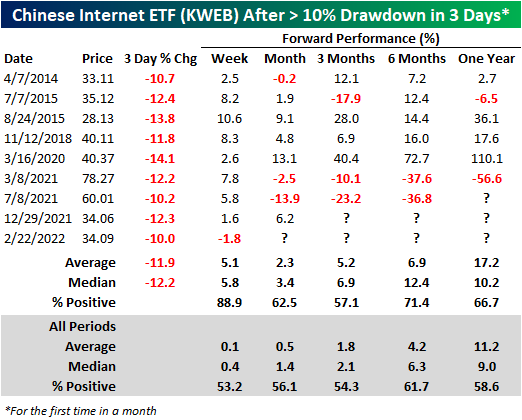
So, is this a buying opportunity? Historically speaking, when KWEB trades down 10% or more in three trading days (with no prior occurrences in the last month), the median forward performance has been greater than the median of all periods through every time period that we looked at. However, the current period is ripe with unique geopolitical headwinds, so finding fair comparable periods can be a daunting task. Chinese equities have been selling off consistently for quite some time now, but February 22nd was the first time KWEB saw a 10% three-day drawdown since December 29th, 2021. Notably, this occurrence is the only time in which the ETF traded down in the following week. Click here to try out Bespoke’s premium research service.
AAPL Streaks Above 200 DMA
Shares of Apple (AAPL) have come perilously close to breaking below the 200-day moving average (DMA) – a level it hasn’t closed below in 195 trading days (6/3/21). The chart below doesn’t include today’s trading so far, but as we type this now, the stock is trading below its 200-DMA of $153.27.

In the post iPod era (October 2001), the current streak ranks as the 8th longest of consecutive closes above the 200-DMA. Ironically, the current streak just moved into 8th place last week after it eclipsed the 193 trading day streak that ended two years ago yesterday at 193 trading days. The chart below shows historical streaks where AAPL traded above its 200-DMA since the launch of the iPod. Again, while 195 trading days may sound long, the current streak ranks nowhere close in length to the three-year streak that ended in May 2008, and the two-plus year streak that ended in 2011.

So how has AAPL stock performed after prior extended streaks of closes above its 200-DMA came to an end? The table below lists each of the prior nine times that AAPL first closed below its 200-DMA and shows how the stock performed going forward. For each period, we show AAPL’s performance in the six months leading up to the end of the streak, and then how the stock performed over the following week, month, three months, six months, and one year.
Of the prior streaks shown, AAPL’s median performance in the last six months of the prior streaks was a gain of over 11% with only one period of negative returns. With a gain of 2.7% over the last six months, if AAPL closes below its 200-DMA in the near future, its performance during this period will rank as the second weakest of the streaks shown. Once AAPL ends the streak, its short-term performance was weak with median declines of 5.0% and 0.2% over the next week and month, respectively. In each case, the stock was also down more than half of the time. For a stock like AAPL which has performed incredibly well over the last 20 years, these short-term returns are well below the historical average of 0.8% and 3.0%, respectively.
Although short-term returns for AAPL after breaking below its 200-DMA were weak, over the following three months, the stock generally got back on track with a median gain of 17.1% and gains more than three-quarters of the time. That compares to a median gain of 9.3% for all periods since October 2001. Six-month returns were also slightly better than average on a median basis (19.5% vs 18.5%) although the consistency of positive returns was lower. Finally, looking out over the next year, shares of AAPL experienced a median gain of 24.0% with positive returns just over 60% of the time. While 24% is nothing to sneeze at, it’s actually weak when you consider the fact that AAPL’s median one-year return for all periods since 2001 has been a gain of over 40%. As the individual periods indicate, AAPL’s performance following prior breaks of the 200-DMA has varied widely, but in aggregate, the stock has tended to underperform its historical average in the short term but then show some improvement over the following three to six months. Click here to try out Bespoke’s premium research service.

As always, investors should use any names listed as a starting point for further research. None of the information in this report or any opinions expressed constitutes a solicitation of the purchase or sale of any securities or commodities. This is not personalized advice. Investors should do their own research and/or work with an investment professional when making portfolio decisions. Past performance of any investment is not a guarantee of future results. Bespoke representatives or clients may have positions in securities discussed or mentioned in its published content.
The Dow Curse
At the end of August 2020, the price-weighted Dow Jones Industrial Average changed up 10% of its index members by replacing Pfizer (PFE), Raytheon (RTX), and Exxon Mobil (XOM) with Amgen (AMGN), salesforce.com (CRM), and Honeywell (HON). Below are one-year price charts of the three stocks added to the Dow. AMGN has bounced back a bit over the last six months, but it’s roughly flat YoY. CRM was up significantly at its highs last November, but it’s currently in a 36% drawdown now. Finally, HON has been in a downtrend since last summer.
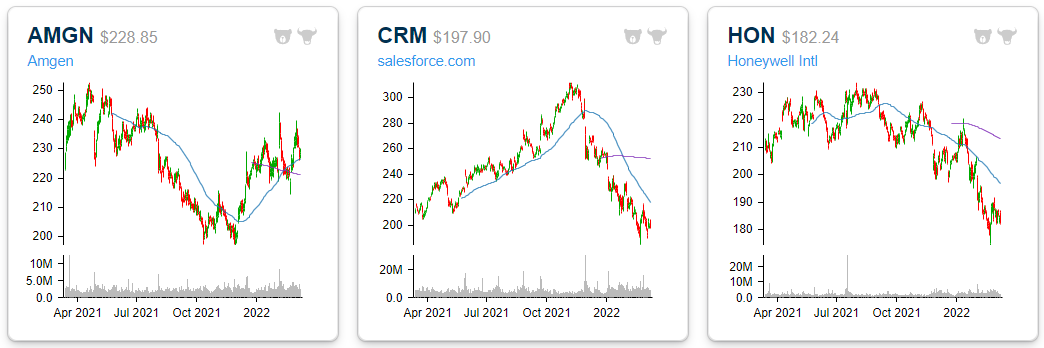
The three stocks removed from the Dow in August 2020 look completely different from the three stocks that were added. All three are in uptrends at a time when the broad market is in correction mode and trending lower.

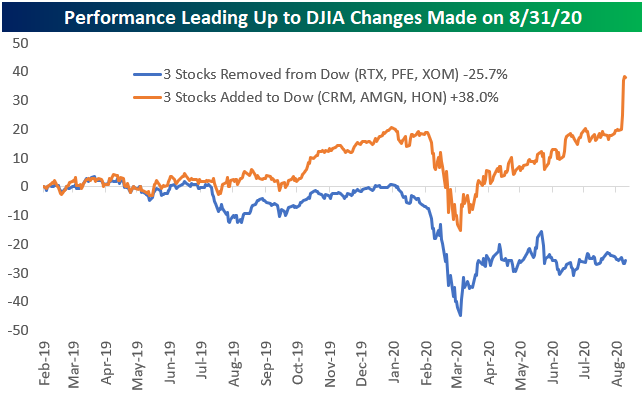
Stocks usually get removed from indices because of poor performance and/or shifting economic trends. Conversely, stocks that get added to indices have usually performed well leading up to inclusion.
It has been 386 trading days since the last Dow changes were made at the end of August 2020. Below we show how the stocks added and removed performed in the 386 trading days leading up to the index change. CRM, AMGN, HON — gained 38% leading up to inclusion in the Dow, with a big final jump between the time the changes were announced and when they went into effect. RTX, PFE, XOM — the three stocks removed – were down an average of 25.7% over the same time frame.
Below we show how the three Dow additions and removals have performed since the index changes occurred on 8/31/20. The three stocks added to the Dow have acted as a drag on the index with an average decline of 9.5% since inclusion. On the other hand, the three stocks removed from the Dow have gone bonkers, gaining 68.1%. Click here to try out Bespoke’s premium research product. Be sure to also check out Bespoke Crypto as well.

Bespoke’s Morning Lineup – 3/14/22 – Up (For Now)
See what’s driving market performance around the world in today’s Morning Lineup. Bespoke’s Morning Lineup is the best way to start your trading day. Read it now by starting a two-week trial to Bespoke Premium. CLICK HERE to learn more and start your trial.
“Life is like riding a bicycle. To keep your balance, you must keep moving.” – Albert Einstein
It’s a new week, and while it has been typical to see futures lower on the first trading day of the week so far this year, the S&P 500 and Dow are currently indicated higher. Nasdaq futures were higher earlier but have given up those gains. The catalyst for the weakness in tech stocks this morning is likely due to new COVID lockdowns in China and the impact that these shutdowns will have on tech supply chains.
Crude oil prices are down over 5%, and the cause for that decline seems to be tied to some positive sentiment related to cease-fire negotiations over the Russia-Ukraine war, but it could also be related to concerns over demand as China starts new rounds of Covid lockdowns. One thing for sure, is that a new wave of lockdowns in China, will not be good for global economic growth.
Read today’s Morning Lineup for a recap of all the major market news and events from around the world, including the latest US and international COVID trends.
It’s a new week for the markets in what has been a lousy year. Heading into the week, all but four sectors are oversold, while Energy and Utilities actually finished last week at overbought levels. Consumer Staples (XLP) was the big loser last week falling close to 6%, while Technology (XLK) and Communication Services (XLC) fell more than 3%. On a year-to-date basis, the performance disparity between Energy and everyone else continues to widen. While XLE is up over 38% YTD, no other sector is in the black, and Consumer Discretionary (XLY), XLK, and XLC are all underperforming the Energy sector by more than 50 percentage points YTD. Gaps in performance of that magnitude are pretty much unprecedented.

Start a two-week trial to Bespoke Premium to read today’s full Morning Lineup.
Bespoke Brunch Reads: 3/13/22
Welcome to Bespoke Brunch Reads — a linkfest of the favorite things we read over the past week. The links are mostly market related, but there are some other interesting subjects covered as well. We hope you enjoy the food for thought as a supplement to the research we provide you during the week.
While you’re here, join Bespoke Premium with a 30-day free trial!
Ukraine
The Dangerous Allure Of The No-Fly Zone by Mike Pietrucha & Mike Benitez (War On The Rocks)
Needed context and discussion for why an American or NATO-established no-fly zone over Ukraine would be both relatively unhelpful to Ukraine and create a massive risk of a devastating wider war in Europe. [Link; paywall]
Energy
The Biden Administration Has The Power: Administrative Authority To Address The Crisis in Oil Supply Right Now by Alex Williams, Arnab Datta, & Skanda Amarnath (Employ America)
A novel approach to reducing the cyclicality of energy production, ensuring lower price volatility and more stable supply by absorbing oil price volatility and demand mitigation on to the American government’s massive balance sheet. [Link]
Lead from gasoline blunted the IQ of about half the U.S. population, study says by Elizabeth Chuck (NBC)
Leaded gasoline created massive exposure to the IQ-blunting metal across the US population, with an average impact of 2 IQ points per person but much higher impacts among earlier generations. Leaded gasoline has been banned for more than a quarter century. [Link; auto-playing video]
Fertilizer giant Yara slashes production in Europe (CNN/Reuters)
Norwegian company Yara is cutting production of ammonia and urea at plants in Italy and France thanks to the extreme prices for natural gas (a key input to fertilizer) in Europe. [Link]
Municipal Matters
‘Booming’ LIRR and Metro-North commuters return to Manhattan in high spirits by Alex Mitchell (NYP)
As offices in Manhattan reopen, commuters are swarming back on to the tracks of commuter rail services around the New York area. [Link; auto-playing]
U.S. Retirement Funds, Heavy on Stocks, Brace for Losses by Heather Gillers (WSJ)
With more than 61% of their assets dedicated to equity markets, US public pensions are highly exposed to the stock market. Declines could pressure state and local finances though of course operating budgets are in excellent shape thanks to the post-pandemic economic boom. [Link; paywall]
Facebook Libra: the inside story of how the company’s cryptocurrency dream died by Hannah Murphy and Kiran Stacey (FT)
An effort by Facebook to launch a digital currency found tentative support from the Federal Reserve Chair before Treasury pulled support. Ultimately, a failed lobbying campaign in Washington meant Diem never took off. [Link; soft paywall]
Facebook allows war posts urging violence against Russian invaders by Munsif Vengattil & Elizabeth Culliford (Reuters)
In a revealing change at the company’s own discretion, Facebook will no longer interdict posts calling for violence against Russian troops invading Ukraine. [Link]
Yikes
Gig App Gathering Data for U.S. Military, Others Prompts Safety Concerns by Byron Tau (WSJ)
Ukrainians paid to take pictures of specific areas in rural Ukraine were unwittingly participating in a US DoD research project designed to assess the accuracy of satellite photos. [Link; paywall]
Some Understaffed PetSmarts Are Dealing With Freezers Overflowing With Dead Pets by Lauren Kaori Gurley (Vice)
PetSmart stores that have been understaffed are seeing a wave of dead pets that end up stacked in freezer and improperly disposed, adding a horrifying twist to the difficulty of running a business based on selling living things. [Link]
Sovereignty
Corporate Sovereign Awakening and the Making of Modern State Sovereignty: New Archival Evidence from the English East India Company by Swati Srivastava (Cambridge University Press)
A painstaking analysis of the growth of the English East India Company, which grew outside of the English state to the point that it actually challenged the sovereignty of the nation. [Link]
Counting
2020 Census Undercounted Hispanic, Black and Native American Residents by Michael Wines & Maria Cramer (NYT)
Amidst the challenge of the COVID pandemic, the Census likely undercounted the US population by millions of people, though that undercount does not appear to be much larger than previous decennial surveys. [Link; soft paywall]
Read Bespoke’s most actionable market research by joining Bespoke Premium today! Get started here.
Have a great weekend!
Gas Prices Hit A New Record
Crude oil may have reversed lower this week, but it’s hard to tell when drivers head to the pumps. The national average for a gallon of regular gasoline has continued to rise to hit a record high of $4.33 in data from AAA going back to 2004. While prices typically rise this time of year, the vertical move this year has meant prices have grown at a much more rapid rate than normal.Click here to read Bespoke’s premium research.

“Verb” Stocks Hit the Curb
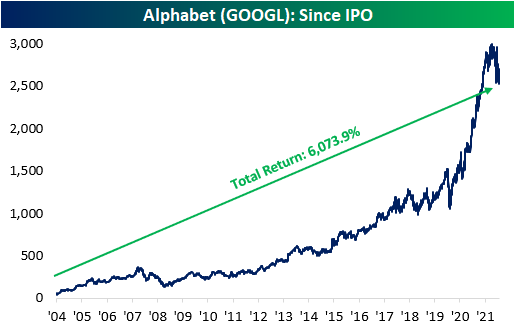
In the business world, there’s an axiom that says: when your company name becomes a verb, you’ve arrived. Take the example of Google in the late 1990s. When people started replacing the phrase ‘online search’ with ‘Google it’, you just knew that Google was going to be a big company. Since its IPO in 2004, Google – now called Alphabet (GOOGL) – has been an absolute behemoth, posting a total return of 6,073.9% and an annualized gain of 26%. GOOGL has taken over the internet search business over the years, making it one of the world’s most influential companies and the ultimate verb stock.
While GOOGL is an example of a verb stock that has seen stellar returns, a group of more recent verb stocks hasn’t fared nearly as well. Over the past few years, certain companies have introduced products and services that have become so integral to their daily lives that their names have become verbs. Owe someone money for lunch? Just venmo them. Not feeling well? Might be a good idea to schedule a teladoc appointment with your doctor before going out. Need to sign a document? No need to print it out and fax it back. Just docusign it. Have a client meeting but traffic is a nightmare? Why don’t you just hop on a zoom.
The services these companies offered became necessities of daily life during the pandemic, and because of that their stocks surged. We created an equally-weighted basket tracking the performance of PayPal (PYPL), Teladoc (TDOC), DocuSign (DOCU), and Zoom (ZM). From the start of 2020 (right before the pandemic) through the basket’s peak in early 2021, these stocks tripled. Around that point, investors began to question what the outlook for these stocks would be when the economy re-opened, but proponents argued that the services these companies offered provided such a convenience that they wouldn’t miss a beat.
While consumers around the world are still venmo-ing, teledoc-ing, docusign-ing, and zoom-ing, the stocks of all these companies have been imploding. The basket of four stocks has now erased all of its COVID gains and is now in the red relative to where it traded at the start of 2020.
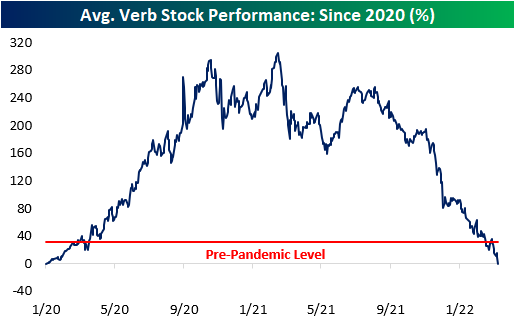
Although there is a little bit of variation in the performance of these four stocks, the overall trend is largely similar. Of the four, ZM is the only one that is still positive relative to where it started in 2020. PYPL, TDOC, and DOCU, on the other hand, have declined 11.4%, 33.6%, and 4.1%, respectively. As you can see from the graph below, these stocks have round-tripped, erasing all of the gains provided by the pandemic. While valuations were certainly stretched for a while, the fact that these stocks are lower now than they were before COVID, even after proving their worth during the pandemic, shows how much sentiment has shifted in the last several months. One trend not working in favor of these verb companies is competition. As the pandemic proved the viability of their business models, competitors have been quick to step in. These days, someone may ‘venmo’ you using the CashApp, do a ‘teladoc’ appointment through CVS, ‘docusign’ an application using Adobe E-signature, or do a ‘zoom’ over Teams or Google Meets. Click here to read Bespoke’s premium research.
