Bespoke’s Morning Lineup – 4/11/22 – Another Case of the Mondays
See what’s driving market performance around the world in today’s Morning Lineup. Bespoke’s Morning Lineup is the best way to start your trading day. Read it now by starting a two-week trial to Bespoke Premium. CLICK HERE to learn more and start your trial.
“You get recession, you have stock market declines. If you don’t understand that’s going to happen, then you’re not ready, you won’t do well in the markets.” – Peter Lynch
It’s another case of the Mondays for US stocks this morning as all three major averages are firmly in negative territory with the Nasdaq leading the way lower. Along with equities, just about every other risk asset is trading lower, including bitcoin and crude oil. Bonds are down again as well, while yields continue to surge in what has been one of the most relentless moves higher in yields that the market has seen in years.
The economic and earnings calendars are pretty much empty today, but things will pick up greatly as the week goes on with a busy slate from Tuesday through Thursday before Friday’s equity market holiday.
Read today’s Morning Lineup for a recap of all the major market news and events from around the world, including the latest US and international COVID trends.
Given the widening lockdowns in China and concerns of a broader economic slowdown, oil prices have been under pressure this morning continuing a trend of weakness from last week. While the week is just a few hours old at this point, WTI is trading below $94 per barrel and in danger of breaking a relatively important support level. At current levels this morning, WTI is pretty much up 24% YTD but down 24% from its closing high in early March.

Start a two-week trial to Bespoke Premium to read today’s full Morning Lineup.
Disney+ Turns Three
It seems like just yesterday that the streaming market was dominated by a single player: Netflix (NFLX). This dramatically changed when new entrants such as Amazon (AMZN), Paramount (PARA), Comcast (CMCSA), Hulu, and YouTube (GOOGL) helped create a relatively fragmented and competitive market. The conjunction of all of these platforms and a shift in consumer preferences has put pressure on legacy television brands and forced conversion into streaming. Three years ago today, Disney (DIS) announced that their streaming platform, Disney +, would be unveiled just seven months later.
When DIS first announced the launch of its streaming platform, investor excitement was clear, as the stock soared 11.5% the following day, the largest single day upside move since May of 2009. DIS has the ability to source content from its existing brands, such as Lucasfilm, Marvel, ABC, The History Channel, Pixar, 20th Century Studios, A+E Networks, and more. Its unique setup allows the company to produce content from profit generating-entities, and further monetize said content by offering it to consumers on its streaming platform. DIS also owns ESPN and Hulu, which increases the attractiveness of the collective platform as a family package, covering everything from live sports to children’s programming. At the end of fiscal year 2021, Disney+ had 33,000 episodes and 1,850 movies on the platform, bringing the title total to about 35,000. On the other hand, Netflix had 50,000 titles in March of 2020, so DIS is slightly behind in aggregate content relative to the largest competitor in the sector. Since the start of 2020, the number of users on the Disney+ platform has grown at a compounded annual growth rate of 111.1%, growing from 26.5 million in Q1 2020 to 118.1 million in Q4 2021. The most recent quarter (Q4 2021) saw the slowest q/q subscriber growth in both percentage and nominal terms, as the service added just 2.1 million users (+1.8%).

Alongside the subscriber spike has, of course, come a spike in direct-to-consumer revenues realized by DIS. In fiscal year 2021, DIS booked $16.3 billion in revenue from its DTC segment, which was an increase of 54.7% y/y. In fiscal year 2020, DIS recognized a 38.0% increase in subscription revenues. Clearly, this channel has been growing significantly, and the pandemic helped to only propel further. Although this aspect of the business was strong in the midst of the pandemic, losses from cruises, hotels, and resorts hampered earnings results, which resulted in poor equity performance for DIS. Since the start of 2020, DIS has traded down by 10.6%, even as the headwind of COVID restrictions has eased, travel has picked up, and the DTC channel has experienced immense growth.

The relative strength of Disney’s stock has been even bleaker. Since announcing the launch of Disney+, DIS has underperformed the S&P 500 by a wide margin, and the relative strength reading is currently sitting at the lowest level since 2012. In its Q4 2021 earnings report, DIS reported slowing subscriber growth, which caused the relative strength to weaken even further. Moving forward, investors will be keenly aware of the performance of Disney+ as well as the performance of the parks, resorts, and cruises as pent-up travel demand continues to come into the market. Although the launch of Disney+ has gone relatively well, the platform has room to run in terms of penetration, subscriber counts, and international expansion. The stock has not moved in conjunction with subscriber growth as questions over revenues generated per user, a highly competitive streaming space, and the company’s exposure to still-suppressed industries still cloud the outlook. Click here to try out Bespoke’s premium research service.

Bespoke Brunch Reads: 4/10/22
Welcome to Bespoke Brunch Reads — a linkfest of the favorite things we read over the past week. The links are mostly market related, but there are some other interesting subjects covered as well. We hope you enjoy the food for thought as a supplement to the research we provide you during the week.
While you’re here, join Bespoke Premium with a 30-day free trial!
The Masters
Augusta family next to Masters golf course keeps turning down millions for their 1,900-square-foot house by Cork Gaines (Insider)
The crowds at Augusta National often walk past the Thacker family abode at 1112 Stanley Drive, just across the street from Gate 6A. The Thackers have repeatedly turned down millions for the property. [Link]
Masters 2022: Anything but the green jacket — tales from player shopping sprees by Josh Weinfuss (ESPN)
What’s the point in attending the most exclusive golf tournament in the world if you don’t bring home some swag to prove you were there? [Link]
China
China’s $2.3 Trillion Infrastructure Plan Puts America’s to Shame by Tom Hancock (Bloomberg)
The already investment-intensive Chinese economy is going to plough another $2.3trn into infrastructure to offset slowing property markets and an economy wracked by COVID, high debt, and weak consumer spending. [Link; soft paywall]
Shunned Oil Piling Up Off China as Virus Outbreak Worsens (Bloomberg)
Amidst extreme oil shortages around the global economy, more than 20 million barrels of crude from Russia, Iran, and Venezuela are sitting offshore in China as domestic demand collapses thanks to interventions seeking to contain the spread of COVID. [Link; soft paywall]
Inflation
Shoppers Face ‘Shrinkflation’ at the Supermarket by Donna Fuscaldo (AARP)
In addition to raising the price of goods, companies are also reducing the size of packaged goods without changing the price. This shows up in official inflation measures (because they are adjusted for the weight or volume of a given item) but may sneak up on consumers at the store. [Link]
Inflation fears force Americans to rethink financial choices, CNBC and Acorns survey says by Michelle Fox (CNBC)
A somewhat hard-to-believe 48% of Americans report thinking about rising prices “all the time”. More than half of respondents to a recent survey reported cutting back on dining out, the most common response to inflation reported. Though that’s also tough to square with restaurant spending at a record level in February per BEA data. [Link]
New York
NYC’s Priciest Seafood Spots Skyrocket Further Into the $1,000 Stratosphere by Ryan Sutton (Eater)
Won’t someone think of the Nobu patrons? A dinner for two at Sushi Noz now costs $1k, amidst a wave of higher prices around the highest-end meals in New York City. [Link]
The world’s skinniest skyscraper is ready for its first residents by Lydia Armstrong (CNN)
The Steinway Tower at 111 West 57th is 24x as tall as it is wide, making it the third-tallest building in New York but at 84 stories it will be the most slender tower in the world. [Link]
NYC landlords filing so many eviction cases that firms for low-income tenants have run out of lawyers by Molly Crane-Newman (New York Daily News)
More than 10,000 eviction proceedings were filed in New York during the last two months, on top of more than 200,000 suits filed during the pandemic; there are so many suits that there aren’t enough lawyers to represent all the tenants. [Link; auto-playing video]
Social Studies
U.S. life expectancy falls for 2nd year in a row by Rob Stein (NPR)
Despite the country moving on from the pandemic, thousands of Americans are still dying of COVID, and provisional statistics showed that drove down life expectancy for the second consecutive year in 2021. [Link]
America’s internet is splitting along party lines by Sara Fischer and Scott Rosenberg (Axios)
Investors are betting on durable partisan splits in media consumption, as media consumers gravitate towards similar viewpoints at siloed sites. [Link]
The Workplace
This Is What Happens When There Are Too Many Meetings by Derek Thompson (The Atlantic)
White collar workers are increasingly finding productivity late into the night, with workers increasingly returning to tasks after dinner and before the end of the night. [Link; soft paywall]
“Great Resignations” Are Common During Fast Recoveries by Bart Hobijn (FRBSF)
Fast labor market recoveries generally lead to elevated job turnover, making the much-heralded “great resignation” of the current post-COVID jobs boom wholly unremarkable. [Link]
Bearish Bets
If Stocks Don’t Fall, the Fed Needs to Force Them by Bill Dudley (Bloomberg)
An argument that for the economy to slow as desired by the Federal Reserve, even more shock therapy is needed in the form tighter financial conditions. [Link; soft paywall, auto-playing video]
Crypto
The Metaverse Has Bosses Too. Meet the ‘Managers’ of Axie Infinity by Edward Ongweso Jr (Vice)
A dystopian vision of a crypto-fueled gaming future that outsources the hard work of collecting in-game rewards to workers in the Global South and exposes anybody playing to wild variations in market prices which have nothing to do with underlying game. [Link]
Conspicuous Consumption
The Real Yacht Rock: Inside the Lavish, Top-Secret World of Private Gigs by David Browne (Rolling Stone)
Some of the biggest paydays in music come from private bashes for the world’s wealthy: millions for a single quick show performed to a small private audience. [Link]
Drones
Amazon, Alphabet and Others Are Quietly Rolling Out Drone Delivery Across America by Christopher Mims (WSJ)
Consumers are starting to get deliveries from drones after years of promises that they are right around the corner. Air dropped packages, quadcopter deliveries, and rapid Prime from the sky are all part of the landscape. [Link; paywall]
Read Bespoke’s most actionable market research by joining Bespoke Premium today! Get started here.
Have a great weekend!
The Bespoke Report – 4/8/22 – Earnings Keep The Market Afloat
This week’s Bespoke Report newsletter is now available for members.
The US equity market is facing big valuation headwinds from rapid shifts in expectations for Federal Reserve policy near-term and a market view that rates will be higher in the long term. With yields surging, the market has relied on ever-higher earnings estimates to stay afloat as we approach Q1 earnings. High earnings estimates make this season a unique risk for the market as the post-COVID bonanza in beats trails off. Foreign central banks are also getting in on the game as interest rates surge into positive territory in the Eurozone. We discuss French elections with the first round of voting this Sunday, as well as touching on policy in Russia and China. Global trade frictions appear to be easing, and used auto prices have started to fall, both of which offer a sunnier picture for inflation. We also look at earnings Triple Plays, credit markets, the strong dollar, the outlook for the Fed’s balance sheet, oil markets, big NASDAQ drops, equity market dividend yields, recession probabilities, and more in this week’s Bespoke Report.
To read this week’s full Bespoke Report newsletter and access everything else Bespoke’s research platform has to offer, start a two-week trial to one of our three membership levels.


Daily Sector Snapshot — 4/8/22
Please click the thumbnail image below to view today’s Daily Sector Snapshot.

Bespoke’s Crypto Report — 4/8/22
Bespoke’s Crypto Report contains numerous technical, momentum, and sentiment charts for bitcoin, ethereum, and other key cryptos. Page 1 of the report includes our weekly commentary on the space and attempts to identify any new trends that are emerging. The remaining pages include important overbought/oversold levels to watch, charts on historical drawdowns and rallies, seasonality trends, futures positioning data, Google search trend shifts, and more. Our weekly Crypto Report is produced so that followers of the space can more easily stay on top of price action, technicals, seasonality, and sentiment.
Sign up for a monthly or annual subscription to Bespoke Crypto to receive our weekly Crypto Report and anything else we publish related to cryptos. Note: If you’re currently a Bespoke Premium, Bespoke Newsletter, or Bespoke Institutional subscriber, you’ll need to subscribe to Bespoke Crypto as an add-on to receive access. The weekly Crypto Report and any additional crypto analysis is not included with our Premium, Newsletter, or Institutional memberships. You can sign up for Bespoke Crypto and receive our Crypto Report in your inbox weekly using the monthly or annual checkout links below. If you sign up for the annual plan, the first year of access is 50% off!
Bespoke Crypto Access — Monthly Payment Plan ($49/mth)
Bespoke Crypto Access — Annual Payment Plan ($247.50 for the first 12 months, then $495/year in year 2 and beyond)

Bespoke Investment Group, LLC believes all information contained in this service to be accurate, but we do not guarantee its accuracy. None of the information in this service or any opinions expressed constitutes a solicitation of the purchase or sale of any securities, commodities, or cryptocurrencies. This service contains no buy or sell recommendations. This is not personalized advice. Investors should do their own research and/or work with an investment professional when making portfolio decisions. As always, past performance of any investment is not a guarantee of future results. Bespoke representatives or clients may have positions in securities discussed or mentioned in its published content.
Bespoke’s Morning Lineup 4/8/22 – Finishing Up a Down Week
See what’s driving market performance around the world in today’s Morning Lineup. Bespoke’s Morning Lineup is the best way to start your trading day. Read it now by starting a two-week trial to Bespoke Premium. CLICK HERE to learn more and start your trial.
“Whenever you see a successful business, someone once made a courageous decision.” – Peter F. Drucker
Equities are looking to finish off what has been a disappointing week on a positive note today, but unless futures build on their early gains during the trading day, the first full week of April looks like it’s going to be a negative one for the S&P 500. For the Russell 2000, the week is already a lost cause as it’s down close to 4%. The economic calendar is light this week with Wholesale Inventories the only release on the calendar. Looking ahead to next week, though, Monday will be quiet, but then in the final three trading days of the week (equity markets are closed on Friday), we’ll get CPI, PPI, Retail Sales, and many other important reports. In addition to a busy week of economic data, next week will also mark the start of earnings season with the major banks kicking things off.
Read today’s Morning Lineup for a recap of all the major market news and events from around the world, including the latest US and international COVID trends.
Bombarded with the same headlines over and over again, it’s easy to become numb to the moves we have seen in the treasury market and lose perspective. In the last five weeks, though, we’ve witnessed an 80 bps increase in the yield on the 10-year US Treasury which ranks as the largest increase during that span in more than 10 years! As shown in the chart below, going back to 1990, there have only been ten other periods where the yield on the 10-year rose 75 bps or more in a five-week span. So moves like this are pretty uncommon, and while we could have gone back further in the analysis, prior to 1990, the yield on the 10-year was consistently much higher, so a 75 bps move was a lot less dramatic. Even in the 1990s, when the 10-year yield averaged more than 6%, a move in the yield of the magnitude we have seen in the last five weeks would have been less dramatic than it has been off the low base of the current period.

Start a two-week trial to Bespoke Premium to read today’s full Morning Lineup.
The Closer – Defensives Lead, Consumer Credit, Intraday Pattern, Supply Chains – 4/7/22
Log-in here if you’re a member with access to the Closer.
Looking for deeper insight into markets? In tonight’s Closer sent to Bespoke Institutional clients, we begin with a look at defensive sector outperformance and bond flows. We also check in on the record in consumer credit creation in February. We follow up with a look at how today’s price action stacks up to other periods of this year. Next, we dive into used car prices and shipping rates. We finish with a review of the crude oil term structure.
If you’re wondering what the Closer is like each day, click here or on the thumbnail image below for a sample of a few pages from the report.

See today’s full post-market Closer and everything else Bespoke publishes by starting a 14-day trial to Bespoke Institutional today!
The Bespoke 50 Growth Stocks – 4/7/22
The “Bespoke 50” is a basket of noteworthy growth stocks in the Russell 3,000. To make the list, a stock must have strong earnings growth prospects along with an attractive price chart based on Bespoke’s analysis. The Bespoke 50 is updated weekly on Thursday unless otherwise noted. There were eight changes to the list this week.
The Bespoke 50 is available with a Bespoke Premium subscription or a Bespoke Institutional subscription. You can learn more about our subscription offerings at our Membership Options page, or simply start a two-week trial at our sign-up page.
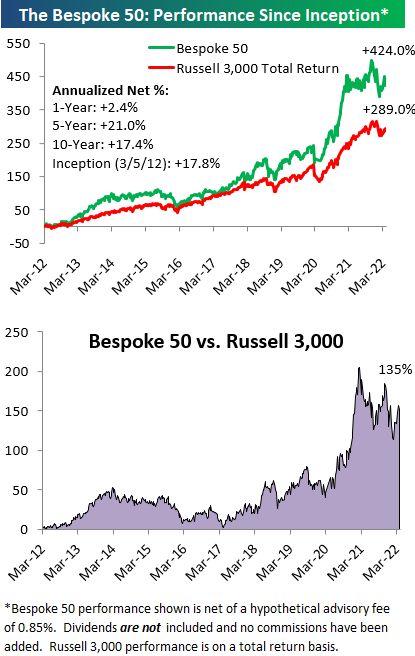
The Bespoke 50 performance chart shown does not represent actual investment results. The Bespoke 50 is updated weekly on Thursday. Performance is based on equally weighting each of the 50 stocks (2% each) and is calculated using each stock’s opening price as of Friday morning each week. Entry prices and exit prices used for stocks that are added or removed from the Bespoke 50 are based on Friday’s opening price. Any potential commissions, brokerage fees, or dividends are not included in the Bespoke 50 performance calculation, but the performance shown is net of a hypothetical annual advisory fee of 0.85%. Performance tracking for the Bespoke 50 and the Russell 3,000 total return index begins on March 5th, 2012 when the Bespoke 50 was first published. Past performance is not a guarantee of future results. The Bespoke 50 is meant to be an idea generator for investors and not a recommendation to buy or sell any specific securities. It is not personalized advice because it in no way takes into account an investor’s individual needs. As always, investors should conduct their own research when buying or selling individual securities. Click here to read our full disclosure on hypothetical performance tracking. Bespoke representatives or wealth management clients may have positions in securities discussed or mentioned in its published content.
Bulls Head for the Hills Once Again
After peaking at 32.8% two weeks ago, bullish sentiment continues to roll over as the S&P 500 has erased some of the March gains this week. After this week’s decline of 7.2 percentage points in bullish sentiment, less than a quarter of respondents reported as bullish. While low, that is still a few percentage points above the weaker levels from February.

Bearish sentiment in turn rose 13.9 percentage points which was the biggest one-week uptick since August 2019 when it rose 24.14 percentage points. At 41.4%, bearish sentiment is now at the highest level since the week of March 17th. That is an elevated reading and a big move week over week, but it is also well off recent highs from the past few months that were more than 10 percentage points higher.

The bull-bear spread tipped into positive territory for the first time in 2022 last week, but the big inverse moves between bulls and bears erased much of the past few weeks’ move. The spread is down to -16.7 which is still 13.6 points above the late February low of -30.3.

The big pickup in the number of respondents reporting as bearish didn’t entirely come from the bullish camp. Neutral sentiment also shed a significant amount falling from 40.6% last week to 33.9%. That is essentially mean reversion as neutral sentiment now sits only a couple of points above the historical average. Click here to view Bespoke’s premium membership options.
