Gasoline Burning Up
As we noted in today’s Chart of the Day, inflation data has been moderating and so too have gas prices as demand has pulled back and refinery output rises as we discussed in last night’s Closer. Roughly two weeks ago, AAA’s national average price for a gallon of regular gasoline peaked just above $5. Granted it is still elevated, but that price has fallen to $4.86 today. Taking one step further up the supply chain, Gasoline futures peaked even further ago on June 9th and have fallen 14.5% since then. As shown in the second chart below, that decline is now putting the past several month’s uptrend on the ropes.

While both the national average and gasoline futures have been rolling over, the decline in the latter has been far larger as those prices tend to slightly lead retail prices. As for the size of that disconnect, taking the spread of the one-month percent change of the two measures of gasoline is historically wide at 14.4 percentage points. The last times such a divergence has been observed were earlier this spring, last fall, and back in 2020. In those periods, such divergences were short-lived. As shown in the bottom chart where we overall the AAA national average and Front Month Gasoline futures, moves in the futures market tend to lead prices at the pump, in other words, it is unlikely retail prices will continue to fly in the face of lower futures prices. Click here to learn more about Bespoke’s premium stock market research service.


2022: Where Nothing Can Go Right
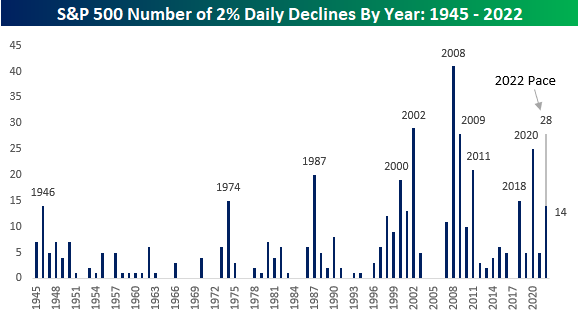
2022 has seen the bulls get slugged with a number of heavy blows. The S&P 500 has already experienced 14 separate one-day declines of 2% or more this year. That’s nine more than the entire total for 2021!
While there are still another six months left in the year, only ten other years have seen as many or more 2% daily declines in their entirety! At the current pace, 2022 would see 28 daily declines of 2%+, which would rank as tied with 2009 for the third most in the post-WWII period trailing only 2002 (29) and 2008 (41). Not great company. If 2021 was the year where nothing could go wrong for investors, 2022 has been the year where nothing is going right. Click here to learn more about Bespoke’s premium stock market research service.
Where Have All the Bulls Gone?
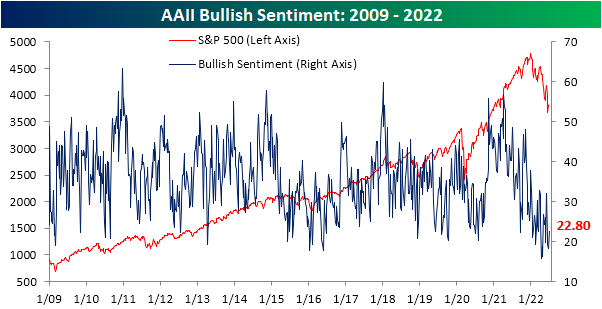
After two weeks of sub-20% readings, the share of respondents to the AAII sentiment survey reporting as bullish has risen back up to 22.8%. That increase in optimism comes on what has been pretty choppy price action in the past week as the S&P 500 had risen then given up roughly 3% since the last update of the AAII numbers.
The increase in bullish sentiment broke a streak of back-to-back-to-back declines, and the opposite shift in sentiment could be seen for bearish sentiment. The percentage of respondents reporting as pessimists fell by 12.6 percentage points in the latest week bringing the reading back below 50%. While the double-digit decline was large, the first week of June actually saw an even bigger drop of 16.4 percentage points.
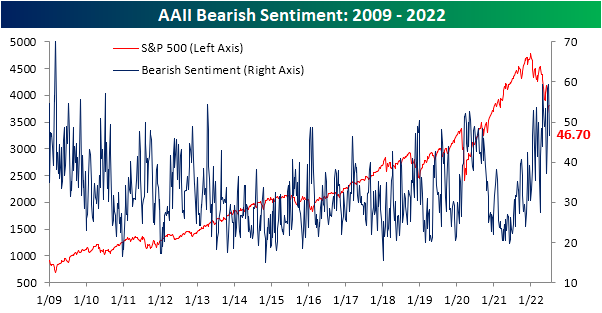
The significant inverse moves in bullish and bearish sentiment have resulted in the bull-bear spread to move higher, but at -23.9, sentiment continues to heavily favor the bears.

In fact, taking a four-week moving average of the bull-bear spread shows that the reading has been below -10 (meaning on average bears have outnumbered bulls by at least 10 percentage points) for 23 straight weeks. That continues to close in on the record six-month streak that ended in February 1991 as bulls are few and far between.

Given the drop in bears this week was far larger than the increase in the number of respondents reporting as bullish, the bulk of the sift went to the neutral camp. That reading rose 8 percentage points to 30.5%. While that only leaves the reading at the highest level since the week of June 9th, it was the largest one-week increase since the last week of March and ranks in the top decile of all week-over-week moves on record. Click here to learn more about Bespoke’s premium stock market research service.

Claims Consistent
Seasonally adjusted initial jobless claims came in at 231K which was ever so slightly above expectations of 230K. Meanwhile, last week’s number brought up the low end of the recent range after a 4K upward revision to 233K. That means the most recent read actually showed an improvement versus the previous week whereas before it would have been a modest deterioration in the number. Regardless, claims remain well off of the multi-decade lows from earlier in the spring, but even at current levels, the only historical periods with parallels for as strong of a level were just before the pandemic and the late 1960s to early 1970s.

We would also note that even though claims are up versus the early spring, the reading has seen very little movement in the past month. Quantifying this, the four-week rolling standard deviation in claims has fallen below 1 for only the seventh time on record going back to 1967. The past six times this happened were: April 1988, March 1990, September 2006, August 2016, and June 2019. That is not to say that claims are either improving or deteriorating in any sort of significant way, but rather claims have been remarkably stable in recent weeks.

On a non-seasonally adjusted basis, claims have likewise been little changed over the past few weeks having gone from 206.1K two weeks ago, to 206.4K last week to 207.4K this week. Without much movement, this week’s reading on claims continues to show a stronger reading than comparable weeks pre-pandemic even if they have come off of recent lows from earlier this year.
When taking seasonality into account, as shown in the second chart below, that lack of movement in the claims number is not exactly unwarranted for the current period of the year, but it is likely to change as the next few weeks have consistently seen claims experience a brief and sizable uptick.

Turning over to continuing claims, the rise off of pandemic and multi-decade lows has been much less severe. In the most recent week’s data through June 17th, continuing claims fell from 1.331 million to 1.328 million. Click here to learn more about Bespoke’s premium stock market research service.

Bespoke’s Morning Lineup – 6/30/22 – Good Riddance
See what’s driving market performance around the world in today’s Morning Lineup. Bespoke’s Morning Lineup is the best way to start your trading day. Read it now by starting a two-week trial to Bespoke Premium. CLICK HERE to learn more and start your trial.
“Everything is going to be fine in the end. If it’s not fine it’s not the end.” – Oscar Wilde

Below is a snippet of content from today’s Morning Lineup for Bespoke Premium members. Start a two-week trial to Bespoke Premium now to access the full report.
Could you think of a more fitting finish to the worst first half of a trading year in more than 50 years? Maybe a 5% decline instead? Futures are indicated lower this morning with the S&P 500 trading down more than 1.4%. Economic concerns continue to weigh on sentiment as PMI data in China for June rebounded but came in weaker than expected while Industrial Production in Japan also showed considerable weakness and badly missed forecasts. Stocks in Europe are also lower this morning, although economic data wasn’t as bad relative to expectations.
Given the economic weakness and plunging stock prices, Treasury yields are falling both in the US and Europe. The 2-Year US Treasury yield is back below 3%, while the 10-year yield at 3.03% isn’t that far behind. On the economic front, at 8:30, we’ll get updates on Personal Income (inline), Personal Spending (weaker), PCE Deflator (lower than expected), and Jobless Claims (generally inline), and then at 9:45 we’ll get the June read of the Chicago PMI. In response, futures have bounced, but the S&P 500 is still indicated to open down by 1%.
In today’s Morning Lineup, we discuss the latest weakness in Asian and European markets, as well as a look at international economic data.
If current levels in SPY hold, today will be just the 15th time since the ETF’s inception in the early 1990s that it gapped down more than 1% on the last trading day of the month. Of those 14 prior occurrences, only three were also on the last trading day of the quarter, and today will be the first time that it gapped down this much on the last trading day of the half. In terms of how SPY traded from the open to close on these days, the average (0.54%) and median (+0.49%) return is actually better than the average for all last days of a month since 1993. However, while the sample size is small, on all three days that SPY gapped down 1%+ to close out the quarter, traders weren’t in a rush to snap up any bargains as SPY traded lower from the open to close all three times.

Start a two-week trial to Bespoke Premium to read today’s full Morning Lineup.
Highest Increases in Short Interest
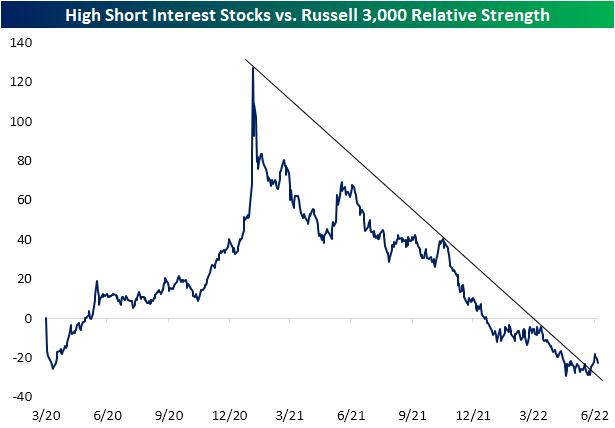
As we highlighted in a post yesterday, the relative strength of the 100 stocks with the highest levels of short interest against the Russell 3000 has broken its downtrend. This downtrend had been in place since the end of the meme stock mania in January of 2021. Just to refresh your memory, that chart is provided below.
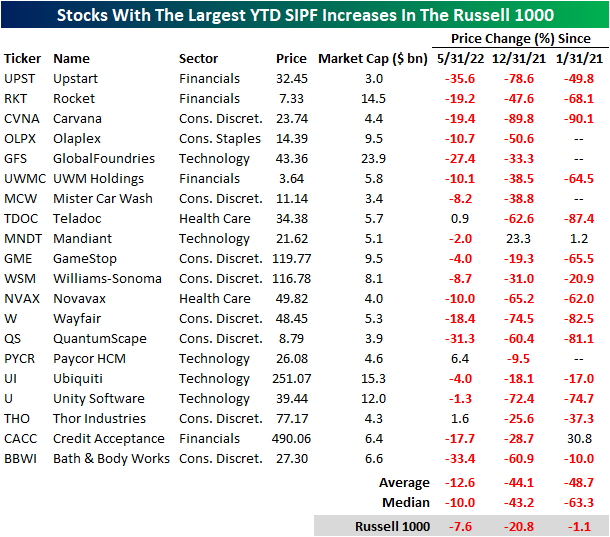
Today, we took a look at the 20 Russell 1000 stocks that have seen the largest increases in short interest as a percentage of float (SIPF) on a year to date basis. Leading this group is Upstart (UPST), the buy now pay later firm that has been decimated as growth stocks have gotten crushed and consumer confidence weakens to historic levels. UPST saw SIPF rise by 27.1 percentage points on a YTD basis and by an additional 2.0 percentage points in June. Notably, UPST appeared on our Top 20 P/S Decliners list as well, which we published yesterday. Unity Software (U) is the only other name to appear on both lists. The largest names on this list by market cap are GlobalFoundries (GFS), Ubiquiti (UI) and Rocket (RKT).

The performance of these twenty names has been quite weak on a month over month and YTD basis. Additionally, these names have massively underperformed the broader index since the end of the meme stock mania, trading down by 48.7% on average (median: -63.3%) compared to the Russell 1000’s loss of just 1.1%. On a YTD basis, these stocks have shed 44.1% of their value on average, which was accelerated by a 12.6% average loss since the end of May. Although it’s difficult to find any positivity in these names, they are primed for short squeezes or reversals as shorts cover their positions (which forces buying. Click here to learn more about Bespoke’s premium stock market research service.
Happy Birthday, iPhone!
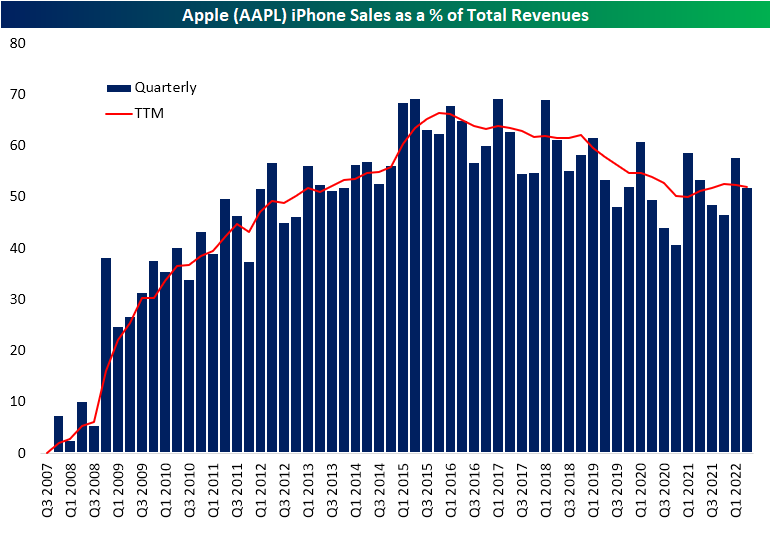
Whether it is currently in your pocket or in your hand as you read this, if you own an Apple iPhone, make sure to wish it a happy birthday. Exactly a decade and a half ago to the day, what is now the staple of the smartphone market first hit the shelves. Much of Apple’s growth in the years since the smartphone debuted can credited to this revolutionary device. Over the past four quarters the phone accounted for $200 billion in sales which is a 52% share of total revenues for the company. Even though it still currently accounts for a majority of one of the world’s biggest companies’ revenues, over the past few years, that share has been on the decline having peaked at 69.4% in Q1 2017.
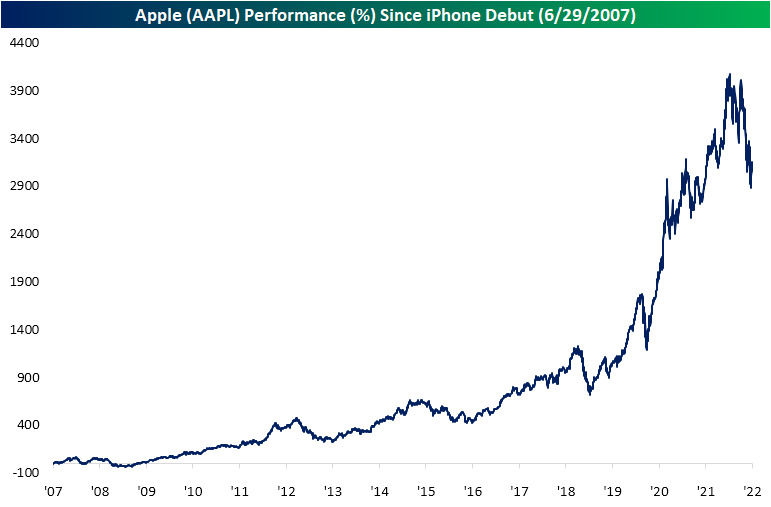
Since the first generation iPhone was released, the stock of Apple has posted astounding gains. In fact, of all current S&P 500 members, AAPL ranks as the fifth best performer (based on price change) in the index since the iPhone debut 15 years ago. The only stocks to have posted even more impressive gains have been Netflix (NFLX), DexCom (DXCM), Regeneron (RGEN), and Amazon (AMZN). That is not to mention that at its high earlier this year, Apple’s post iPhone rally stood above 4,000%!
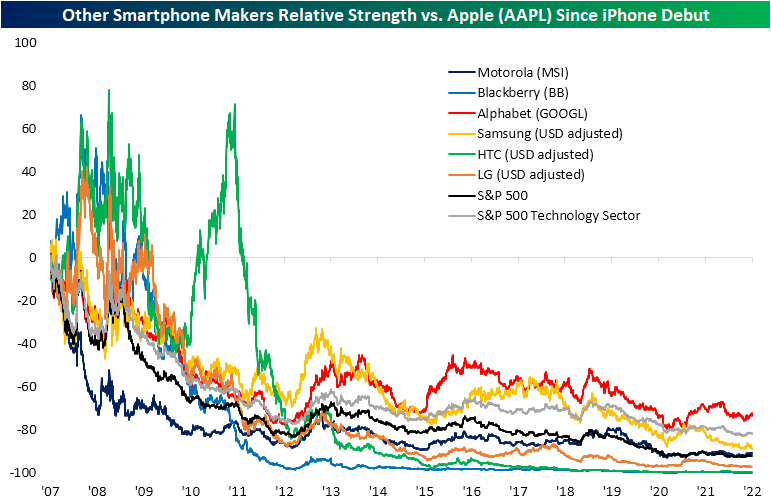
Not only has AAPL left most of the market in the dust over the past 15 years, but it is especially the case for the stocks of other smartphone makers. Below we show the relative strength lines of various other smartphone maker stocks versus Apple (AAPL) since the iPhone debut on June 29, 2007. While other names like Blackberry, HTC, Samsung, and LG (the latter three are USD adjusted given they trade on various Asian markets) saw some outperformance versus Apple in the late 2000s, there has been absolutely no competition over the long run. Granted its business is diversified well beyond smartphones, but Alphabet (GOOGL) also hasn’t held a candle to Apple even though its relative strength line has been better off than many other smartphone makers. Click here to learn more about Bespoke’s premium stock market research service.
3% Daily Declines in QQQ
There’s no questioning that markets have been extremely volatile this year. Yesterday, the Nasdaq 100 tracking ETF (QQQ) declined by 3.0%, which for 2022, has not been a foreign occurrence. In fact, yesterday was the eleventh time this year that QQQ fell by at least 3%. Since QQQ began trading in 1999, this will be the fifth-highest number of 3%+ daily declines in the first half of the calendar year (top chart below). Although the number of 3%+ daily declines is still well below 2020 and dot-com era levels, it is still a significantly elevated reading. In fact, this year’s first-half pace has been well ahead of levels from 2008 and 2009 and is only three shy of the pace in 2020. Click here to learn more about Bespoke’s premium stock market research service.
Volatility has not been exclusively to the downside, though. On top of the 11 3%+ declines, there have been nine days so far in 2022 in which QQQ rose by at least 3%, bringing the total number of absolute daily moves of 3%+ to 20. This too ranks fifth of all years since 1999, falling five short of 2020 and 31 short of 2000.

Of all 260 3%+ daily declines in QQQ since 1999, 143 occurred between the start of 2000 and the end of 2002 (the unwinding of the dot-com bubble). During this time, QQQ fell a whopping 74.3%! The chart below shows QQQ since 1999, with the red dots marking each 3%+ decline.

QQQ’s performance following these occurrences is heavily skewed by the dot-com era weakness. While performance over the following week has been slightly better than average versus all periods since 1999, forward returns in the following one and three months have trailed the long-term averages. Since the end of the dot-com bubble burst (2003), forward returns following these occurrences looks much more attractive with QQQ averaging a gain of 44 bps (median: 54 bps) in the week following a decline of 3%+. Over the following month, QQQ has averaged a gain of 1.4% (median: 1.6%) and over the next three months has averaged a gain of 7.3% (median: 7.2%). The positivity rates over the following week, month, and three months have been 57.6%, 58.3%, and 74.5%, respectively. Click here to learn more about Bespoke’s premium stock market research service.

Bespoke’s Morning Lineup – 6/29/22 – Limping into Halftime
See what’s driving market performance around the world in today’s Morning Lineup. Bespoke’s Morning Lineup is the best way to start your trading day. Read it now by starting a two-week trial to Bespoke Premium. CLICK HERE to learn more and start your trial.
“In times of adversity and change, we really discover who we are and what we’re made of.” – Howard Schultz
Below is a snippet of content from today’s Morning Lineup for Bespoke Premium members. Start a two-week trial to Bespoke Premium now to access the full report.
After two days in a row where the S&P 500 opened firmly in positive territory but gave up all of those gains and then some throughout the trading day, futures were lower earlier on but have picked up a little bit of steam as we approach the opening bell. Treasury yields are lower this morning as investors shift out of risker assets on economic concerns.
On the economic calendar, revised GDP was just released and came in slightly weaker than expected at a level of -1.6% versus forecasts for a decline of 1.5%. Personal Consumption significantly missed expectations (1.8% vs 3.1% estimate), GDP Price Index came in higher (8.2% vs 8.1%), and Core PCE was also revised higher (5.2% vs 5.1%). Lower than expected growth and higher than expected inflation. Not exactly the combination equity investors want to see.
In today’s Morning Lineup, we discuss the latest moves in Asian and European markets, as well as a look at plunging economic confidence in Europe, South Korea, and Sweden.
After opening firmly in positive territory yesterday and trading up over 1% in early trading, the S&P 500 steadily traded lower throughout the trading day and finished near the lows of the day with a decline of over 2%. Intraday reversals like these where the market opens strong only to have the rug pulled out from under it really do a number on what is already battered investor sentiment. 2022 isn’t even half over, but yesterday’s reversal is already the fourth time this year that the S&P 500 has traded up at least 1% at some point in the trading day only to finish down over 1%. The other three days were 1/20/22, 4/21/22, and 5/11/22.
The year is less than half over, but if it ended today, 2022 would already rank as the third-largest number of negative reversals of this magnitude in a calendar year behind only 2008 (12) and 2009 (7). Like an old pair of socks, this market just can’t stay up.

Start a two-week trial to Bespoke Premium to read today’s full Morning Lineup.
Shorts’ Relative Break Out
Alongside the broader equity market, the most heavily shorted names have likewise been rallying off their lows in the past several days (before today). As for how significant of a rally that has been, on a relative basis, the 100 most heavily shorted stocks versus the Russell 3,000 have broken out of the downtrend that has been in place since the height of the meme stock mania in January of last year.
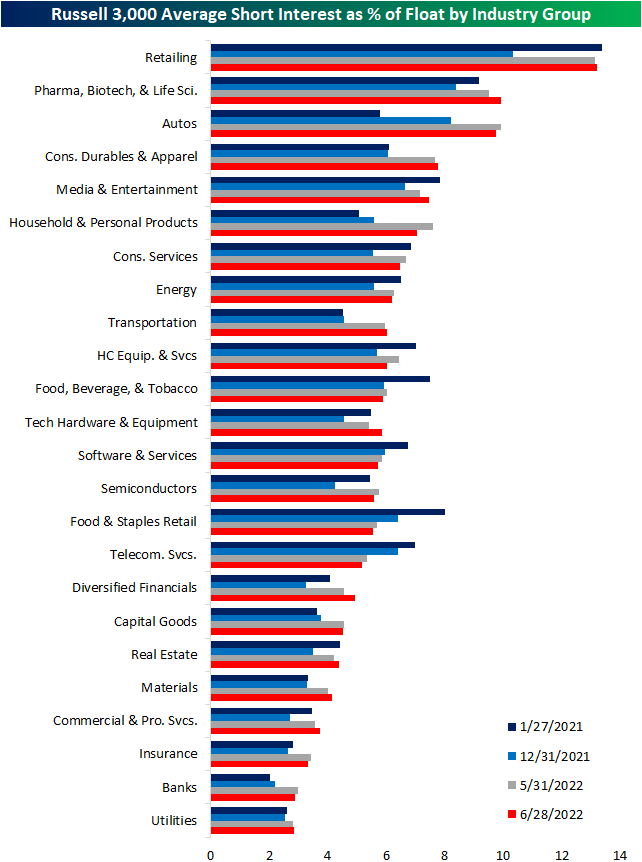
The latest short interest data as of June 15th was released yesterday, and the aggregate level of short interest for the whole of the Russell 3,000 rose from 5.1% of float as of the end of May to 5.67% in mid-June which is the highest level since last October. Below we show the average reading for the stocks of each industry group at various points in time since the historic short squeezes of January of last year. As shown, last year saw a general unwinding of short interest across industry groups, but the bear market this year has resulted in those readings starting to rise once again.
Some industries like Retail—which is also the industry with the highest average short interest reading—have seen their readings essentially return to Meme Stock Mania peak readings. Others like the Autos or Household and Personal Products industries are much more heavily shorted than they were a year and a half ago. That is not to say all industries have seen short interest rise. Food and Staples Retail, Software and Services, and Telecom Services, to name a few, currently have lower average readings on short interest than last year, at the end of last year, and the last report. In other words, while the aggregate level of short interest has been headed higher, there is some nuance as to which areas of the market have seen build-ups in short interest over the past year and a half.
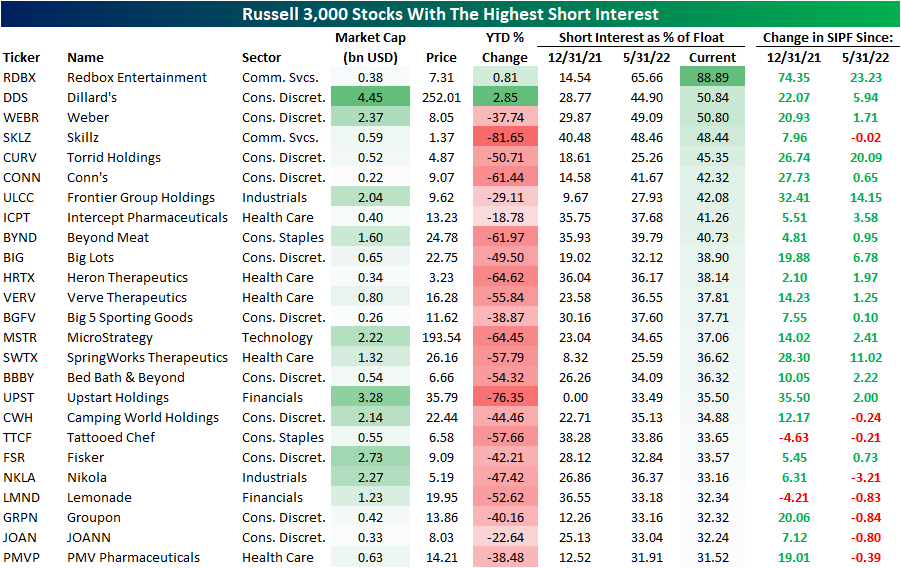
Taking a more granular look at which stocks in the index currently have the highest levels of short interest, recent SPAC, Redbox Entertainment (RDBX), tops the list with nearly 90% of its currently tradable shares sold short. Other than RDBX, there are only two other stocks with over half of float sold short: Dillard’s (DDS) and Weber (WEBR). While their short interest readings are similar, their performance year to date could not be more different. The former is one of the only names higher with a meager 2.85% gain whereas Weber (WEBR) has dropped 37.7%. Even though that is a huge decline, it is actually better than average for the whole of the 25 most heavily shorted names. The average decline year to date for this group is 45.8%. Although some names on this list have seen big increases in short interest between the latest updates, there are also a handful that have seen modest declines likely as existing shorts take profit following further declines. Click here to learn more about Bespoke’s premium stock market research service.