Bespoke’s Morning Lineup – 8/23/22 – Hoping for a Turnaround
See what’s driving market performance around the world in today’s Morning Lineup. Bespoke’s Morning Lineup is the best way to start your trading day. Read it now by starting a two-week trial to Bespoke Premium. CLICK HERE to learn more and start your trial.
“Coaches have to watch for what they don’t want to see and listen to what they don’t want to hear.” – John Madden

Below is a snippet of content from today’s Morning Lineup for Bespoke Premium members. Start a two-week trial to Bespoke Premium now to access the full report.
Futures are marginally higher this morning as investors continue to apprehensively await Friday’s speech by Fed Chair Powell in Jackson Hole. After a quiet day for economic data to kick off the week, today we’ll get updates on manufacturing and services activity with preliminary PMI readings from S&P 15 minutes after the opening bell. Then, 15 minutes later, we’ll get the release of the August Manufacturing report from the Richmond Fed along with New Home Sales. Investors aren’t expecting much in the way of strength from these reports, so hopefully for bulls, they don’t put too much upward pressure on interest rates as the 10-year yield is once again comfortably above 3%.
It’s getting to the point where you can set your clock to it. When the yield on the 10-year US Treasury hits 3%, sell stocks. Back in early May, when we first topped 3%, the S&P 500 dropped 5% in a week and 1% over the next month. In early June, it happened again. The 10-year yield topped 3% for the first time in four weeks, and once again the S&P 500 dropped 9% in the next week and 7% over the next month. Yesterday, the 10-year yield once again moved above 3% for the first time in a month, and the S&P 500 fell 2%!
The chart below shows the S&P 500 over the last 12 months with red dots indicating every day that the 10-year yield finished north of 3%. Not a good thing for equity performance. Will this be the market’s third strike or will the third time be the charm?

You can’t fault equity investors for being uneasy given the moves we have seen in the US Treasury market lately. Back in mid-June, the year/year change in the 10-year yield was more than 200 basis points (bps), and it still stands at 177 bps. That magnitude of change in the span of a year is practically unheard of during the careers of most people currently on Wall Street. While there were similar spikes in yield coming out of the Financial Crisis and back in mid-2004, the only period where yields experienced an even greater increase was back in early 2000.

Our Morning Lineup keeps readers on top of earnings data, economic news, global headlines, and market internals. We’re biased (of course!), but we think it’s the best and most helpful pre-market report in existence!
Start a two-week trial to Bespoke Premium to read today’s full Morning Lineup.
Dollar in Demand Means Domestic Domination
The US Dollar Index (DXY) is at the highest level in a little over twenty years today, bringing the total rally off of the January 2021 low to +21.8%. While that is a notable new high, a massive reason for the move has been a result of the Euro as it is now back to parity with the dollar. The composition of the dollar index places a massive 57.6% weight on the Euro, meaning swings in EURUSD largely impact DXY. As shown in the chart below, the Dollar index just hit another multi-year high today and is back to levels last seen in the early 2000s.

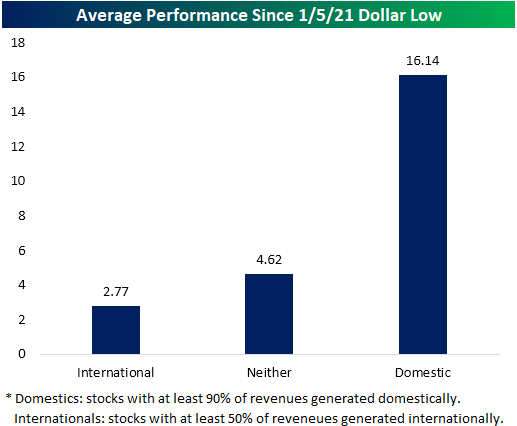
A stronger dollar hurts companies that generate larger portions of their revenues outside of the US, and we’ve seen that play out in terms of stock market performance during the dollar’s 18+ month rally. We keep track of geographic revenue exposure for stocks in the Russell 1,000 in our International Revenues Database (available to Bespoke Premium and Bespoke Institutional members). Below we show the average performance of Russell 1,000 stocks that generate 50% or more of their revenues outside of the US since the Dollar Index’s low in January 2021. We also show the average performance of Russell 1,000 stocks that generate 90%+ of their revenues domestically, which should benefit from a stronger dollar. As shown, the average ‘domestic’ stock in the Russell 1,000 has risen 16% during this dollar rally, while the group of internationals (stocks with over half of their revenues generated outside the US) have risen less than 3%. As for the rest of the stocks in the index which do not fall into either category, the average gain has only been 4.62%.
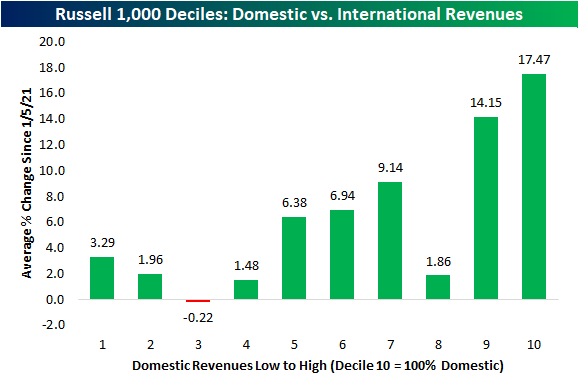
Taking a more granular look, below we break down the Russell 1,000 into equal sized deciles based on the international revenue exposure with the 10th decile comprised of stocks with 100% of revenues generated domestically. Again those groups with high domestic revenues are massively outperforming with the ninth and tenth deciles having experienced rallies of 14.15% and 17.47%, respectively. The other end of the spectrum have seen low single digit rallies and even a modest 22 bps decline for the third decile. Click here to learn more about Bespoke’s premium stock market research service.
Given the nature of various businesses, some sectors naturally will have greater domestic/international revenue exposures than others. For example, Utilities and Real Estate whose operations are largely within the US have nearly all of their revenues generated domestically. At the same time, these two defensive groups have been some of the top performing sectors since the dollar’s low. Energy has posted much stronger returns than any other sector while it also has the fourth highest domestic revenue exposure behind Financials. Materials and Tech have the lowest share of revenues generated within US borders while their returns since last January have been middling.

Democrats Expected to Keep Senate Control
President Joe Biden currently has the worst pre-mid-term approval rating since President Truman in 1950. A multitude of factors, including inflation, the botched withdrawal from Afghanistan, weakening economic data, age, and a lack of definitive action on campaign promises have all contributed to the President’s unpopularity. Although Americans are generally dissatisfied with the President, betting markets still project a nearly two-thirds chance that Democrats retain control of the Senate (chart below from electionbettingodds.com). The only two previous Presidents that saw approval ratings lower than Biden’s heading into mid-terms (since the start of WWII), Roosevelt in 1942 (third term) and Truman (first term) in 1946, ended up in the mid-terms losing twelve and five senate seats, respectively. In fact, only five Presidents have seen their party’s position in the Senate improve or remain flat since the start of WWII in a mid-term election cycle. In these five cycles, the sitting President averaged an approval rating of 57.2%, which is 19.2 percentage points higher than that of Biden.

Although only 20% of Presidential terms since the start of WWII have seen their party gain Senate seats during mid-terms, subsequent sessions of congress following these election cycles passed some significant legislation. The 88th Congress (under the Kennedy/Johnson administration) passed the Civil Rights Act of 1964, which prohibited discrimination on the basis of race, sex, religion, ethnicity, or national origin. In addition, that session of congress banned the discrimination of pay in regards to sex, and the 24th amendment was passed (which banned states from making the right to vote in federal elections conditional). The 92nd Congress (under Nixon) removed the dollar from the gold standard and established Title IX. The 116th Congress under Trump passed the CARES act, which helped the country recover from the pandemic and funded vaccination initiatives.
Regarding equity market returns, in the five mid-terms where the sitting President’s party gained Senate seats in a mid-term election year, the S&P 500 has averaged a gain of 3.1% between the election date and year-end, posting gains three out of five times. Click here to start a two-week trial to Bespoke Premium and receive our paid content in real-time.
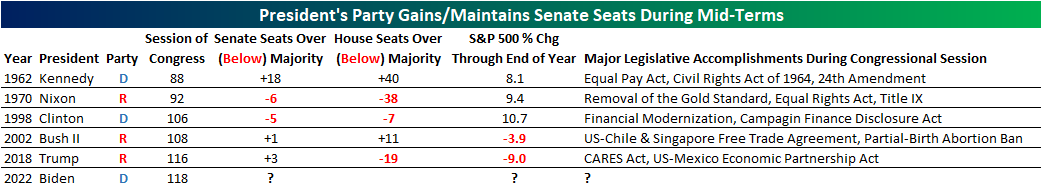
The table below summarizes every mid-term election year since the US entered WWII, For each cycle, we show the number of seats gained or lost by the President’s party, the S&P 500’s YTD performance as well as the YTD change in the 10-year US Treasury yield. In terms of economic data, we also included a look at the y/y change in CPI and the Unemployment Rate (through September), and then finally Gallup’s Presidential Approval Rating. Although one might assume that a strong stock market boosts the President’s party in the Senate for the mid-terms, the equity market was down on a YTD basis heading into mid-terms in three of the five years highlighted above. However, the average y/y change in CPI was just 2.7% and only above 5% once. For the sake of comparison, y/y headline CPI as of the end of July currently stands at 8.5%. In terms of approval ratings, every other President who saw a gain in Senate seats in a mid-term election year had the approval of a majority of Americans, whereas nearly two-thirds of Americans currently disapprove of the President. In those mid-term years when the President had an approval rating below 50%, the average loss of Senate seats for the President’s party was five, and the only one to pick up Senate seats was Trump (+2) in 2018. Given this backdrop, the possibility of Democrats keeping their effective majority in the Senate would seem unlikely, but with less than three months until Election Day, the betting markets say otherwise. Click here to start a two-week trial to Bespoke Premium and receive our paid content in real-time.

Bespoke’s Morning Lineup – 8/22/22 – Looking Ahead to Jackson Hole
See what’s driving market performance around the world in today’s Morning Lineup. Bespoke’s Morning Lineup is the best way to start your trading day. Read it now by starting a two-week trial to Bespoke Premium. CLICK HERE to learn more and start your trial.
“You are always a student, never a master. You have to keep moving forward.” – Conrad Hall
Below is a snippet of content from today’s Morning Lineup for Bespoke Premium members. Start a two-week trial to Bespoke Premium now to access the full report.
It’s another weak showing for the bulls this morning as investors assess the upcoming Jackson Hole Fed meeting and grasp to come up with what could be a positive takeaway for financial markets. Risk assets have had big summer rallies and Powell and Company have no interest in being seen as cheerleading the gains, so it is widely assumed that the tone will be hawkish. It’s a quiet day on the data front, as the only economic report on the calendar is the Chicago Fed National Activity Index for July which actually came in better than expected at +0.27 versus expectations for a reading of -0.25.
In what looks like a textbook example of a bear market rally grinding to a halt right at resistance, the S&P 500’s attempt to take out its 200-day moving average (DMA) proved extremely unsuccessful in its first and only attempt last week. The bulls cut out early Friday and still appear to be on vacation heading into the new week as the S&P 500 appears to be bookending the weekend with declines of over 1% on each side. Rallies can’t go on forever, so the pullback shouldn’t surprise anyone, but if the bulls don’t get back on the field soon, the S&P 500’s chart will only look increasingly worse.

The S&P 500 snapped a four-week winning streak last week, and most sectors contributed to the decline. Leading the way lower, Communication Services and Materials each pulled back over 2%. In the process, Communication Services moved back into the down 25% YTD range and is one of only two sectors that is no longer overbought. Besides these two sectors, five others pulled back over 1% last week, so the declines were broad-based. On the downside, defensives attracted investor interest with Consumer Staples and Utilities rallying more than 1%. Along with those two, Energy also managed to rally more than 1% taking its YTD gain back over 46%.

Our Morning Lineup keeps readers on top of earnings data, economic news, global headlines, and market internals. We’re biased (of course!), but we think it’s the best and most helpful pre-market report in existence!
Start a two-week trial to Bespoke Premium to read today’s full Morning Lineup.
Bespoke Brunch Reads: 8/21/22
Welcome to Bespoke Brunch Reads — a linkfest of the favorite things we read over the past week. The links are mostly market related, but there are some other interesting subjects covered as well. We hope you enjoy the food for thought as a supplement to the research we provide you during the week.
While you’re here, join Bespoke Premium with a 30-day free trial!
Decarbonization
Germany to Keep Last Three Nuclear-Power Plants Running in Policy U-Turn by Bojan Pancevski (WSJ)
With Russia slashing gas supplies, Germany is facing a long, cold winter, but delaying full shutdown of its last three nuclear plants may help stave off the cold. [Link; paywall]
Can the F-150 Lightning Make Everyone Want a Truck That Plugs In? by Talmon Joseph Smith and David Walter Banks (NYT)
As battery manufacturing scales up in rural Georgia to fill the frames of F-150s, it’s still unclear if the truck buyers in the heartland of US pickup demand will adopt the batteries that they build in their local factory. [Link; soft paywall]
Crypto
Fact-checking SBF’s ‘circle jerk’ by Bryce Elder and Robin Wigglesworth (FTAV)
FTX founder and crypto advocate Sam Bankman-Fried recently went on a long Twitter rant about the allegedly circular nature of “tradfi” financial flows. This post is a useful corrective of some of the misrepresentations. [Link; registration required]
The Crypto Geniuses Who Vaporized a Trillion Dollars by Jen Wieczner (NYMag)
Borrowings running near $3bn led to an unprecedented collapse in monster crypto firm Three Arrows Capital this year, fueling a substantial portion of the subsequent collapse in those markets more broadly. Here’s the inside story. [Link; soft paywall]
Tragedy
Should It Be Easier to Take Away a Driver’s License? by Alissa Walker (NYMag)
Why so many Americans who have proven they have no business behind the wheel are still causing crashes that kill tens of thousands per year across the country. [Link]
Russia’s Republic of Grief by Nanna Heitmann and Keith Gessen (NYer)
Soldiers fighting for Russia are overwhelmingly from poor, ethnically diverse areas of the sprawling country where economic opportunities are negligible and the military is one of the only ways out. [Link]
Corporate Press Releases
American Airlines Announces Agreement to Purchase Boom Supersonic Overture Aircraft, Places Deposit on 20 Overtures (American Airlines)
Denver-headquartered Boom has taken a deposit for 20 supersonic aircraft from American, with as many as 20 more planes to follow as the startup moves towards a 2026 target test flight for its Overture airliner. [Link]
Illuminating possibility: Duke Energy and Ford Motor Company plan to use F-150 Lightning electric trucks to help power the grid (Yahoo!/PRNewswire)
A Carolinas utility will work with Ford customers to test a program that takes electricity from parked EVs in order to balance the grid during periods of peak demand. [Link]
Student Loans
Biden administration cancels $3.9 billion in student debt for 208,000 borrowers defrauded by ITT Tech by Annie Nova (CNBC)
Student loan balances borrowed by students at ITT Technical Institute will have their remaining balances forgiven in response to findings that the school engaged in widespread and pervasive misrepresentations. [Link]
Comebacks
Adam Neumann Gets a New Backer by Andrew Ross Sorkin, Vivian Giang, Stephen Gandel, Lauren Hirsch and Ephrat Livni (NYT)
The disgraced founder of WeWork has received the largest seed investment in the history of Andreessen-Horowitz, for a company that at this point is nothing more than a vague idea on paper. [Link; soft paywall]
Drought
How We Got Into This Mess on the Colorado River by Jack Schmidt, John Fleck, and Eric Kuhn (Inkstain)
As the flow of water down the mighty Colorado trickles to almost nothing, years of excessive draws on the waterway are catching up with consumption vastly exceeding the flow of water through the river. [Link]
Politics
Conservative push to alter Constitution focuses on primaries by Nicholas Riccardi (AP)
A little-noticed push to re-write the US Constitution via a convention of states has started to gather steam, although the radical and extreme motivations of the movement are far from being realized at this point. [Link]
Read Bespoke’s most actionable market research by joining Bespoke Premium today! Get started here.
Have a great weekend!
The Bespoke Report + Q3 Macro Report
This week’s Bespoke Report newsletter is now available for members.
This week we have published our weekly Bespoke Report plus our quarterly Macro Report by Bespoke Macro Strategist George Pearkes.
To read both and access everything else Bespoke’s research platform has to offer, start a two-week trial to one of our three membership levels.


Bespoke Morning Lineup – 8/19/22 – The 1962, 1970 Comp
See what’s driving market performance around the world in today’s Morning Lineup. Bespoke’s Morning Lineup is the best way to start your trading day. Read it now by starting a two-week trial to Bespoke Premium. CLICK HERE to learn more and start your trial.
“If you don’t know who you are, the stock market is an expensive place to find out.” – Adam Smith, The Money Game
Below is a snippet of content from today’s Morning Lineup for Bespoke Premium members. Start a two-week trial to Bespoke Premium now to access the full report.
With August coming to an end soon and what has historically been the worst month of the year for the stock market — September — on deck, this morning we looked for years similar to 2022 that saw strong S&P 500 gains in the first two months of Q3 even though the index was still down big YTD.
Only two other years since WW2 really fit the bill. Both 1962 and 1970 saw 7%+ gains in the first two months of Q3 with the S&P still down more than 10% YTD through August. Below is a chart showing the YTD % change throughout the year in 1962, 1970, and so far in 2022. The patterns look quite similar, and it’s noteworthy that 1962 and 1970 were both mid-term election years for first-term Presidents, just like 2022.
In September 1962, the S&P fell 4.8%, but after that weakness, the index surged higher in Q4. In September 1970, the S&P rallied 3.3% and continued to gain sharply in Q4 as well. In both 1962 and 1970, the S&P was higher from the end of August through year-end. Investors would certainly take a repeat of that this year!


Our Morning Lineup keeps readers on top of earnings data, economic news, global headlines, and market internals. We’re biased (of course!), but we think it’s the best and most helpful pre-market report in existence!
Start a two-week trial to Bespoke Premium to read today’s full Morning Lineup.
Total Return vs Price Change Spreads
As we mentioned in today’s Chart of the Day, there can be a wide spread between total returns and price change based on dividend yield. Although it doesn’t always make financial sense for a company to pay dividends, they can certainly magnify returns all else equal. Click here to start a two-week trial to Bespoke Premium and receive our paid content in real-time.
The table below outlines twenty S&P 500 stocks that have seen a high percentage of their returns over the last twenty years come from dividends. The average stock on this list has seen over 80% of their gains over the last two decades come from dividends alone. Although the average stock on this list has only seen a price gain of 61.1% since August of 2002, their average total return when factoring in dividends re-invested has been 278%.

To show you what we mean, below is a chart of price change versus total return over the last 20 years for Altria Group (MO). As you can see, the dividend in this case turns a below average stock into an outperformer. Click here to start a two-week trial to Bespoke Premium and receive our paid content in real-time.

The Bespoke 50 Growth Stocks — 8/18/22
The “Bespoke 50” is a basket of noteworthy growth stocks in the Russell 3,000. To make the list, a stock must have strong earnings growth prospects along with an attractive price chart based on Bespoke’s analysis. The Bespoke 50 is updated weekly on Thursday unless otherwise noted. There were three changes to the list this week.
The Bespoke 50 is available with a Bespoke Premium subscription or a Bespoke Institutional subscription. You can learn more about our subscription offerings at our Membership Options page, or simply start a two-week trial at our sign-up page.
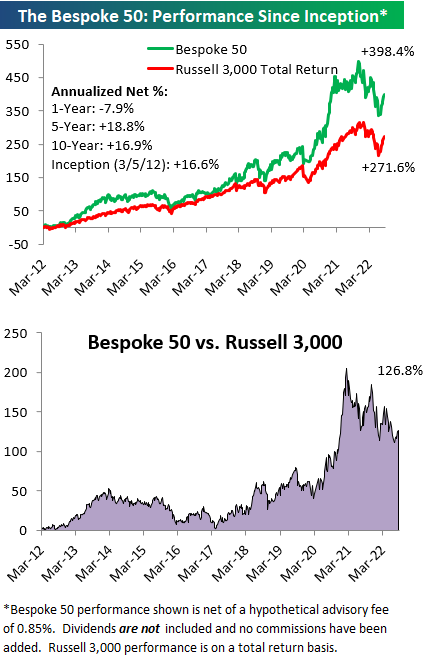
The Bespoke 50 performance chart shown does not represent actual investment results. The Bespoke 50 is updated weekly on Thursday. Performance is based on equally weighting each of the 50 stocks (2% each) and is calculated using each stock’s opening price as of Friday morning each week. Entry prices and exit prices used for stocks that are added or removed from the Bespoke 50 are based on Friday’s opening price. Any potential commissions, brokerage fees, or dividends are not included in the Bespoke 50 performance calculation, but the performance shown is net of a hypothetical annual advisory fee of 0.85%. Performance tracking for the Bespoke 50 and the Russell 3,000 total return index begins on March 5th, 2012 when the Bespoke 50 was first published. Past performance is not a guarantee of future results. The Bespoke 50 is meant to be an idea generator for investors and not a recommendation to buy or sell any specific securities. It is not personalized advice because it in no way takes into account an investor’s individual needs. As always, investors should conduct their own research when buying or selling individual securities. Click here to read our full disclosure on hypothetical performance tracking. Bespoke representatives or wealth management clients may have positions in securities discussed or mentioned in its published content.
Bulls Set a New High
Bullish sentiment continued its recent run of increases according to the weekly AAII individual investor sentiment survey. Hitting 33.3% this week, bulls are at the highest level since the last week of 2021. That 2022 is nearly 2/3 complete and we still haven’t seen a bullish reading over 33.3% tells you how negative investors have been this year.

Bears also ticked up this week reaching 37.2% versus 36.7% last week. While bearish sentiment has only been below 40% for three weeks in a row, that is the longest stretch of sub-40% readings since the start of the year.

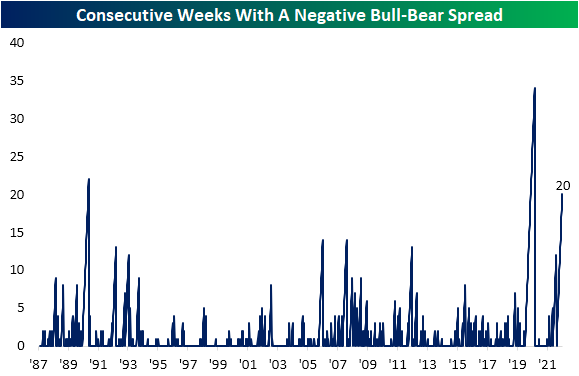
With more bears than bulls once again this week, the bull-bear spread has now been negative for 20 straight weeks.
With both bulls and bears higher, neutral sentiment was the only reading to fall this week. Neutral sentiment dropped 1.7 percentage points from 31.2% down to 29.5%. That was only the lowest reading in four weeks as neutral sentiment sits the closest to its historical average of 31.4%. Click here to learn more about Bespoke’s premium stock market research service.
