Gold Breaks Out Ahead of Election and CPI
High inflation and the aggressively hawkish monetary policy that has come in response, an election, and battered risk assets lend plenty of reason for investors to have sought out safe havens for their money this year. However one such asset, gold, has gotten crushed all the same. The yellow metal is down 18.5% from its 52-week high set in the early spring but on the bright side, it has begun to break out of its downtrend. As shown below, gold has tested support at roughly around $1,620 at multiple points this fall. After the last successful test only about a week ago, front-month futures have surged over 5%. The result has been an upside break of the longer-term downtrend as well as the 50-DMA. This is the first time since the spring gold has traded considerably above that moving average.
While that positive technical development is in the books, it is not necessarily out of the woods yet. There has not been a higher high yet meaning a move above last month’s unsuccessful test of its 50-DMA (around $1,730) would be the next hopeful sign for gold bugs.

Additionally, the current run has occurred at an interesting point in time. Historically considered a prime safe haven asset, gold’s run over the past few days has coincided with a couple of catalysts for uncertainty in the headlines: the midterm election and tomorrow’s CPI print. Based on where gold is trading as of this writing, the metal is up nearly 5.5% over the past four days. As shown below, in the four days leading up to every other CPI release since at least June 1998, that ranks as the fourth-best pre-CPI rally and only the fifth time it has rallied more than 5%. Click here to learn more about Bespoke’s premium stock market research service.

Bespoke’s Morning Lineup – 11/9/22 – Time to Focus on CPI
See what’s driving market performance around the world in today’s Morning Lineup. Bespoke’s Morning Lineup is the best way to start your trading day. Read it now by starting a two-week trial to Bespoke Premium. CLICK HERE to learn more and start your trial.
“Once you replace negative thoughts with positive ones, you’ll start having positive results.” – Willie Nelson

Below is a snippet of content from today’s Morning Lineup for Bespoke Premium members. Start a two-week trial to Bespoke Premium now to access the full report.
If you thought the midterm elections were behind us, think again. Polls have been closed for nearly 12 hours in most jurisdictions, but the results of many contests are still up in the air. Markets hate uncertainty, so as you might expect, equity futures are lower heading into the opening bell, but the losses at this point, have been relatively contained. The economic calendar is quiet today, but tomorrow’s CPI looms on the horizon, and we’re still getting a heavy dose of earnings reports. The recent trend has not been nearly as strong as it was earlier in the reporting period as instances of lowered guidance have become increasingly common.
No matter what the results of the midterm elections were, people were going to wake up in a bad mood this morning. In some ways, the fact that there has been so little change in either direction only makes things worse since no one will be happy. Relative to expectations, Democrats clearly outperformed most expectations, though. Whatever your mood this morning, though, get over it. Like oil and water, politics and investing don’t mix, and you should never let your political ideology cloud your investment decisions. Relative to yesterday, very little has changed. The Fed is still aggressively hiking rates, the economy is weakening, and the stock and bond markets are at the tail end of one of their worst years in history.
As far as last night’s results go, nothing is final, but based on current estimates, the House looks like the razor-thin majority is going to shift from the Democrats to the Republicans, while Democrats are expected to maintain control of the Senate. Going back to WWII, it hasn’t been unprecedented to see smaller changes in the makeup of Congress during a midterm election, but this year’s results will likely end up near the more muted extreme at a time when no side had a decisive majority. Obviously, this is all subject to change, but what really stands out to us is how evenly divided the country is right now. The current rivalry between Republicans and Democrats stacks right up there with some of the biggest sports rivalries in history. Every two years the two sides completely go at it, taking things right down to the wire, and even many times ending up in overtime or a runoff somewhere to see which party comes out on top.

Our Morning Lineup keeps readers on top of earnings data, economic news, global headlines, and market internals. We’re biased (of course!), but we think it’s the best and most helpful pre-market report in existence!
Start a two-week trial to Bespoke Premium to read today’s full Morning Lineup.
What’s Bothering Small Businesses?
As we noted in an earlier post, the pandemic trends of tight labor markets and high inflation continue to show up in the latest NFIB survey of small business optimism, albeit readings have begun to roll over. The survey also questions firms on what they perceive to be their most pressing problems. Perhaps even more than the other indices in the report, the results of these questions have shown how front and center labor and inflation concerns continue to be.
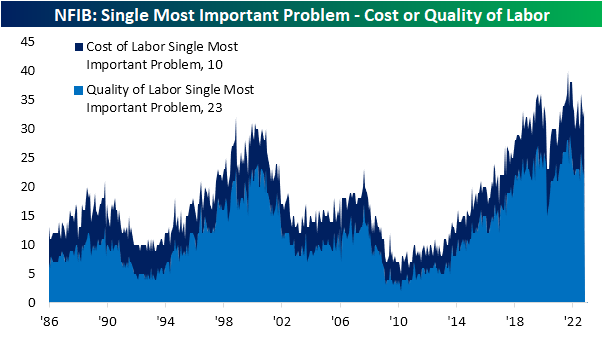
As shown below, most problems have seen record or near-record lows. Meanwhile, two-thirds of responses report either cost or quality of labor or inflation as their biggest problem.
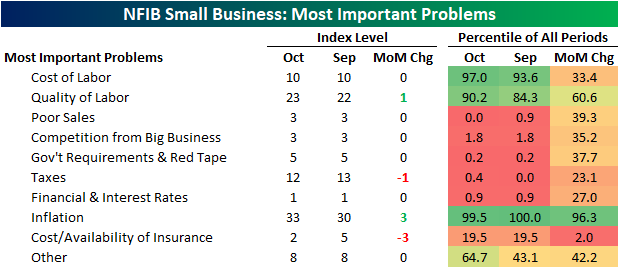
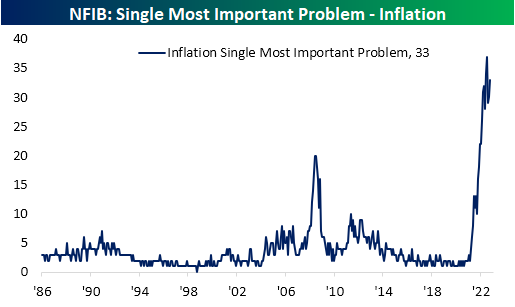
At 33%, inflation as the single most important problem has well surpassed the previous record high set during what was a much less dramatic inflationary spell in 2008. Although this reading rose 3 percentage points versus September, it is in the middle of the past few months’ range. In other words, inflation is slightly less of a concern than it was a few months ago (which is confirmed by the decline in the higher prices index), but that is certainly not to say it is no longer the single most pressing problem.
Another third of responses reported either cost or quality of labor as their biggest issues. Quality is the bigger concern of the two—which is normal from a historical perspective—accounting for a 23% share.
As we frequently note, the NFIB survey has a tendency to be impacted by politics with a bias towards Republican administrations. For example, during the Bush and Trump years, there was a far lower share of respondents reporting government requirements and taxes as their biggest concerns. With the prominence of inflation, Biden’s tenure has resulted in a different scenario in which these issues have been placed on the back burner. Granted, these issues still account for the most pressing problem of a combined 17% of responses. We would also note, these readings have seen some dramatic moves around midterm election months, but those have not always been lasting.

Finally, we would note that very few businesses (only 3%) are worried about poor sales. That is a record-low share and unchanged for the third month in a row. As we noted in our discussion of the other areas of the report, that lack of concern for the top line contrasts with businesses’ hopes for expansion and the outlook for the economy. In fact, of the reasons given for firms reporting now as not a good time to expand, sales prospects were the least pressing reason given. Click here to learn more about Bespoke’s premium stock market research service.

Small Business Labor and Inflation Slumping
The NFIB released its October data on small business optimism this morning. The headline index was expected to show further deterioration in optimism, and exactly that occurred as the index fell to 91.3 from last month’s reading of 92.1 versus expectations of 91.4. This month’s reading is off of the spring lows which had surpassed the worst levels from the early stages of the pandemic but remains one of the weakest readings of the past several years.

In the table below, we provide a breakdown of each category of the report. The headline index is now just off the bottom decile of readings as most components are likewise historically depressed. While the report was weak, there were some exceptions with strong showings in labor market metrics like Plans to Increase Employment, Job Openings Hard to Fill, and Compensation.

Even though these labor market metrics have remained at very high levels from a historical perspective, they have largely been rolling over for the better portion of the past year. Hiring plans as well as the percentage of firms reporting cost or quality of labor as their biggest issues are back to similar levels as the year prior to the pandemic. Meanwhile, actual employment changes are negative (as they have been throughout the pandemic) implying businesses are reporting a net decline in workers. That is in spite of still elevated compensation and a sharp spike higher in compensation plans. In fact, that index is just shy of the peak from the final months of 2021 after a record 9-point month-over-month jump. Companies are also reporting job openings remain hard to fill, although that index has also been on the decline alongside hiring plans. This month, the reading was unchanged at 46, the lowest level since June 2021.

Sales components have experienced far greater degrees of deterioration than employment metrics. The outlook for general business conditions has rallied back somewhat in the past few months, but it remains well below its historical range. Given the weakness in small businesses’ economic outlook, few report now as an opportune time to expand their businesses. Actual sales changes dropped to -8 in October which matched August for the weakest showing for sales since August 2020. Back in 2020 though, this index was far lower than it is now.
While the reading on the top line has held up relatively well, high inflation has meant the bottom line has taken a big hit. A net 30% of small businesses reported earnings have fallen. That reading did improve last month, though, as there have been fewer businesses reporting higher prices. In spite of those improvements, each of those indices has a long way to go until returning to what have historically been more normal levels.

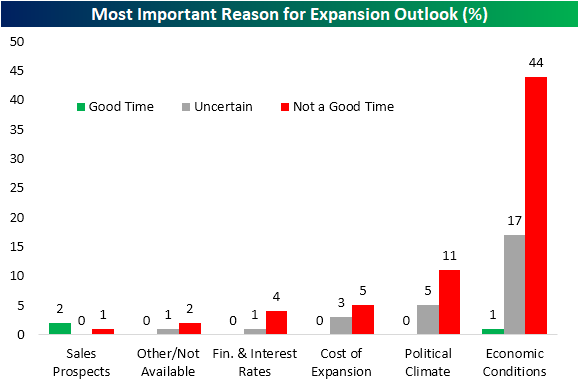
As mentioned above, a historically low share of businesses are reporting positive sentiment on the economy and that has dampened their hopes of expansion. When questioned on the reason for not expanding, 44% reported economic conditions as the reason. Another 17% reported economic conditions as the reason for uncertainty on whether or not they would expand. Aptly coming out on Election Day, we have highlighted in the past the political nature of the NFIB survey. As such, it should come as little surprise that the next biggest reason for small business hesitancy in expanding has been the political climate. Assuming the survey results react to the current election in a similar way as in the past, a strong election showing for Republicans could provide a boost to small business sentiment and plans for expansion. Finally, given continued high inflation and rates rising to combat it, the next two most widely mentioned reasons to not expand were the cost of expansion and financial conditions and interest rates with a combined 9% of responses Click here to learn more about Bespoke’s premium stock market research service.
Bespoke’s Morning Lineup – 11/8/22 – Time to Vote
See what’s driving market performance around the world in today’s Morning Lineup. Bespoke’s Morning Lineup is the best way to start your trading day. Read it now by starting a two-week trial to Bespoke Premium. CLICK HERE to learn more and start your trial.
“The fact that so many successful politicians are such shameless liars is not only a reflection on them, it is also a reflection on us.” – Thomas Sowell
Below is a snippet of content from today’s Morning Lineup for Bespoke Premium members. Start a two-week trial to Bespoke Premium now to access the full report.
Election Day is here, and hopefully, that means when we all come in tomorrow morning, the midterms will be behind us and markets can shift their focus to Thursday’s CPI. Futures are higher this morning in a modest drift higher, and the market attempts to digest the impact of higher rates. Earnings reports are still coming in hot and heavy, but the majority of the S&P 500’s largest companies have already reported, so until the retailers start reporting next week, there aren’t likely to be any major tape bombs.
28 years ago today marked the beginning of the “Republican Revolution” where Newt Gingrich led the Republican Party to gain control of both the House and Senate for the first time in more than 40 years. The 1994 midterms saw the Republican party gain 54 seats in the House and 9 seats in the Senate. The performance of Republicans in 1994 was the best in a midterm election for the party since 1946 when they picked up 12 seats in the Senate and 55 seats in the House. Since 1994, the only other midterm year where either the Democrats or Republicans picked up more seats in the Senate was in 2014 (R+9), and the only midterm where there was a larger increase for either party was in 2010 (R+63).
We won’t know until after all the votes are counted, but betting markets and many national polls suggest that like 1994, the Republican Party will win control of both the Senate and House. Given the already closely divided nature of both chambers of Congress, though, the number of seats expected to be picked up in this cycle is expected to be much smaller (3 in the Senate and around 30 in the House). Barring an extreme outcome (in either direction), though, there is unlikely to be much in the way of changes legislatively, so get ready for two years of gridlock.
As big as the Federal government has become over the decades, the impact of party control on financial markets tends to get overstated. While it most definitely has impacts on certain industries, the direction of the economy and financial markets won’t be dictated by the actions of a few hundred people in DC. Or at least that’s what we like to think, even though sometimes it seems as though that’s all the market is focused on.
Taking a stroll down memory lane, the chart below shows the performance of the S&P 500 in the year leading up to and after the 1994 midterm elections. It’s obviously only a sample size of one, so we would put little weight on it, but in an environment where good news is hard to come by, bulls will take whatever they can get. In the year leading up to the 1994 election, the S&P 500 essentially traded sideways as the markets and economy were pressured by a hawkish Fed and what would be the Orange County bankruptcy, but the year after that midterm election saw the S&P 500 surge 27.1%.

Our Morning Lineup keeps readers on top of earnings data, economic news, global headlines, and market internals. We’re biased (of course!), but we think it’s the best and most helpful pre-market report in existence!
Start a two-week trial to Bespoke Premium to read today’s full Morning Lineup.
Bespoke’s Morning Lineup – 11/7/22 – Quiet Economic Week…With One Exception
See what’s driving market performance around the world in today’s Morning Lineup. Bespoke’s Morning Lineup is the best way to start your trading day. Read it now by starting a two-week trial to Bespoke Premium. CLICK HERE to learn more and start your trial.
“Our goal has never been to make the most. It’s always been to make the best.” – Tim Cook
Below is a snippet of content from today’s Morning Lineup for Bespoke Premium members. Start a two-week trial to Bespoke Premium now to access the full report.
We got past the employment report unscathed on Friday and heading into the new week, the economic calendar is extremely light with one exception. Thursday’s October CPI report will make or break the market for the week. Economists are expecting the headline reading to rise 0.6% m/m and 0.5% on a core basis. We’re past the peak of earnings season, but the cadence will still be busy. Outside of the economy, tomorrow’s midterm elections will likely provide a good amount of sound and fury, and from a market perspective, we can only hope that the results aren’t drawn out for days.
These are the performance numbers for the S&P 500 on the last trading day of the prior seven weeks: -1.72%, -1.51%, -2.80%, -2.37%, +2.37%, 2.46%, and 1.36%, respectively. After these moves, the S&P 500 has now ended the week with a 1% move 29 times this year. As shown in the chart below, since the NYSE moved to the five-trading day week in late 1952, 2022 already has seen the most 1% moves to end a trading week and there are still eight weeks left in the year!

The S&P 500 finished a down week on a positive note last week, but even on the week’s one positive day, the S&P 500 closed lower than it opened (as it did every other day last week). After rallying up to the 50-day moving average during the trading day, the S&P 500 pulled back from its early highs. Futures are indicating a positive open this morning, but in order for a bounce to have any staying power, that 50-day will have to be broken to the upside.

Our Morning Lineup keeps readers on top of earnings data, economic news, global headlines, and market internals. We’re biased (of course!), but we think it’s the best and most helpful pre-market report in existence!
Start a two-week trial to Bespoke Premium to read today’s full Morning Lineup.
Bespoke Brunch Reads: 11/6/22
Welcome to Bespoke Brunch Reads — a linkfest of the favorite things we read over the past week. The links are mostly market related, but there are some other interesting subjects covered as well. We hope you enjoy the food for thought as a supplement to the research we provide you during the week.
While you’re here, join Bespoke Premium with a 30-day trial!
Labor Markets
CEO Patrick Collison’s email to Stripe employees by Patrick Collison (Stripe)
Amidst a blizzard of tech layoffs, payments company Stripe unveils a remarkably worker-friendly list of transition policies for fired workers that total about 14% of the labor force. [Link]
A Labor Supply Shock? by Preston Mui (Employ America)
Younger cohorts have almost entirely returned to pre-COVID levels of employment, leaving only the oldest segment of the labor market entirely responsible for the alleged lack of labor supply this year. [Link]
Liminal Spaces
Why One Chinatown Mini-mall Languishes While Another Thrives by Wilfred Chan (Curbed)
Detailed reporting on the magic of cheap rent in Chinatown and the downward spiral of the neighborhood over the past few decades. [Link]
The Eerie Comfort of Liminal Spaces by Jake Pitre (MSN/The Atlantic)
An investigation into why so many people are so enthusiastic for the “strange solace of being on the threshold of monumental change” in picture form. [Link]
Sports
Why is participation in girls’ high school sports — yes, even basketball — waning? by Langston Wertz Jr (Charlotte Observer)
High school sports participation is down sharply, with participation in basketball down 14% over the past decade, to the point that many schools are fielding only a varsity team with no JV squad and no cuts. [Link; soft paywall]
Professional Cornhole Has a Cheating Scandal Called BagGate by John Clarke (WSJ)
The formerly casual pastime has attracted sponsorship dollars and lots of attention, to the point where teams in the national finals were both caught cheating. [Link; paywall]
Traffic James
The Metals for Your EV Are Stuck in a 30-Mile Traffic Jam by Matthew Hill (Bloomberg)
Central African copper mines are tied to the rest of the world with tenuous and often-broken logistics lines that stretch across the southern half of the continent. [Link; soft paywall]
Why Egypt became one of the biggest chokepoints for Internet cables by Matt Burgess (Ars Technica)
Subsea internet cables are critical links for global connectivity with enormous volumes of traffic passing through physical chokepoints like the narrow land route between the Red Sea and Mediterranean. [Link]
China
China’s Local Governments Should Put State Assets to Better Use, Ministry Says by Chen Yikan (Yi Cai Global)
Beijing is starting to push local governments to start selling off assets including houses, land, and cars; other assets like stakes in businesses could also be sold to fund local government deficits. [Link]
Lasers
What it’s like to fire Raytheon’s powerful anti-drone laser by Kelsey D. Atheron (PopSci)
A small four wheeler can hold the 10 kilowatt Raytheon system designed to target and destroy drones on the battlefield. [Link]
Previewing Our Wisconsin Polling Experiment by Nate Cohn (NYT)
In an effort to correct for very low response rates in Wisconsin, the NYT attempted to pay respondents to complete one of its polls this cycle; it’s still not clear yet whether the new approach will prove accurate or not. [Link; soft paywall]
Doom
Hedge-fund giant Elliott warns looming hyperinflation could lead to ‘global societal collapse’ by Anviksha Patel (MarketWatch)
Elliott Management’s strategy is premised on buying assets cheap, so it’s not a surprise that they would be bearish towards overall asset prices. Still, some of the language here is pretty strong stuff. [Link]
Read Bespoke’s most actionable market research by joining Bespoke Premium today! Get started here.
Have a great weekend!
The Bespoke Report — Equity Market Risk Gauge — November 2022
This week’s Bespoke Report newsletter is now available for members.
In this week’s newsletter, we’ve updated our Equity Market Risk Gauge for the month of November, and we also provide a summary of earnings season thus far, highlight downtrends for the mega-caps, check up on market internals, and take a final look at GOP and Democrat odds for the upcoming Mid-Term Elections.
To see our updated Equity Risk Gauge and access everything else Bespoke’s research platform has to offer, join Bespoke Institutional and get half off for the first three months!


On the Other Hand
Harry Truman is famous (among other things) for saying, “Give me a one-handed Economist. All my economists say ‘on hand…’, then ‘but on the other…” And it’s true. You rarely will see an economic analysis that doesn’t couch one view with an alternative scenario, and you can’t fault them for hedging their bets. Predicting the future is impossible, especially when it involves the direction of the world’s largest economy.
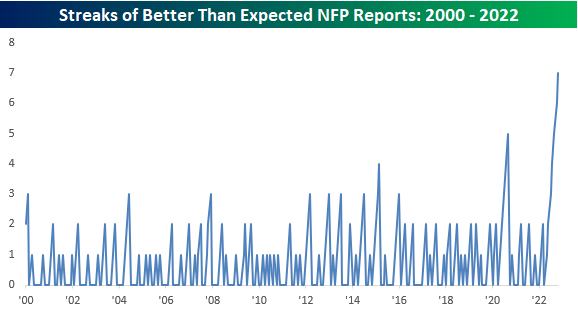
This morning’s employment report also has a number of hands. At the surface, the report was better than expected coming in ahead of expectations (261K vs 193K). As shown in the chart below, this was the seventh straight better-than-expected print and the ninth in the last ten months.

To illustrate just how impressive this recent run has been, the chart below shows streaks of better-than-expected prints in non-farm payrolls (NFP). The current streak of seven is easily the longest such streak since at least 2000.
While job growth in the US economy has consistently surpassed expectations this year, it is important to point out that the pace of job growth isn’t accelerating. This month’s print of 261K was actually the smallest monthly increase since late 2020 and is well off the peak readings seen in 2021 when the FOMC was maintaining its zero interest rate policy. To put this trend in perspective, in 2021 the average monthly change in NFP was 562K. In 2022, that average has declined to 407K, and in just the last three months, the average has been 289K. On the one hand, the job market remains strong. On the other hand, momentum has clearly peaked and there has been a trend of deceleration. Click here to learn more about Bespoke’s premium stock market research service.

Bespoke’s Morning Lineup – 11/4/22 – Jobs Jobs Jobs
See what’s driving market performance around the world in today’s Morning Lineup. Bespoke’s Morning Lineup is the best way to start your trading day. Read it now by starting a two-week trial to Bespoke Premium. CLICK HERE to learn more and start your trial.
“A man is worked upon by what he works on. He may carve out his circumstances, but his circumstances will carve him out as well.” – Frederick Douglass
Below is a snippet of content from today’s Morning Lineup for Bespoke Premium members. Start a two-week trial to Bespoke Premium now to access the full report.
Futures are rallying nicely this morning on optimism over a relaxing of COVID restrictions in China, and the gains here follow what has been an overnight rally in risk assets around the globe. If these gains can hold, it will help to reverse some of the steep losses we’ve seen this week, but we still have to get through the October Non-Farm Payrolls report. Needless to say, any strength on the jobs or wage front will not be greeted kindly by the FOMC.
Wasn’t November supposed to be a good month for stocks? We’re only three trading days into it, but already the S&P 500 is down close to 4% (-3.92%) in what ranks as the worst three-day start to a month for the index since August 2019 and the 11th worst start since late 1952 (when the five-trading day week on the NYSE began). The chart below shows the first three-day performance for the S&P 500 for every month since 1953 and what really sticks out is the fact that all but two of the months that had weaker starts were all since the start of 2000, while the other two were in December 1973 and December 1975.
We’d also note that this month’s poor start followed October’s exceptionally strong start where the index rallied 5.51% in the first three trading days of the month. That strong start ranked as the 6th strongest three-day starts to a month since 1953.

Our Morning Lineup keeps readers on top of earnings data, economic news, global headlines, and market internals. We’re biased (of course!), but we think it’s the best and most helpful pre-market report in existence!
Start a two-week trial to Bespoke Premium to read today’s full Morning Lineup.