Bespoke’s Morning Lineup – 3/10/23 – Running into the Weekend
See what’s driving market performance around the world in today’s Morning Lineup. Bespoke’s Morning Lineup is the best way to start your trading day. Read it now by starting a two-week trial to Bespoke Premium. CLICK HERE to learn more and start your trial.
“I believe that banking institutions are more dangerous to our liberties than standing armies.” – Thomas Jefferson

Below is a snippet of content from today’s Morning Lineup for Bespoke Premium members. Start a two-week trial to Bespoke Premium now to access the full report.
Futures are lower this morning heading into the 8:30 Non-Farm Payrolls report but given the action in SVB Financial (SIVB) which is trading down over 60% for the second straight day, the biggest surprise may be that futures aren’t even lower.
The February Non-Farm Payrolls report was just released and while it was mixed relative to expectations, it was generally positive for markets. Economists were expecting the headline reading to come in at 225K this morning, but the actual reading came in at 311K. Below the surface, though, the Unemployment rate was higher than expected, average hourly earnings were lower than expected, and average weekly hours were also lower than expected.
Yesterday was one of the worst days for bank stocks in years. In the 17 years that the S&P Regional Banking ETF (KRE) has been trading, Thursday’s 8.11% plunge was only the 22nd single-day decline of 7.5% or more, and it was the first since the COVID shock in early 2020. Before that, you have to go back to the debt limit and US credit rating downgrade of August 2011 to find the next occurrence when there was one day (8/8/11) when the ETF fell just under 10%. During the Financial Crisis, moves like yesterday’s almost seemed common. Whether yesterday was a one-day shock in the bank stocks or not remains to be seen, but based on the history of prior occurrences, like cockroaches, more often than not, when there’s one single-day large decline, others are usually lurking.

Our Morning Lineup keeps readers on top of earnings data, economic news, global headlines, and market internals. We’re biased (of course!), but we think it’s the best and most helpful pre-market report in existence!
Start a two-week trial to Bespoke Premium to read today’s full Morning Lineup.
50-DMAs Couldn’t Hold
Worries about banks today left major US index ETFs across the market cap spectrum back below their 50-day moving averages. The uptrend channels that have been formed over the last six months are also getting tested with this week’s move lower. You can see the current set-ups in the snapshot from our Chart Scanner tool below.

Looking at our Trend Analyzer, every sector ETF except for Technology has now moved back below its 50-day moving average. Six of eleven sectors are actually oversold (>1 standard deviation below 50-DMA), with Financials (XLF) and Health Care (XLV) at “extreme oversold” levels. XLF had been up more than 8% on the year about a month ago, but it’s now down 1.93% YTD.
Technology (XLK) and Utilities (XLU) are the only two sectors up over the last week. Interestingly, Utilities (XLU) has been one of the worst performing sectors so far this year, while Tech has been the best.

With Financials seeing such a sharp decline this week, below is a snapshot of various banks and brokers in the sector with the ones highlighted in red all now trading at least 5% below their 50-DMA. As shown, Charles Schwab (SCHW) is down the most over the last week with a decline of 12.6%, which has left it 16.4% below its 50-DMA and down nearly 20% on the year. Other names like Bank of America (BAC), JP Morgan (JPM), and Raymond James (RJF) are in extreme oversold territory as well. Of the major banks and brokers listed, Goldman Sachs (GS) has actually held up the best over the last week with a decline of just 2%. Click here to learn more about Bespoke’s premium stock market research service.

The Bespoke 50 Growth Stocks — 3/9/23
The “Bespoke 50” is a basket of noteworthy growth stocks in the Russell 3,000. To make the list, a stock must have strong earnings growth prospects along with an attractive price chart based on Bespoke’s analysis. The Bespoke 50 is updated weekly on Thursday unless otherwise noted. There were no changes to the list this week.
The Bespoke 50 is available with a Bespoke Premium subscription or a Bespoke Institutional subscription. You can learn more about our subscription offerings at our Membership Options page, or simply start a two-week trial at our sign-up page.

The Bespoke 50 performance chart shown does not represent actual investment results. The Bespoke 50 is updated weekly on Thursday. Performance is based on equally weighting each of the 50 stocks (2% each) and is calculated using each stock’s opening price as of Friday morning each week. Entry prices and exit prices used for stocks that are added or removed from the Bespoke 50 are based on Friday’s opening price. Any potential commissions, brokerage fees, or dividends are not included in the Bespoke 50 performance calculation, but the performance shown is net of a hypothetical annual advisory fee of 0.85%. Performance tracking for the Bespoke 50 and the Russell 3,000 total return index begins on March 5th, 2012 when the Bespoke 50 was first published. Past performance is not a guarantee of future results. The Bespoke 50 is meant to be an idea generator for investors and not a recommendation to buy or sell any specific securities. It is not personalized advice because it in no way takes into account an investor’s individual needs. As always, investors should conduct their own research when buying or selling individual securities. Click here to read our full disclosure on hypothetical performance tracking. Bespoke representatives or wealth management clients may have positions in securities discussed or mentioned in its published content.
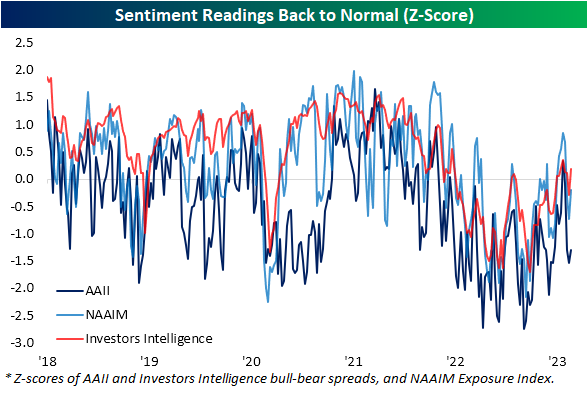
Bearish Sentiment Remains
The S&P 500’s swings higher and then lower over the past week have left sentiment little changed. For the American Association of Individual Investors’ (AAII) weekly survey, 24.8% of respondents reporting as bullish compared to 23.4% the previous week. That is the second higher reading in a row but still well below the recent high of 37.5% from one month ago.

Along with a modest bounce in bullishness, bearish sentiment has taken a modest decline falling from a recent high of 44.8% last week down to 41.7% today. That is the first decline in a month, leaving it in the middle of its range since the start of last year.

Given the moves in bullish and bearish sentiment, the bull-bear spread remains skewed in favor of bears for the third week in a row.

Following a sharp eight percentage point decline last week, neutral sentiment has bounced rising to 33.4%. Albeit higher, outside of last week, that reading would be the lowest since the end of 2022.

Although recent weeks have seen the AAII survey return to deeply bearish sentiment, other surveys are not nearly as pessimistic. While the AAII survey’s bull-bear spread sits well over a standard deviation below its historical average, the NAAIM Exposure index continues to show only modestly long positioning among active managers. Currently, that reading is 0.2 standard deviations below the historical norm. Meanwhile, the weekly Investors Intelligence survey is actually showing respondents are reporting as more bullish than has been historically normal. Click here to learn more about Bespoke’s premium stock market research service.
Seasonal Headwinds Dying Down for Claims
The S&P 500 is rallying this morning in the wake of today’s weekly jobless claims print which gave investors at least some hope that data is flying in the face of the Fed’s recent hawkishness. Whereas expectations called for initial claims to remain below 200K for the eighth week in a row, claims jumped by 21K to 211K. That is the highest reading since the week of December 24th.

As we have noted in recent weeks, although the seasonally adjusted number has gone on an impressive streak of sub-200K prints, the unadjusted number never fell below that threshold. This week saw the reading rise to 237.5K, the highest since only the second week of the year. As shown in the second chart below, the first few months of the year have historically seen claims fall with the current week standing out as one with consistently higher claims week over week. Although the direction of non-seasonally adjusted claims this week is not particularly unusual, the 35.4K increase was much larger than the historical median increase of 14k usually seen for the comparable week of the year.

All of that means that claims in general are following seasonal patterns as could be expected. In the charts below, we show the seasonal factors for initial and continuing claims. Essentially, those factors represent how elevated claims are above what has been normal historically (a reading of 100 would indicate a normal reading). Looking ahead over the next several weeks, seasonal headwinds will persist but not to the same degree as the first couple months of this year. As for continuing claims, the next several weeks will see seasonal factoring more consistently roll over even more sharply as we enter a period of the year with much less of a seasonal headwind.
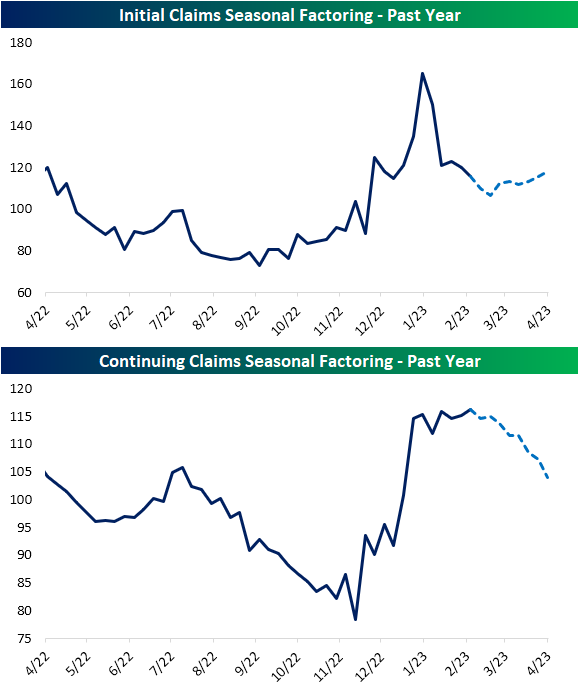
Like initial claims, seasonally adjusted continuing claims came in above expectations this week rising back above 1.7 million. At current levels, claims matched the recent high from the week of December 17th which is back in the middle of the pre-pandemic range. Click here to learn more about Bespoke’s premium stock market research service.

Bespoke’s Morning Lineup – 3/9/23 – Happy Anniversary
See what’s driving market performance around the world in today’s Morning Lineup. Bespoke’s Morning Lineup is the best way to start your trading day. Read it now by starting a two-week trial to Bespoke Premium. CLICK HERE to learn more and start your trial.
“A minute’s success pays the failure of years.” – Robert Browning
Below is a snippet of content from today’s Morning Lineup for Bespoke Premium members. Start a two-week trial to Bespoke Premium now to access the full report.
It’s been a relatively quiet morning in the markets today, but the bias had been negative as stocks in Europe are down about half of a percent. Economic data just released here in the US, though, showed that jobless claims came in above expectations with initial claims topping 200K and continuing claims topping 1.7 million. Both of these readings are the highest since December. In response to the weaker employment readings, futures have been rallying. Investors and the Fed may like this data, but you can bet that Senator Warren won’t be very happy. There’s no other data on the calendar today, so now the focus will shift to tomorrow’s February Non-Farm Payrolls.
It’s hard to believe it was 14 years ago when the S&P 500 finally made its financial crisis low setting the stage for a new bull market. Things weren’t looking good for the market or the global economy back then, but from the close on March 9, 2009, through yesterday (3/8/23), the S&P 500 rallied 490% which works out to an annualized return of 13.5%- without even including dividends!

Obviously, returns will look remarkable when you measure them from the absolute low, but what may be even more notable is to look at how an investor would have fared had they gone ‘all-in’ at the highs in October 2007 right before all hell broke loose.
The chart below shows the performance of the S&P 500 from its high on 10/9/07 through yesterday (3/8/23). Just over a year after that investment, you would have been down 50% on your way to a total decline of 57% but had you held on through those lows, your total gain since 10/9/07 would have been 155% which works out to 6.3% annualized and again, not including dividends. That’s obviously a lot less than the 13.5% annualized return you would have had from the lows in March 2009, but 6.3% still beats the level of yield you can currently get from any point on the US Treasury yield curve. The key word here is currently.

Our Morning Lineup keeps readers on top of earnings data, economic news, global headlines, and market internals. We’re biased (of course!), but we think it’s the best and most helpful pre-market report in existence!
Start a two-week trial to Bespoke Premium to read today’s full Morning Lineup.
Intraday Action Continues to Trump After Hours
Over the past couple of sessions as the market has awaited Fed Chair Powell’s testimony, the S&P 500 (SPY) has not seen particularly large gaps at the open. In fact, both on Tuesday and Wednesday, the opening gap was less than 5 bps in absolute terms. That is the first time with such tiny opening gaps in back to back days since December 28th. That being said, following the small opening gap yesterday, SPY would go on to have a much more volatile session intraday as it fell over 1.5% from open to close.
In the table below, we show each other time in SPY’s history that there has been an opening gap down of less than 5 bps followed by a decline of more than 150 bps from open to close as was the case yesterday. These types of moves have been rare with only 11 prior instances, the most recent of which was in August of last year. While today saw another small opening gap and has struggled to find a direction so far, following prior instances the S&P 500 has tended to fall further the following session with average declines one week out as well. While things generally appear more positive one month to three months out, returns are mixed relative to the norm. Meanwhile, 6 month returns tend to be much weaker than the norm with a median decline of 1.6% versus the median for all of SPY’s history of a 5.32% gain.

The past couple of days’ price action in which most of the move happens intraday is a bit unusual in another way as well. As we have noted in the past and show in the first chart below, going back to the start of SPY’s trading in 1993, nearly all of the its gains have come outside of regular trading hours. In other words, the moves in the past couple of sessions have essentially been the opposite of what is historically normal. However, that oddity is not exactly new. As we first noted roughly a month ago, for most of 2023 the after hours strategy of buying the close then selling the open has dramatically underperformed the opposite strategy of only owning when the market is open. Although that relative performance has waned a little given the past couple of days’ moves, the point stands that most of the S&P 500’s move is happening during regular trading hours in 2023. As is always the case, past performance is no guarantee of future results. Click here to learn more about Bespoke’s premium stock market research service.

Bespoke’s Consumer Pulse Report — March 2023
Bespoke’s Consumer Pulse Report is an analysis of a huge consumer survey that we run each month. Our goal with this survey is to track trends across the economic and financial landscape in the US. Using the results from our proprietary monthly survey, we dissect and analyze all of the data and publish the Consumer Pulse Report, which we sell access to on a subscription basis. Sign up for a 30-day free trial to our Bespoke Consumer Pulse subscription service. With a trial, you’ll get coverage of consumer electronics, social media, streaming media, retail, autos, and much more. The report also has numerous proprietary US economic data points that are extremely timely and useful for investors.
We’ve just released our most recent monthly report to Pulse subscribers, and it’s definitely worth the read if you’re curious about the health of the consumer in the current market environment. Start a 30-day free trial for a full breakdown of all of our proprietary Pulse economic indicators.

Bespoke’s Morning Lineup – 3/8/23 – Powell, Round Two
See what’s driving market performance around the world in today’s Morning Lineup. Bespoke’s Morning Lineup is the best way to start your trading day. Read it now by starting a two-week trial to Bespoke Premium. CLICK HERE to learn more and start your trial.
“Impossible is not a fact. It’s an opinion.” – Muhammad Ali
Below is a snippet of content from today’s Morning Lineup for Bespoke Premium members. Start a two-week trial to Bespoke Premium now to access the full report.
After modest gains overnight and earlier this morning, futures have slipped modestly into the red following yesterday’s Powell-induced decline. While past declines in response to Powell’s comments have sometimes been justified due to seemingly abrupt changes in policy, moving targets, and/or inconsistencies in his remarks, yesterday’s testimony in front of the Senate contained essentially nothing Fed officials haven’t been saying for the last several weeks, so either the markets didn’t believe what they were hearing for the last month or yesterday was an overreaction.
Markets in Europe are modestly lower at the moment in a follow-through from yesterday and more hawkish commentary from an ECB official who noted that the bank will continue hiking rates for a period of time after the March meeting. These comments came as Q4 GDP was weaker than expected, and German Retail Sales unexpectedly declined.
Speaking of Europe, while its economy has been lagging behind the US, stocks in the region have continued their recent outperformance of stocks here in the US. The first chart below shows the performance of the FTSE Europe ETF (VGK). After a sharp rally off its October lows, VGK has been in a sideways range for most of 2023 but has still managed to trade within a close range of its 52-week high. After yesterday’s decline, in fact, VGK was just 7% from a 52-week high.

US stocks, meanwhile, have been much weaker. While the rally in VGK took it back near its highs from last Spring, the rally in the S&P 500 ETF (SPY) barely even took it back above its December highs let alone the peaks from August and April. After yesterday’s decline, SPY was twice as far below its 52-week high (-14%) as VGK.

Our Morning Lineup keeps readers on top of earnings data, economic news, global headlines, and market internals. We’re biased (of course!), but we think it’s the best and most helpful pre-market report in existence!
Start a two-week trial to Bespoke Premium to read today’s full Morning Lineup.
Fedspeak Review as Powell Goes to Capitol Hill
Fed Chair Powell’s testimony on Capitol Hill over the next couple of days will be the main focus of the market, and with perceived hawkish commentary today, things don’t appear to be off to a good start. As Chair Powell highlighted, stronger-than-expected economic and inflation data has lifted expectations for interest rates which has resulted in the S&P 500 erasing earlier gains and trading down 1% on the session as of late morning.
Using data from our Fedspeak Monitor, in the chart below we show the historical average performance of the S&P 500 on days in which there is Fedspeak going back to 2018 when Powell took over as Chair (that only looks at actual Fed speakers and excludes any reports like the Beige Book, FOMC Meetings, and Meeting Minute releases which we also cover in our Fedspeak Monitor). As might be expected, hawkish commentary generally tends to be received poorly by the market with the S&P falling an average of 7.5 bps on those days compared to a 9.2 bps gain on days with dovish commentary. As for times when the speaker is Chair Powell, a hawkish tone tends to see the S&P 500 react with a decline, however, the 5.8 bps drop is smaller than the norm. That contrasts with Powell’s dovish commentary having been far more well-received by the market. More broadly, and perhaps more surprisingly, any time an active voting member of the FOMC is the speaker the average move in the S&P 500 tends to be smaller in magnitude than when it is a non-voter speaker regardless of whether the tones are hawkish or dovish. ratesd Click here to learn more about Bespoke’s premium stock market research service.
