Bespoke Brunch Reads: 11/13/22
Welcome to Bespoke Brunch Reads — a linkfest of the favorite things we read over the past week. The links are mostly market related, but there are some other interesting subjects covered as well. We hope you enjoy the food for thought as a supplement to the research we provide you during the week.
While you’re here, join Bespoke Premium with a 30-day trial!
National Security
Stratcom Commander Says U.S. Should Look to 1950s to Regain Competitive Edge by C. Todd Lopez (Department of Defense)
While the lesson of Ukraine is that many global adversaries are woefully under-equipped for wars the US might become involved in, the Secretary of Defense advocates a return to an era when the US was able to develop and procure weapons on much shorter timelines. [Link]
Canadian intelligence warned PM Trudeau that China covertly funded 2019 election candidates: Sources by Sam Cooper (Global News)
The federal elections in 2019 were targeted by Chinese intelligence networks, per an analysis by Canada’s own intelligence community. Agents were placed in MPs’ offices and campaigns were orchestrated to punish MPs viewed as insufficiently pro-China. [Link]
Wheels Come Off
FTX used $4 billion including customer funds to keep Alameda afloat: Reuters by Inbar Preiss (The Block)
As crypto exchange FTX collapsed this week, reports emerged that customer funds had been used to cover massive trading losses at an affiliated market-making firm. [Link]
Mortgage Fund in Canada Halts Payouts Amid Liquidity Crunch by Layan Odeh (Yahoo!/Bloomberg)
A Canadian mortgage firm is halting redemptions in response to repayment stress and a surge in investor requests to return their capital. [Link]
Appearances Can Be Deceiving
The U.S. Labor Market Is Less Tight Than It Appears by Rand Ghayad, Carl Shan, and Yao Huang (Harvard Business Review)
An analysis of job postings on LinkedIn suggests that much of the huge increase in job openings is a mirage, with roughly half as much true demand for workers as official statistics would otherwise indicate. [Link]
Monetary Policy Stance Is Tighter than Federal Funds Rate by Jason Choi, Taeyoung Doh, Andrew Foerster, and Zinnia Martinez (FRBSF)
When adjusting the path of the Fed Funds rate to account for information from other financial markets, the Fed Funds rate rose above 5.25% by September of this year, much more policy tightening than has actually taken place thus far. [Link]
Social Media
TikTok Secretly Scores Influencers on Metrics Like ‘Cooperation’ and ‘Diligence’ by Thomas Germain (Gizmodo)
Internal scores at TikTok are being used to rank influencers on the platform across a range of metrics that include enthusiasm, willingness to promote products, and other inputs. [Link]
How Australia became the world’s greatest lithium supplier by Royce Kurmelovs (BBC)
After riding the wave of Chinese demand for iron ore and copper in the last commodities bull market, Australia is jockeying for a spot at the top of the decarbonization supercycle as well. [Link]
Auto Industry
A City Fights Back Against Heavyweight Cars by David Zipper (Bloombeg)
Soaring demand for super-sized trucks are creating huge risks for pedestrians and the climate. Washington, DC is attempting to push back, introducing a new $500/vehicle registration fee for vehicles that weigh over 6,000 pounds. [Link; soft paywall]
Polling
The (good) pollsters got the midterms right by G. Elliott Morris (Substack)
High quality polls generally did a good job of predicting the outcome this election; by some measures, Senate polling was tied with 2006 as the most accurate cycle on record. That’s a huge contrast with the 3-4 point errors in polls for the last Presidential election. [Link]
Read Bespoke’s most actionable market research by joining Bespoke Premium today! Get started here.
Have a great weekend!
The Bespoke Report – 11/11/22 – Real? Or Just Fantasy
This week’s Bespoke Report newsletter is now available for members.
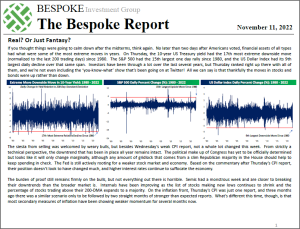
If you thought things were going to calm down after the midterms, think again. No later than two days after Americans voted, financial assets of all types had what were some of the most extreme moves in years. On Thursday, the 10-year US Treasury yield had the 17th most extreme downside move (normalized to the last 200 trading days) since 1980. The S&P 500 had the 15th largest one day rally since 1980, and the US Dollar Index had its 9th largest daily decline over that same span. Investors have been through a lot over the last several years, but Thursday ranked right up there with all of them, and we’re not even including the ‘you-know-what’ show that’s been going on at Twitter! All we can say is that thankfully the moves in stocks and bonds were up rather than down.
There wasn’t a lot of data this week, but it was still full of fireworks rivaling any grand finale. To read this week’s full Bespoke Report newsletter and access everything else Bespoke’s research platform has to offer, start a two-week trial to one of our three membership levels.

Homebuilders Extended
Every day we browse through our Trend Analyzer tool (available with a Premium or Institutional membership) to monitor trends and overbought/oversold levels across financial markets. When we got to the homebuilder stocks this morning, we had to do a double-take after seeing some of the recent moves in this space. Have a look at the moves in the snapshot below. Most homebuilder stocks have rallied 12-15% over the last five trading days, leaving them in extreme overbought territory, which means they’re more than two standard deviations above their 50-day moving averages. DR Horton (DHI), Lennar (LEN), NVR (NVR), and PulteGroup (PHM) are the most extended. Even after the rally in these names over the last week, we’d note that they’re still all down sharply year-to-date as the spike in mortgage rates from 3% up to 7%+ has caused activity in the space to slow to a crawl. A drop in those mortgage rates over the last few days was the catalyst for the recent move higher in share prices. If you’re wondering which way the homebuilders are likely to trade going forward, keep an eye on interest rates — that’s the entire story these days. Click here to learn more about Bespoke’s premium stock market research service.

Banks and Brokers on Fire
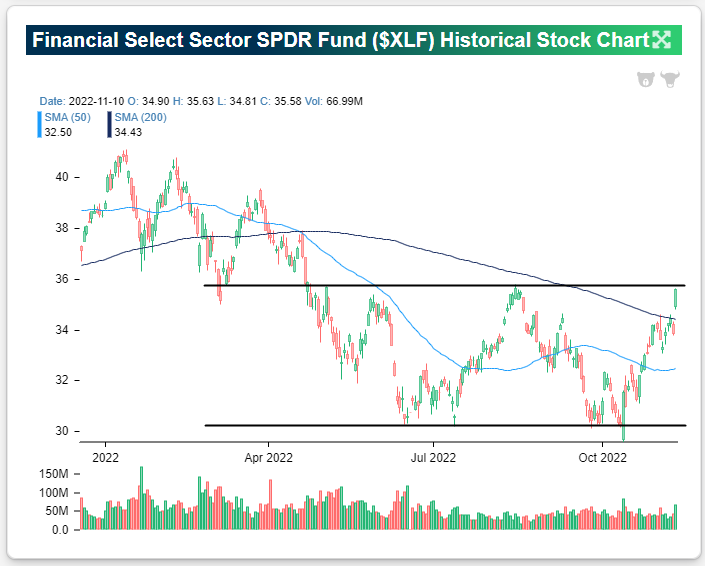
The Financial sector ETF (XLF) has been on fire since its intraday low of $29.59 on October 13th, which was the day of the hotter than expected September CPI report. From that low point on 10/13, XLF is up 20.2%. As shown below, the ETF is currently at the very top end of a wide sideways range that has been in place over the last six months.
Below is a sampling of some of the most well-known banks and brokers that are part of the Financial sector. As shown, names like Goldman Sachs (GS), JP Morgan (JPM), Jefferies (JEF), Raymond James (RJF), and Stifel (SF) are all more than 10% above their 50-DMAs, and the only stock that’s not overbought (>2 standard deviations above 50-DMA) is LPL Financial (LPLA), which traded lower on earnings yesterday.

A quick look at the six-month price charts of the stocks listed in the table above gives you a glimpse into the huge rally that this area of the market has experienced since early October. Investors have seemingly been loading up on them with short-term Treasury yields now significantly higher than the interest rates these banks and brokers are paying customers on deposits. Click here to learn more about Bespoke’s premium stock market research service.

Bespoke’s Morning Lineup – 11/15/22 – Full-Conductors
See what’s driving market performance around the world in today’s Morning Lineup. Bespoke’s Morning Lineup is the best way to start your trading day. Read it now by starting a two-week trial to Bespoke Premium. CLICK HERE to learn more and start your trial.
“Honor to the soldier and sailor everywhere, who bravely bears his country’s cause. Honor, also, to the citizen who cares for his brother in the field and serves, as he best can, the same cause.” – Abraham Lincoln

Below is a snippet of content from today’s Morning Lineup for Bespoke Premium members. Start a two-week trial to Bespoke Premium now to access the full report.
We’re seeing some modestly positive follow-through to yesterday’s ripper in early trading as the bond market is closed for Veterans Day. With banks and the bond market closed, there’s little in the way of earnings news or economic data. The only report on the calendar is the Michigan Confidence report at 10 AM. The key metric to watch in that report will be inflation expectations. Outside of the US, Asian markets rallied sharply in a continuation of Thursday’s rally here in the US, but signs of some loosening in China’s strict zero-Covid policy have also contributed to the positive mood. A reopening of China would likely have some upside inflationary pressure in terms of energy prices, but it would also loosen some supply chains which remain constrained.
There’s been nothing ‘semi’ about the performance of chip stocks over the last week, and some of the gains we have seen in individual stocks have been unbelievable. Just yesterday, the Philadelphia Semiconductor Index (SOX) was up over 10%, and over the last five trading days, the index is up over 16%. With gains like that, you can only imagine how some of the individual components of the SOX have performed, and below we summarize the performance of the 15 largest stocks in the index based on market cap. All 15 of them have experienced double-digit moves and four are up over 20% in the last five trading days. Even Intel (INTC) is up over 10%!
While the short-term gains have been mouth-watering, coming back to reality, all 15 stocks listed below are still down YTD, and most are down sharply. While Texas Instruments (TXN) and Analog Devices (ADI) have managed to get by with declines of less than 10%, more than half of the 15 stocks listed below are still down over 30% YTD. AMD has declined over 50% while NVIDIA (NVDA) and Taiwan Semiconductor (TSM) are both down over 40%. Whether this is the beginning of a new rally or just a bear market rally remains to be seen, but rallies have to start somewhere.

Our Morning Lineup keeps readers on top of earnings data, economic news, global headlines, and market internals. We’re biased (of course!), but we think it’s the best and most helpful pre-market report in existence!
Start a two-week trial to Bespoke Premium to read today’s full Morning Lineup.
The Bespoke 50 Growth Stocks — 11/10/22
The “Bespoke 50” is a basket of noteworthy growth stocks in the Russell 3,000. To make the list, a stock must have strong earnings growth prospects along with an attractive price chart based on Bespoke’s analysis. The Bespoke 50 is updated weekly on Thursday unless otherwise noted. There were five changes to the list this week.
The Bespoke 50 is available with a Bespoke Premium subscription or a Bespoke Institutional subscription. You can learn more about our subscription offerings at our Membership Options page, or simply start a two-week trial at our sign-up page.

The Bespoke 50 performance chart shown does not represent actual investment results. The Bespoke 50 is updated weekly on Thursday. Performance is based on equally weighting each of the 50 stocks (2% each) and is calculated using each stock’s opening price as of Friday morning each week. Entry prices and exit prices used for stocks that are added or removed from the Bespoke 50 are based on Friday’s opening price. Any potential commissions, brokerage fees, or dividends are not included in the Bespoke 50 performance calculation, but the performance shown is net of a hypothetical annual advisory fee of 0.85%. Performance tracking for the Bespoke 50 and the Russell 3,000 total return index begins on March 5th, 2012 when the Bespoke 50 was first published. Past performance is not a guarantee of future results. The Bespoke 50 is meant to be an idea generator for investors and not a recommendation to buy or sell any specific securities. It is not personalized advice because it in no way takes into account an investor’s individual needs. As always, investors should conduct their own research when buying or selling individual securities. Click here to read our full disclosure on hypothetical performance tracking. Bespoke representatives or wealth management clients may have positions in securities discussed or mentioned in its published content.
Sentiment Slumps Ahead of CPI
In spite of the S&P 500’s attempts at moving above its 50-DMA in the past week, bullish sentiment took a hit with only a quarter of responses to the AAII survey reporting as optimistic. That compares to 30.6% last week. Today, equities are roaring higher in reaction to the cooler than expected CPI print. Given the timing of the release and market reaction, the latest readings on investor sentiment can already be considered out of date as collection periods would have missed today’s news. Looking forward, holding constant any other catalysts and price action that may affect sentiment in the week to come, the CPI number and subsequent positive market reaction are likely to support a much more positive reading on sentiment next week.

In the two weeks leading up to now, bearish sentiment had been in free fall, going from 56.2% during the week of October 20th all the way down to 32.9% last week. A little more than half of that decline was recovered this week as bearish sentiment rose all the way back up to 47%.

As a result of those recent moves, the bull bear spread moved much deeper into negative territory. After hitting the highest level of the current near record stretch of negative readings, the spread has fallen back down to -21.9. Click here to learn more about Bespoke’s premium stock market research service.

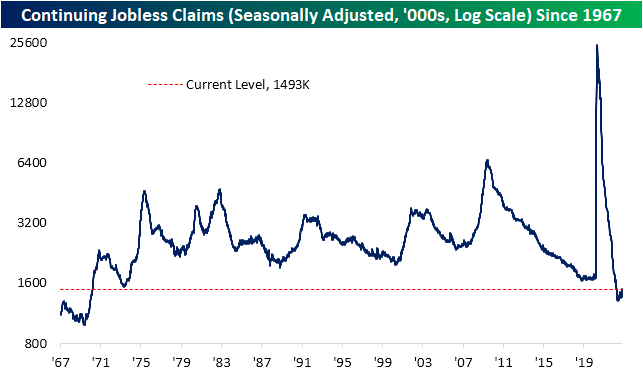
Fourth Week Higher For Continuing Claims
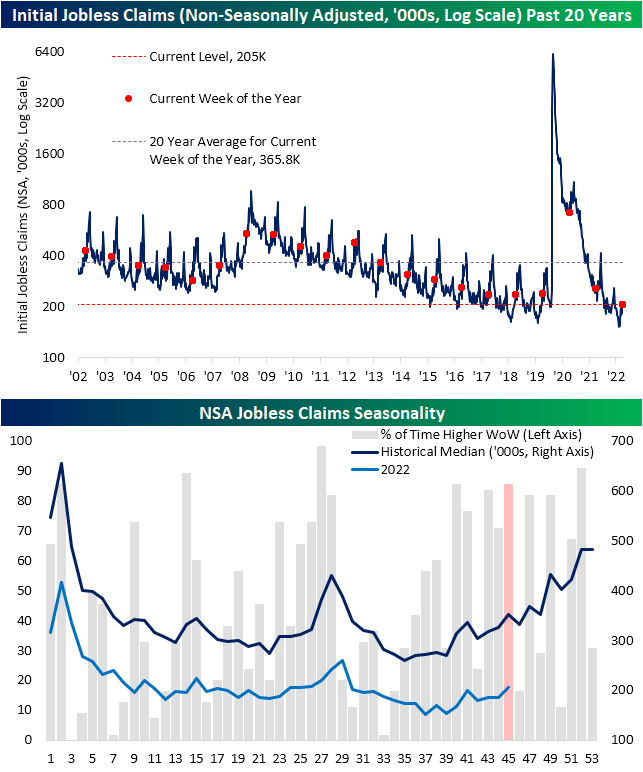
While today’s CPI print took the spotlight of positively received economic data, jobless claims have continued to rise a bit. Seasonally adjusted initial claims rose to 225K from last week’s 1K upwardly revised level of 217K. That is 1K below the early October high for the weakest level of claims since the end of the summer. Given recent readings, claims have been trending slightly higher but remain at historically strong levels.

On a non-seasonally adjusted basis, claims are swinging higher as is normal for this point of the year. In fact, the current week of the year has historically seen claims rise week over week 85% of the time. That ranks fourth as the week of the year most consistently to see claims rise. In spite of that expected increase, at 205K claims are much lower than the comparable week of years past.
Without doubt, initial jobless claims paint a picture of solid health in the labor markets without much in the way of significant deterioration or improvement lately. Continuing claims are similar in sitting well below pre-pandemic levels that are some of the strongest of the past several decades. Unlike initial claims, though, continuing claims have been more consistently climbing in recent weeks. Now at 1.493 million, claims have risen in each of the past four weeks, bringing the reading to the highest level since the end of March. Click here to learn more about Bespoke’s premium stock market research service.
Bespoke’s Morning Lineup – 11/10/22 – No Comeback This Year
See what’s driving market performance around the world in today’s Morning Lineup. Bespoke’s Morning Lineup is the best way to start your trading day. Read it now by starting a two-week trial to Bespoke Premium. CLICK HERE to learn more and start your trial.
“This is the most disappointing loss I have ever been associated with.” – Jimmy Johnson, 11/10/1984
Below is a snippet of content from today’s Morning Lineup for Bespoke Premium members. Start a two-week trial to Bespoke Premium now to access the full report.
You can take the positive futures with a grain of salt this morning as everything is likely to and will change following the 8:30 Eastern release of October CPI. Economists are currently forecasting the headline reading to increase by 0.6% m/m while the core reading is expected to be slightly more subdued at 0.5%. That report will be the main course, but don’t forget about jobless claims. Initial Jobless claims are expected to remain right around last week’s level of 217K. Not much is expected to change with regard to continuing claims either, but if the consensus reading of 1.487 million comes in, it would be the highest reading since April.
The words above could really be attributed to anyone who invested in financial assets of any type this year, but when Jimmy Johnson uttered them on this day in 1984, he was referring to his Miami Hurricanes and their role in one of the biggest blown leads in college football history. Playing Maryland, the Hurricanes took a 31-0 blowout into halftime in what was looking like a laugher. The Hurricanes of the 1980s were brash and known for their attitude, and they were also a team that most people outside of Miami eagerly rooted against.
That trash-talking Miami attitude was on full display back in 1984. As Maryland’s Jess Atkinson described it, “No question about it. Those guys were the biggest cheap-shot, trash-talking, classless outfit of football players I’ve ever seen in my life…You can almost take getting beat if a team is kicking your butts and they’re doing it cleanly. And there was no question that they were kicking our butts in the first half. But that team made us mad, and it gave us a little extra incentive.” Well, the Terps came out determined in the second half and led by QB Frank Reich coming off the bench and throwing six touchdowns, they were able to somehow complete one of the most unfathomable comebacks in college football history.
It’s amazing enough to lead a team to one of the greatest comebacks in college football history, but Reich also managed to find himself on the winning side of one of the greatest comebacks in NFL playoff history nine years later on a freezing January Buffalo afternoon. After trailing the Oilers 35-3 early in the second half, more than a few Bills fans left the cold and damp Rich stadium stands thinking about what could have been and looking ahead to next season. The Bills didn’t give up, though. One of his teammates reminded Reich that he had already been part of the greatest comeback college win, so perhaps he could do it again. Reich then went on to tell the team that they had to take the rest of the second half one play at a time. Using that play-by-play approach, the Bills staged a miraculous comeback as a wave of fans came back from the parking lots and filled the stands again to witness the 41-38 “Comeback” win.
As good a run of luck that Reich had in his football-playing career, his coaching career hasn’t been as lucky. While he had a big turnaround in his first season when the Colts made the playoffs after starting off the season at 1-5, the years since then have been somewhat uneventful. After starting this season with a record of 3-5-1, including a blowout loss to the Patriots last Sunday, Reich was unceremoniously fired by Colts owner Jim Isray.
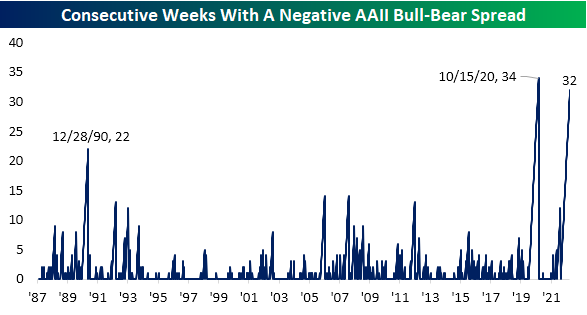
Like the lucky streaks often seen in sports among teams or individual athletes, they all eventually end. 2022 has been a year where the market’s luck looks to have run out, and a Frank Reich comeback isn’t in the cards. Judging by various measures of sentiment, the only question now seems to be how much worse things will get. Even though we’re in what has historically been the best time of year for equities, individual investor sentiment, as measured by the American Association of Individual Investors, has shown a higher percentage of bears than bulls every week this year except one! As shown in the chart below, sentiment this year has been especially negative as there has only been one week where bullish sentiment exceeded bearish sentiment. Prior to 2022, there was no other year since 1987 where fewer than 25% of all weeks had more bulls than bears.
It’s been a terrible year. Everything that has happened, though, is in the past. Rather than looking back on the year and thinking about what could have been, investors always need to be looking forward and thinking of what could be.

Our Morning Lineup keeps readers on top of earnings data, economic news, global headlines, and market internals. We’re biased (of course!), but we think it’s the best and most helpful pre-market report in existence!
Start a two-week trial to Bespoke Premium to read today’s full Morning Lineup.
Haves and Have Nots
As evident in our Sector Snapshots over the past several days and as we discussed yesterday on Twitter, sector performance has lately been a tale of the haves and have-nots. The areas of the market that possess some of the most heavily weighted stocks, namely Communication Services, Consumer Discretionary, and Technology, have drastically underperformed other cyclical sectors like Financials, Industrials, and Materials. As a result, relative strength lines have blown out. Shown another way, in the charts below, we show the ratios of each of these sectors relative to the S&P 500. A rising line would indicate the sector is outperforming the broader market and vice versa.
Communication Services has been in a brutal downtrend in relative strength terms for more than a year now and the recent drop has been steep. While the ratio of Consumer Discretionary to the S&P 500 has been more range bound in recent years, there have been a few wild swings in the past year. The most recent swing lower is leaving it close to the lowest levels since early 2015. Tech’s decline has not been nearly as sharp, but the ratio here has nonetheless rolled over to some of the lowest levels of the past few years. Conversely, Financials, Industrials, and Materials have all seen their ratios rip higher to the upper end of the past few years’ range.

In measuring just how sharp of moves these ratios have experienced, they have been outright historic. As for the most pronounced moves, the drops in the lines of Communication Services and Consumer Discretionary rank in the bottom percentile of all 10-day moves since 1990 when our sector data begins. The only periods in which the ratios fell by similar degrees, if not by more, were during the Dot Com bubble. While Tech’s ratio is at new multi-yea rlows, its decline was large (ranking in the 17th percentile) but not nearly as sharp, standing out much less than the aforementioned sectors.
Like Tech, the moves in Financials and Materials have also been quite large and rank in the top decile of all 10-day moves, but those are far from records. The outperformance of Industrials on the other hand, has been remarkable. As of yesterday’s close, the ratio versus the S&P 500 rose 7.24% over the past two weeks. Only three other days—May 19 through May 21, 2020—since 1990 have seen higher readings. Click here to learn more about Bespoke’s premium stock market research service.
