Bespoke’s Morning Lineup – 11/22/22 – Getting on the Same Page
See what’s driving market performance around the world in today’s Morning Lineup. Bespoke’s Morning Lineup is the best way to start your trading day. Read it now by starting a two-week trial to Bespoke Premium. CLICK HERE to learn more and start your trial.
“The one unchangeable certainty is that nothing is certain or unchangeable.” – John F Kennedy

Below is a snippet of content from today’s Morning Lineup for Bespoke Premium members. Start a two-week trial to Bespoke Premium now to access the full report.
There’s been little in the way of major news this morning. In the retail space, we’ve seen some positive earnings reports from Best Buy (BBY) and Dick’s Sporting goods (DKS), although Dollar Tree (DLTR) and Zoom (ZM) are under pressure following disappointing results relative to expectations. There’s little in the way of economic data on the calendar as the Richmond Fed regional report is the only release scheduled (10 AM), but there are a number of Fed speakers slated to speak, including Cleveland Fed President Mester, KC Fed President George, and St Louis Fed President Bullard. Can’t these people take a break for Thanksgiving?
The story of 2022 has been one where the market has been constantly playing catchup to the Fed’s aggressive pace of monetary tightening. Back in May when the market thought 75 bps was off the table, it quickly had to change course as the Fed went on to hike rates by 75 bps at each of the last four meetings. Periods where the market finds itself playing catch up to a tighter reality aren’t a good setup for equities.
With just over three weeks between now and the next Fed meeting, have investors finally caught up to the Fed? Based on comments from Loretta Mester like “I don’t think we’re anywhere near stopping,” you would think that the market is still behind the Fed, but that may not entirely be the case. Even hawkish officials have publicly stated openness to ratcheting down the pace of rate hikes, and that’s a big change from where we were. Throughout all of August, September, and the first half of October, the market was steadily raising its forecasts for policy rates, and not surprisingly, stocks were under pressure. In mid-October, though, the odds of a 75 bps hike at the December meeting peaked at 77% and have been steadily declining to less than 20% today. It’s no coincidence that during that same stretch, equities have rallied. It sounds pretty obvious, but as long as the market remains on the same page as the Fed or finds itself playing catch up to a less aggressively hawkish policy path, equities should benefit from a tailwind.

Our Morning Lineup keeps readers on top of earnings data, economic news, global headlines, and market internals. We’re biased (of course!), but we think it’s the best and most helpful pre-market report in existence!
Start a two-week trial to Bespoke Premium to read today’s full Morning Lineup.
Thanksgiving Week Performance
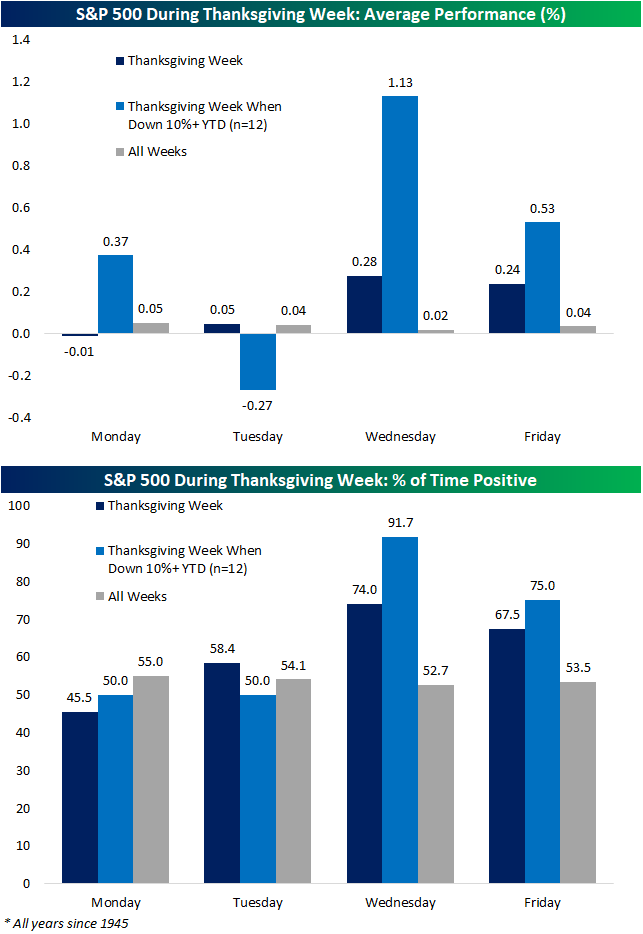
The S&P 500 is starting out the holiday-shortened week lower and compared to other years post-WWII, that is not without precedent as the index has often fallen on the Monday of Thanksgiving week. Historically, on the Monday of Thanksgiving week, the S&P 500 has tended to trade slightly lower with a 1 basis point drop. However, in years like 2022 when the index entered the week down at least 10% year to date (12 years), performance has been more positive with a 37 bps average gain, though returns have only been positive half the time.
Performance on Tuesday of Thanksgiving week has tended to be even more mixed with an average gain of 5 bps across all years and a decline of 27 bps in years when the S&P 500 was down 10% YTD heading into Thanksgiving week.
While performance is mixed on Mondays and Tuesdays of Thanksgiving week, the two days surrounding the holiday have tended to see far stronger returns. As shown below, the average gain for all years on Wednesday has been a 0.28% gain and in years that the index was down double digits year to date, it has posted an even more impressive 1.13% gain on that day with positive performance better than 90% of the time. After coming back with full bellies on Friday, traders have continued to push the index higher again with consistently positive performance, especially in years the index entered the week down significantly year to date.
As for where the index goes from there, the S&P 500 has risen from the close of the Wednesday before Thanksgiving through the end of the year roughly three-quarters of the time with an average gain of 1.93%. When momentum has been dragging the index lower year to date, though, rest of year performance has been less positive. Again looking at years in which the index has fallen at least 10% headed into Thanksgiving week as is the case this year, positive returns through the end of the year have been less common only happening half the time with an average decline of 0.1%. Click here to learn more about Bespoke’s premium stock market research service.

Bespoke’s Morning Lineup – 11/21/22 – Hollywood (and Wall Street) Loves a Sequel
See what’s driving market performance around the world in today’s Morning Lineup. Bespoke’s Morning Lineup is the best way to start your trading day. Read it now by starting a two-week trial to Bespoke Premium. CLICK HERE to learn more and start your trial.
“At its essence, good leadership isn’t about being indispensable; it’s about helping others be prepared to possibly step into your shoes” – Bob Iger
Below is a snippet of content from today’s Morning Lineup for Bespoke Premium members. Start a two-week trial to Bespoke Premium now to access the full report.
Outside of Disney (DIS), it’s been a very quiet morning in US markets. Futures are down, but they’re off their lows. The Nasdaq is leading the declines with a decline of 0.5%, and the economic calendar is quiet with the Chicago Fed National Activity Index the only report on the calendar. One bright spot this morning has been related to the Fed. While most speakers of late have been hawkish, Atlanta Fed President Bostic said he favors smaller rate hikes and a terminal rate of between 4.75% to 5.00%. Unfortunately, he’s not a voter.
Hollywood loves sequels, and investors are hoping for a good one this morning on the news that Bob Iger is returning to Disney (DIS) to replace Bob Chapek. In response, DIS shares have rallied nearly 10% which would be the best day for the stock in nearly two years. Based on the performance of DIS stock under Iger versus Chapek, you can understand the optimism. During the nearly 15-year tenure of Iger, DIS stock rallied more than fivefold for an annualized gain of 13.9% including dividends versus the S&P 500’s annualized total return of 8.8%. Under the less than three-year tenure of Chapek, DIS stock has declined more than 28% for an annualized decline of more than 11.5% versus an annualized gain of 10.8% for the S&P 500. Put another way, it took less than three years for Chapek to undo all of the outperformance that DIS shares racked up under Iger.
It wouldn’t be fair to put all the blame for Disney’s underperformance on Chapek. Iger stepped down just as COVID was arriving on US shores, so he benefitted from good timing. There’s also been massive disruption in the media space, so who knows how a DIS under Iger would have navigated these storms. Chapek was also Iger’s hand-picked successor, and as Iger himself once said, good leadership is about helping others be prepared to possibly step into your shoes. So Chapek’s disappointing tenure doesn’t exactly reflect all that well on Iger.
Whatever the circumstances were under Chapek’s tenure, you can only play the hand your dealt. The numbers are the numbers, and that’s why investors are so excited this morning. Just like Hollywood, Wall Street loves sequels. Let’s just hope for Disney investors, the Iger sequel is a success more of a Godfather II or Top Gun Maverick than a Jaws 2.

Our Morning Lineup keeps readers on top of earnings data, economic news, global headlines, and market internals. We’re biased (of course!), but we think it’s the best and most helpful pre-market report in existence!
Start a two-week trial to Bespoke Premium to read today’s full Morning Lineup.
Bespoke Brunch Reads: 11/20/22
Welcome to Bespoke Brunch Reads — a linkfest of the favorite things we read over the past week. The links are mostly market related, but there are some other interesting subjects covered as well. We hope you enjoy the food for thought as a supplement to the research we provide you during the week.
While you’re here, join Bespoke Premium with a 30-day trial!
Tech Wreck
Masayoshi Son owes SoftBank $4.7bn as side deals go sour (National News/Bloomberg)
The Japanese tech investor borrowed heavily from his own company to invest in hyper-aggressive tech funds he operated. The result is billions of losses from the world’s most optimistic buyer of technology companies. [Link]
Elon Musk Fires Twitter Employees Who Criticized Him by Kate Conger, Ryan Mac and Mike Isaac (NYT)
As the intemperate billionaire seeks to put his stamp on the social networking site, staff are being shown the door for any criticism of the boss, on top of other headcount reductions and mass departures of employees uninterested in ultimatums. [Link; soft paywall]
Battery Industrialization
The Battery Supply Chain Is Finally Coming to America by Tom Randall (Bloomberg)
With booming demand for large scale battery packs and fresh industrial policy creating huge incentives to produce batteries inside the US, domestic manufacturing of batteries is finally starting to scale up with downstream benefits for companies that make components in the US. [Link; soft paywall]
Carmakers switch to direct deals with miners to power electric vehicles by Harry Dempsey and Peter Campbell (FT)
In order to make sure they have sufficient supply, auto manufacturers are setting up joint ventures with battery makers and going straight to mines to buy input materials, a sort of vertical integration that harkens back to an earlier period for the global auto industry. [Link; paywall]
World Cup
World Cup Brings Two Million Visitors and an Epic Culture Clash to Qatar by Rory Jones, Stephen Kalin, and Joshua Robinson (WSJ)
Less than a week before the start of the World Cup, Qatar is proving an unreliable and downright uncomfortable host for the World Cup. [Link; paywall]
Qatar World Cup Faces New Edict: Hide the Beer by Tariq Panja (NYT)
Nothing goes together like the beautiful game and beer, but Qatar World Cup organizers are moving the goal as kickoff approaches in a confusing series of decisions that may keep fans from their brews. [Link; soft paywall]
The FTX Collapse
FTX Chapter 11 First Day Affidavit by Jon Wu (ThreadReader)
A step-by-step walk-through of the Chapter 11 filing offered by FTX as the exchange collapsed. The allegations are nothing short of shocking and reveal staggering malfeasance. [Link]
What happened at Alameda Research (milky eggs)
A detailed discussion of the collapse of Alameda Research, the FTX affiliate that was the alleged recipient of funding that blew a massive hole in the balance sheet of the exchange. [Link]
Let crypto burn by Stephen Cecchetti and Kim Schoenholtz (FTAV)
We don’t necessarily subscribe to this argument, but a thought-provoking call for regulators to let the crypto ecosystem collapse under its own weight and not offer any of the stability or legitimacy that comes from regulation. [Link; registration required]
Innovation
Stagnant Scientific Productivity Holding Back Growth by Greg Ip (WSJ)
The US spends a record share of GDP on research and development, but the long-term benefits of big investment in speculative technology or ideas has been illusory so far. [Link; paywall]
Your Phone Can Determine If a Bridge Is Busted by Matt Simon (Wired)
Phones inside the cars of drivers on the Golden Gate Bridge were used to identify and monitor the “modal frequency” of the bridge, providing a potential source of early warning for bridge collapses. [Link]
Wall Street Weakness
Wall Street Bonuses to Plunge as Much as 45% for Bankers – Study (US News/Reuters)
Crashing deal volumes after a massive run in 2020 and 2021 are going to lead to a famine for deal-driven bonuses at Wall Street investment banks. [Link]
Office Space
EY Future Workplace Index reveals surprisingly rosy attitudes on commercial real estate investment despite economic tightening (PRNewswire)
While the economy appears to be slowing and office demand doesn’t look spectacular, this new survey data shows surprisingly robust demand for office space and real estate more generally. [Link]
How We Spend It
6 Graphs Everyone Needs To See by Sahil Bloom (ThreadReader)
Time spent with friends and family eventually shifts towards time spent with children and coworkers. By the end of life, Americans are spending more than half of their waking hours alone. [Link]
Read Bespoke’s most actionable market research by joining Bespoke Premium today! Get started here.
Have a great weekend!
The Bespoke Report – 11/18/22 – Trends Intact
This week’s Bespoke Report newsletter is now available for members.
US equity markets pulled back and made a lower high despite cooing doves this week from the Federal Reserve and a plunging dollar. US yield curves inverted further as markets tempered their optimism on China. Earnings season has finally wound up with better-than-expected results, despite a sudden slowdown in guidance which has flipped decisively negative after two years of remarkable optimism from corporate America. Economic data this week was high volume and covered housing, consumer spending, manufacturing, and more. We discuss in detail as well as taking a look at what tech layoffs say about the broader labor market, how consumer discretionary stocks have traded into Thanksgiving, the signals being sent by the US yield curve and fixed income markets more broadly, and runoff in liquidity as the Fed removes reserves from the system as well as raising rates. We cover all that and much more in this week’s Bespoke Report.
To read this week’s full Bespoke Report newsletter and access everything else Bespoke’s research platform has to offer, start a two-week trial to one of our three membership levels.


Q3 Earnings Season Conference Call Recaps
Bespoke’s Conference Call Recaps provide helpful summaries of corporate conference calls throughout earnings season. We go through the conference calls of some of the most important companies in the market and summarize key topics covered by management. These recaps include information regarding each company’s financial results, growth by segment, as well as some aspects of the business that management expects to impact future results. We also identify trends emerging for the broader economy in these recaps.
Bespoke’s Conference Call Recaps are available at the Bespoke Institutional level only. You can sign up for Bespoke Institutional now and receive a 14-day trial to read our newest Conference Call recaps. To sign up, choose either the monthly or annual checkout link below:
Bespoke Institutional – Monthly Payment Plan
Bespoke Institutional – Annual Payment Plan
Below is a list of the Conference Call Recaps published during the Q3 2022 and Q2 2022 earnings reporting period.
Q3 2022 Recaps:
NVIDIA Q3 2023

Walmart Q3 2023

Target Q3 2022

Disney Q4 2022

Zoetis Q3 2022

Generac Q3 2022

Uber Q3 2022

XPO Logistics Q3 2022

Apple Q4 2022

Amazon Q3 2022
Ford Q3 2022

Alphabet Q3 2022

Microsoft Q1 2023

Tesla Q3 2022

Netflix Q3 2022

Johnson & Johnson Q3 2022

UnitedHealth Q3 2022

JP Morgan Q3 2022

PepsiCo Q3 2022

Constellation Brands Q2 2023

Nike Q1 2023

Costco Q4 2022

Lennar Q3 2022
Adobe Q3 2022

Oracle — Q1 2023

DocuSign — Q2 2023

Lululemon — Q2 2022

Recaps published during Q2 2022 are available with a Bespoke Institutional subscription:
Deere Q3 Conference Call — 8/19/22
Cisco Q4 Conference Call — 8/18/22
Target Q2 Conference Call — 8/17/22
Home Depot Q2 Conference Call — 8/16/22
Walmart Q2 Conference Call — 8/16/22
Disney Q3 Conference Call — 8/10/22
The Trade Desk Q2 Conference Call — 8/10/22
Coinbase Q2 Conference Call — 8/9/22
Tyson Foods Q3 Conference Call — 8/8/22
Alibaba Q1 Conference Call — 8/4/22
PayPal Q2 Conference Call — 8/4/22
Starbucks Q3 Conference Call — 8/4/22
Advanced Micro Devices Q2 Conference Call — 8/4/22
Caterpillar Q2 Conference Call — 8/2/22
Uber Q2 Conference Call — 8/2/22
Builders FirstSource Q2 Conference Call — 8/1/22
Apple Q3 Conference Call — 7/28/22
Amazon Q2 Conference Call — 7/28/22
Ford Q2 Conference Call — 7/27/22
Meta Platforms Q2 Conference Call — 7/27/22
Automatic Data Processing Q4 Conference Call — 7/27/22
Alphabet Q2 Conference Call — 7/26/22
Microsoft Q4 Conference Call — 7/26/22
3M Q2 Conference Call — 7/26/22
McDonald’s Q2 Conference Call — 7/26/22
Whirlpool Q2 Conference Call — 7/25/22
PPG Industries Q2 Conference Call — 7/22/22
American Express Q2 Conference Call — 7/22/22
Freeport-McMoRan Q2 Conference Call — 7/21/22
Blackstone Q2 Conference Call — 7/21/22
Tesla Q2 Conference Call — 7/20/22
Baker Hughes Q2 Conference Call — 7/20/22
Netflix Q2 Conference Call — 7/19/22
Johnson & Johnson Q2 Conference Call — 7/19/22
International Business Machines Q2 Conference Call — 7/18/22
Goldman Sachs Q2 Conference Call — 7/18/22
Citigroup Q2 Conference Call — 7/15/22
Blackrock Q2 Conference Call — 7/15/22
JP Morgan Q2 Conference Call — 7/14/22
Taiwan Semiconductor Q2 Conference Call — 7/14/22
Delta Q2 Conference Call — 7/13/22
PepsiCo Q2 Conference Call — 7/12/22
Constellation Brands Q1 Conference Call — 6/30/22
Walgreens Q3 Conference Call — 6/30/22
Nike Q4 Conference Call — 6/27/22
CarMax Q1 Conference Call — 6/24/22
FedEx Q4 Conference Call — 6/23/22
KB Home Q2 Conference Call — 6/22/22
Adobe Q2 Conference Call — 6/16/22
Kroger Q1 Conference Call — 6/16/22
Oracle Q4 Conference Call — 6/13/22
Lululemon Q1 Conference Call — 6/2/22
Chinese Stocks Up But Still Out
It has been quite the week for Chinese stocks as stimulus and optimism over the easing of COVID restrictions has investors and traders buying up stocks leveraged to China. The Kraneshares China Internet ETF (KWEB) was up over 11% heading into today which was the best week for the ETF…in two weeks! If the gains for KWEB heading into today hold up through the end of the session, the four best weeks in KWEB’s history dating back to 2013 will have all occurred this year!
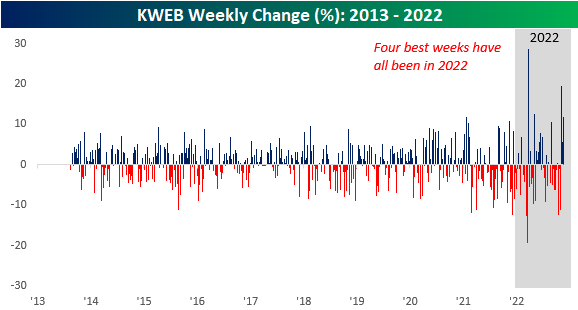
In addition to having two separate weekly gains of over 10% in November, KWEB is also on pace for its third straight weekly gain of 5% or more. In the ETF’s nearly 10-year history, there has never been another streak of three weeks where the ETF has rallied 5% or more. It’s also interesting to note that three of the ETF’s five streaks of two or more weeks in a row have all come since the ETF peaked in February 2021.
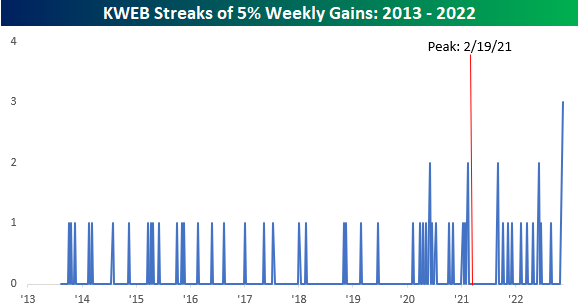
An old maxim of markets is that big upside moves usually happen in bear markets, and the action in KWEB this year is a textbook example. Despite the ETF having its four best weeks on record this year, and two separate streaks where the ETF was up 5% or more in at least two consecutive weeks, KWEB is still down over 25% YTD and is more than 70% from its high less than two years ago. Click here to learn more about Bespoke’s premium stock market research service.

Bespoke’s Morning Lineup – 11/18/22 – Waiting for the Fat Pitch
See what’s driving market performance around the world in today’s Morning Lineup. Bespoke’s Morning Lineup is the best way to start your trading day. Read it now by starting a two-week trial to Bespoke Premium. CLICK HERE to learn more and start your trial.
“I became a good pitcher when I stopped trying to make them miss the ball and started trying to make them hit it.” – Sandy Koufax
Below is a snippet of content from today’s Morning Lineup for Bespoke Premium members. Start a two-week trial to Bespoke Premium now to access the full report.
We made it! We’re not sure about you, but following rumors that Twitter was going to break overnight, we slept soundly. But that’s just us. We’re sure that there are more than a few people out there who as much as they say they hate it, couldn’t imagine a life without their beloved little blue bird. OK. Maybe we sometimes find ourselves in that camp too. Depending on where you stand on social media or these days, your opinion of Elon Musk, fortunately or unfortunately, Twitter is still chipping this morning.
Twitter’s survival is just as good a reason as any to attribute as the catalyst for this morning’s rally in futures, but lower oil prices aren’t hurting matters. We did find it interesting, though, that just as yesterday, futures were positive heading into the European open and steadily lost steam, today has been an exact mirror image. For the rest of the day, the only economic reports on the calendar are Existing Home Sales and Leading Indicators at 10 AM.
It’s been a relatively strange week in terms of index and sector performance as returns have been all over the place. At the index level, all the major index ETFs are above their 50-DMAs, but the S&P 500 (SPY) and Dow (DIA) are both overbought while the Nasdaq 100 (QQQ) and Russell 2000 (IWM) are in neutral territory. The Russell is pulling back from more overbought levels last week with a decline of more than 1.5%, but the Nasdaq 100 gained ground as it’s the only one of the four index ETFs that is up in the five-day period ending yesterday.

While the Nasdaq 100 has been the top-performing index ETF, Technology (XLK) isn’t the top-performing sector. With a gain of 0.79% over the last week, it is underperforming both Communication Services (XLC) and Energy (XLE) by more than a full percentage point. On the downside, five sectors are down a full percentage point in the last five trading days with Real Estate (XLRE) and Utilities (XLU) leading the way lower with declines of more than 2%. The only two sectors below their 50-DMAs are Consumer Discretionary (XLY) and Utilities (XLU) while Energy, Industrials (XLI), and Materials (XLB) are the most extended relative to their 50-DMAs at 8.75% or more above that level. Communications Services and Utilities, meanwhile, are right in the zone and both within 1% of their 50-DMAs.

Our Morning Lineup keeps readers on top of earnings data, economic news, global headlines, and market internals. We’re biased (of course!), but we think it’s the best and most helpful pre-market report in existence!
Start a two-week trial to Bespoke Premium to read today’s full Morning Lineup.
The Bespoke 50 Growth Stocks — 11/17/22
The “Bespoke 50” is a basket of noteworthy growth stocks in the Russell 3,000. To make the list, a stock must have strong earnings growth prospects along with an attractive price chart based on Bespoke’s analysis. The Bespoke 50 is updated weekly on Thursday unless otherwise noted. There were no changes to the list this week.
The Bespoke 50 is available with a Bespoke Premium subscription or a Bespoke Institutional subscription. You can learn more about our subscription offerings at our Membership Options page, or simply start a two-week trial at our sign-up page.
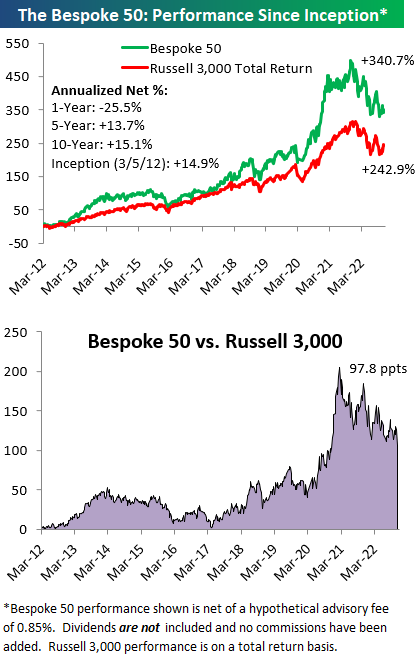
The Bespoke 50 performance chart shown does not represent actual investment results. The Bespoke 50 is updated weekly on Thursday. Performance is based on equally weighting each of the 50 stocks (2% each) and is calculated using each stock’s opening price as of Friday morning each week. Entry prices and exit prices used for stocks that are added or removed from the Bespoke 50 are based on Friday’s opening price. Any potential commissions, brokerage fees, or dividends are not included in the Bespoke 50 performance calculation, but the performance shown is net of a hypothetical annual advisory fee of 0.85%. Performance tracking for the Bespoke 50 and the Russell 3,000 total return index begins on March 5th, 2012 when the Bespoke 50 was first published. Past performance is not a guarantee of future results. The Bespoke 50 is meant to be an idea generator for investors and not a recommendation to buy or sell any specific securities. It is not personalized advice because it in no way takes into account an investor’s individual needs. As always, investors should conduct their own research when buying or selling individual securities. Click here to read our full disclosure on hypothetical performance tracking. Bespoke representatives or wealth management clients may have positions in securities discussed or mentioned in its published content.
Highest Bullish Sentiment of the Year
As we noted last week, this week’s sentiment data is the first to encapsulate any reaction to last week’s CPI number as well as the subsequent market rally. Although price action has been somewhat choppy and there have been plenty of other catalysts (FTX’s collapse, more yield curve inversions, the missile strike in Poland) to balance out the inflation data and put investors back onto their heels, the latest AAII survey has shown a surge in bullish sentiment. The percentage of respondents reporting as optimistic jumped from 25.1% last week up to 33.5% this week. That is not only the largest one-week increase since the first week of June (when bulls rose by 12.2 percentage points) but is now the highest reading on bulls since the last week of 2021.

Bearish sentiment in turn dropped sharply falling to 40.2% for a decline of 6.8 percentage points. While an improvement, at the start of the month bearish sentiment had fallen by much more (both the last week of October and the first week of November saw double-digit week-over-week declines) and was at a much lower level of 32.9%.

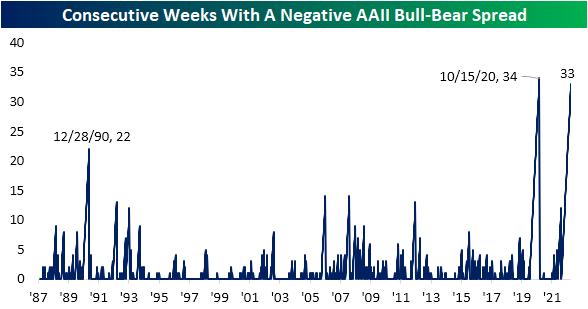
The bull-bear spread has narrowed but still remains negative for the 33rd week in a row. If the spread remains negative into next week, it will tie the record streak from 2020.
 \
\
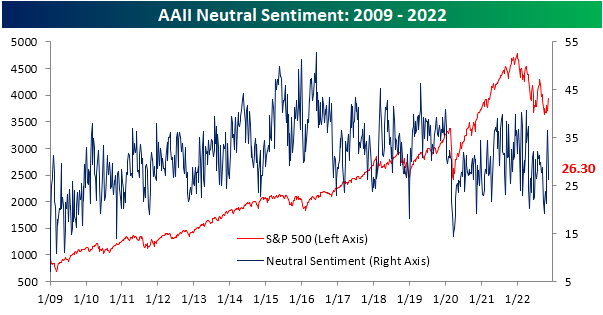
Neutral sentiment fell for a second week in a row with the total decline in that time eclipsing 10 percentage points. At 26.3%, it is down to the lowest level since the week of October 20th, implying that investors have become a bit more decisive in their respective market views.
The AAII survey’s more bullish turn this week was also seen in other readings on sentiment like the Investors Intelligence survey and the NAAIM Exposure Index. As a result, our sentiment composite which aggregates the findings of the three surveys into a single sentiment reading is back up to its highest reading since mid-August. Although the reading remains negative, it is no longer at the extreme levels that were common earlier this year. Click here to learn more about Bespoke’s premium stock market research service.
