The Closer – Surging Copper, Soaring Franc – 1/11/23
Log-in here if you’re a member with access to the Closer.
Looking for deeper insight into markets? In tonight’s Closer sent to Bespoke Institutional clients, we begin with a look at the surge in copper over the past week and what that has done for the Chilean Peso. We also check in on credit spreads and auto lending (page 1). We then pivot over to a look at the Euro and European stocks (page 2). Next, we dive into the BLS data of expenditure and income data for 2021 (page 3) followed by a recap of the strong 10 year reopening (page 4) and massive crude oil inventory build (page 5).
See today’s full post-market Closer and everything else Bespoke publishes by starting a 14-day trial to Bespoke Institutional today!
Bespoke’s Morning Lineup – 1/11/23 – Zigging and Zagging
See what’s driving market performance around the world in today’s Morning Lineup. Bespoke’s Morning Lineup is the best way to start your trading day. Read it now by starting a two-week trial to Bespoke Premium. CLICK HERE to learn more and start your trial.
“It is easy to quit; I’ve done it at least a hundred times.” – Unknown

Below is a snippet of content from today’s Morning Lineup for Bespoke Premium members. Start a two-week trial to Bespoke Premium now to access the full report.
Flights across the US are grounded due to an outage at the FAA, but stocks remain airborne as futures are modestly higher across the board, and the Nasdaq is looking to extend its winning streak to four straight days. News flow looks to be relatively light as there are no major economic reports on the calendar, and the only earnings report is KB Home (KBH) after the bell. Tomorrow will be the big day of the week, though, when the December CPI will be released at 8:30. Then, on Friday we’ll start to get the first of the big earnings reports from the major banks.
Back on this day in 1964, the US Surgeon General issued a report on smoking that was thought to be so damaging to the tobacco industry that he waited until a Saturday when markets were closed to release it to limit the potential stock market chaos. The day after the report was released it was front page top of the fold news in the New York Times with a headline reading “Cigarettes Peril Health” and the sub-headlines “Cancer Link Cited” and “Smoking Is Also Found Important Cause of Bronchitis”. Besides the front-page headlines, the Sunday edition was rife with stories on the ‘revelation’ that smoking wasn’t good for you.
As much as the tobacco companies tried for decades to convince consumers otherwise, anyone with a minimal amount of intelligence who had ever smoked a cigarette probably already knew that it wasn’t something you did in order to get yourself into shape or good health. As far back as the 1940s, scientists had already made the link between smoking and lung cancer. Smoking was considered a vice for a reason! Even as many (or most) Americans already knew of the dangers of smoking, an official statement from the Federal government was a big deal, though, and would pave the way for more regulation of the sector. If you owned tobacco stocks heading into that weekend, you probably weren’t looking forward to Monday’s opening bell.
When the bell rang Monday morning, tobacco stocks opened lower, but by the end of the trading day, their performance was a surprise to most. Of the five major tobacco companies at the time, Reynolds American actually finished the day higher, and American Tobacco was unchanged on the day. Of the remaining three major tobacco stocks, none of them even finished the day down 2%. Perhaps the most amusing aspect of the New York Times market recap the following morning was that cigar stocks traded higher on the day as “cigar smoking received a relatively clean bill of health”. It looks like at least one part of the industry had effective lobbyists!
The performance of the cigarette stocks on the first trading day after the Federal Government first officially recognized the dangers of smoking illustrates once again how the market can defy consensus expectations. While the Surgeon General’s report on the dangers of smoking should have been a blow to cigarette stocks, the initial reaction to the report was muted. When everyone is zigging, the market often zags.

Our Morning Lineup keeps readers on top of earnings data, economic news, global headlines, and market internals. We’re biased (of course!), but we think it’s the best and most helpful pre-market report in existence!
Start a two-week trial to Bespoke Premium to read today’s full Morning Lineup.
The Closer – Air Out of Gas, Fed Shifts, Inflation That Matters, 3y Auction – 1/10/23
Log-in here if you’re a member with access to the Closer.
Looking for deeper insight into markets? In tonight’s Closer sent to Bespoke Institutional clients, we begin with a look at the fresh 52 week lows for natural gas and the implications for the Energy sector (page 1). We then provide an update of Fespeak’s recent tones (page 2). Afterward, we review the Fed’s preferred measure of inflation ahead of Thursday’s CPI print (page 3). We close out with a recap of today’s record setting 3 year note auction (page 4).

See today’s full post-market Closer and everything else Bespoke publishes by starting a 14-day trial to Bespoke Institutional today!
Higher Rates Wards Off Small Business Expansion
The National Federation of Small Businesses (NFIB) released its Small Business Optimism Index for December early this morning. The report showed optimism has begun to fade after a modest rebound in the past few months. The index fell back below 90.0 to the lowest level since the June of 89.5.
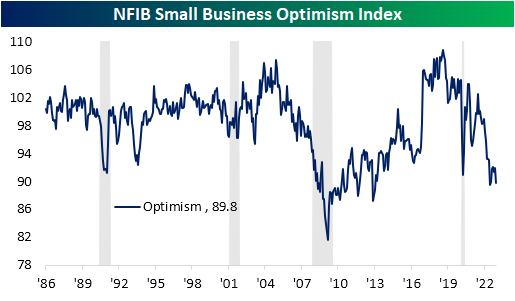
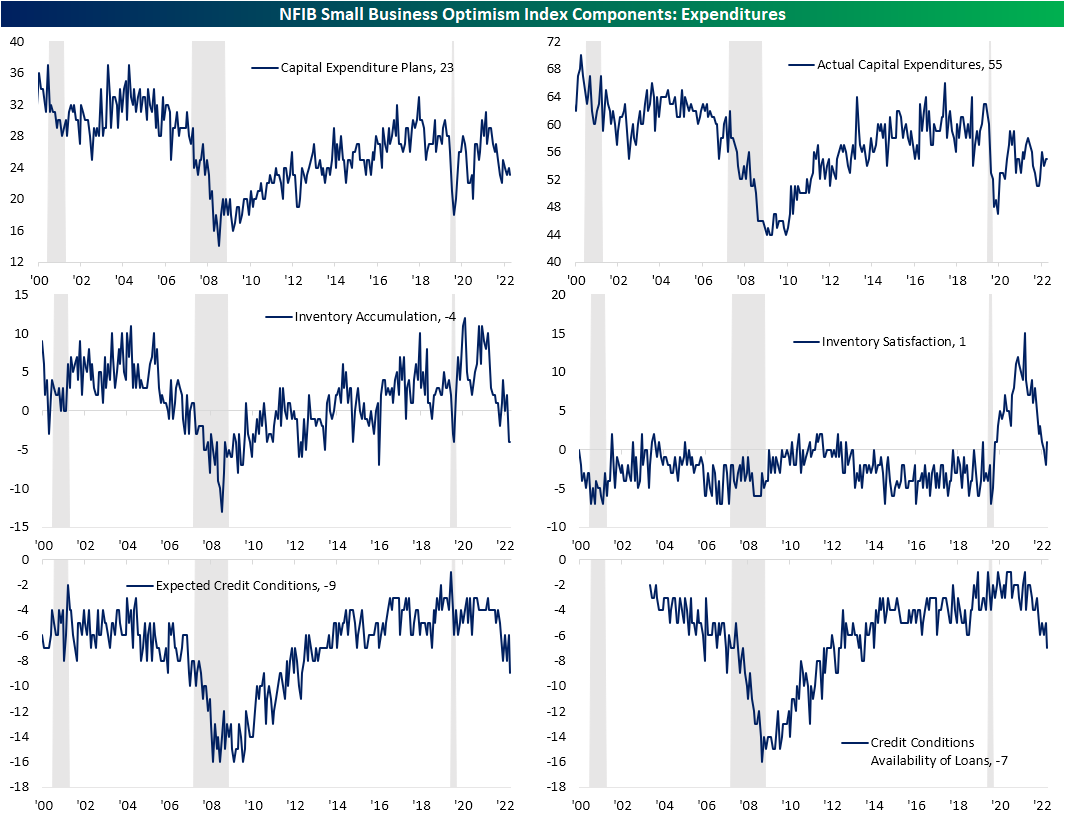
The 2.1-point drop in the index was also the largest m/m decline since June ranking in the bottom 12% of all m/m moves on record. Given that lower reading, the December print is also now back below the spring 2020 lows putting it in the bottom decile of its historical range. Breadth within the report was abysmal with only one input to the headline index (current inventory) moving higher m/m while plans to increase inventories was the only input unchanged. The rest of the categories experienced significant declines, some of which rank in the bottom few percentiles of all monthly moves.

As we noted in today’s Morning Lineup, employment metrics were not a bright spot. Overall, labor market conditions continue to roll over. Hiring plans hit the lowest level since January 2021, and the percentage reporting job openings are hard to fill likewise dropped to the lowest levels since the start of 2021. On the bright side, compensation recovered from the November decline while firms also reported adding workers on a net basis.

The economic outlook remains historically depressed with that index falling 8 points to -51. Although that still has 10 points further to fall to reach the June low, this index continues to hover well outside of historical norms. Given the lack of optimism, a net of only 5% of businesses report now as a good time to expand. Additionally, a higher percentage of businesses are also reporting weaker sales and expectations for weaker sales while observed earnings also continue to worsen in spite of the rollover in prices.

As for a breakdown of the reasons small businesses are reporting now as a good time/not a good time to expand, economic conditions are the main reason given for pessimism. Of those responding now is not a good time to expand, 42% blamed economic conditions while the second highest share (9%) blamed the political climate. The joint next most common reason blamed for pessimism was interest rates and the cost of expansion. For the former, that is the highest reading since at least the start of the pandemic while the latter is the highest reading since July 2021. That high reading in cost of expansion is somewhat surprising given the drop in the higher prices index, however, that could suggest that costs of financing are lumped in with the “cost of expansion” category.

We would also note that the stress of higher rates is also beginning to show up elsewhere in the report. While capital expenditure plans and actual changes to capital expenditures have not seen any major shifts, expected credit conditions fell to the lowest level in nearly a decade. Meanwhile, the availability of loans reached the worst level since September 2014. Click here to learn more about Bespoke’s premium stock market research service.
Bespoke’s Morning Lineup – 1/10/23 – As Goes the First Week…
See what’s driving market performance around the world in today’s Morning Lineup. Bespoke’s Morning Lineup is the best way to start your trading day. Read it now by starting a two-week trial to Bespoke Premium. CLICK HERE to learn more and start your trial.
“Instinct is a marvelous thing. It can neither be explained nor ignored.” – Agatha Christie
Below is a snippet of content from today’s Morning Lineup for Bespoke Premium members. Start a two-week trial to Bespoke Premium now to access the full report.
After a good first week of the year for stocks, futures are in a bit of a retreat this morning, and a key reason for the caution is that Fed Chair Powell will be speaking on Central Bank Independence at 9 AM eastern. Given his recent penchant to crush the market, no one really wants to make a big stand ahead of that speech. Along with lower equity prices, bond yields are higher while crude oil is up marginally even as natural gas pulls back.
In terms of economic data, NFIB Small Business Sentiment came in weaker than expected and fell back down near its lowest levels in a decade. The only other report on the calendar today is Wholesale Inventories at 10 AM.
By nature, people put a lot of weight on first impressions, and that’s especially true in the stock market. If the year starts out on a positive note, it is thought to set a positive tone for the rest of the year and vice versa. With the new trading year fully one week old, below we take a look at how the S&P 500 has performed in the first week of this year compared to all other years since 1953 when the five-day trading week started. The S&P 500’s first week gain of 1.37% this year is definitely an improvement over last year’s decline of 1.87%, and it’s also more than double the 0.58% median gain dating back to 1953. But does it mean anything?

The scatter chart below shows the S&P 500’s performance in the first five trading days of the week versus the rest of the year, and the shaded area indicates all periods where the S&P 500 rallied more than 1% in the first five trading days. Since 1953, there have been 27 other years where the S&P 500 gained 1%+ in the first five trading days, and of those years, the S&P 500’s median rest of year performance was a gain of 13.9% with positive returns 79% of the time. For all other years, the S&P 500’s median rest-of-year return was a gain of 5.6% with gains 59% of the time. Maybe first impressions really do matter.

Our Morning Lineup keeps readers on top of earnings data, economic news, global headlines, and market internals. We’re biased (of course!), but we think it’s the best and most helpful pre-market report in existence!
Start a two-week trial to Bespoke Premium to read today’s full Morning Lineup.
European Markets Stage Comeback
While the S&P 500 remains down 18% from its all-time highs, we’ve seen some positive developments in major European markets over the last few months. As shown below, investors in Germany have recently seen the DAX enter a new bull market with a 23.7% gain off the recent lows. In local currency, the DAX is now just 8.9% below its 1/5/22 high.

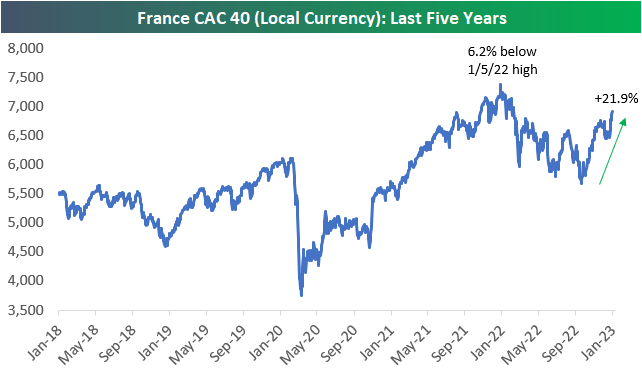
In France, the CAC 40 has also entered a new bull market with a 21.9% gain off the lows, leaving the index just 6.2% below its 1/5/22 high.
Finally, just today in the UK, the FTSE 100 traded to a four-year high after gaining 13.1% off its late 2022 low. From a technical perspective, this clearing above resistance that formed from four major highs going back to 2019 is quite notable. Within US equities, one of the main questions investors face is whether the October lows will hold in 2023, but in Europe, investors are shifting their focus and asking if 2023 will be a year of new highs. Click here to learn more about Bespoke’s premium stock market research service.

Short-Term Treasury Yields Provide the Tell
The yields on short-term Treasuries have been offering up some important tells recently. Below we highlight the yields on 6-month, 12-month, and 2-year Treasuries over the last 12 months. After trading with a positively sloped curve (the longer the duration, the higher the yield) through the first half of 2022, the yields on all three began to converge in late July/early August. In November, the 2-year yield started to drift lower, while yields on the 6-month and 12-month held firm. And just in the last week or so, we’ve seen the yield on the 12-month start to drift lower as well, while the yield on the 6-month has ticked slightly higher. As things stand now, the 2-year yield is at 4.18%, the 12-month is at 4.66%, and the 6-month is at 4.82%. This means the 2-year is inverted with the 6-month by 64 basis points, while the 12-month is now inverted with the 6-month by 16 basis points.
Yields on these three Treasuries are telling investors (and the Fed) where “the market” expects the Fed Funds Rate to be over the duration of the maturities. Right now the market expects rates to peak at some point in mid-2023 before ultimately pulling back. The fact that no points on the Treasury curve are currently above 5% tells you what the market thinks about the Fed’s unanimous support of getting the Fed Funds Rate above 5% and holding it there. It’s not buying it. While “the market” sees inflationary indicators falling pretty much everywhere it looks, Fedspeak has so far been unwilling to acknowledge any meaningful progress. The more inverted we see longer duration yields become with the 6-month T-Bill, the more damage the hawkish Fedspeak will become. Click here to learn more about Bespoke’s premium stock market research service.


Bespoke’s Morning Lineup – 1/9/23 – Follow Through
See what’s driving market performance around the world in today’s Morning Lineup. Bespoke’s Morning Lineup is the best way to start your trading day. Read it now by starting a two-week trial to Bespoke Premium. CLICK HERE to learn more and start your trial.
“The finest steel has to go through the hottest fire.” – Richard Nixon
Below is a snippet of content from today’s Morning Lineup for Bespoke Premium members. Start a two-week trial to Bespoke Premium now to access the full report.
It’s a merger Monday to start the week with three relatively small deals by today’s standards. In the biotech space, CinCor (CINC) will be acquired by AstraZeneca (AZN) in a deal that could be valued at up to $1.8 billion while Albireo (ALBO) will be acquired by Ipsen for just under $1 billion. Both of those stocks are trading up 90% or more in the pre-market. Outside of biotech, software company Duck Creek Technologies will be acquired by Vista Equity Partners for $19 per share in cash ($2.6 billion). While the deal represents a 46% premium to Friday’s closing price, it’s worth noting that DCT traded for just under $60 per share in early 2021. So, the price of the deal is still less than a third of where it once traded during the height of the mania in software stocks.
Along with the deal activity, futures are seeing some follow-through from Friday’s big rally, and growth stocks are leading the move higher with Nasdaq futures trading up just over 0.5%. Some of the reasons for optimism this morning include reports that China has removed all of its border restrictions and that the saga to elect a Speaker of the House is finally behind us. Yields are slightly higher on the long end of the curve, and it’s a quiet day on the economic calendar.
Friday’s rally for the bulls was a nice respite from what had been some disappointing sessions. On the positive side, it was nice to see the S&P 500 finally break out of what had been a nearly two-week very tight trading range- and not break out of that range to the downside! For all the optimism about the rally, it’s still important to note that the S&P 500 wasn’t even able to close out the week above its 50-day moving average (DMA). Late in the day Friday, it attempted to take out that level but pulled back modestly into the close after briefly touching it.

Our Morning Lineup keeps readers on top of earnings data, economic news, global headlines, and market internals. We’re biased (of course!), but we think it’s the best and most helpful pre-market report in existence!
Start a two-week trial to Bespoke Premium to read today’s full Morning Lineup.
Bespoke Brunch Reads: 1/8/23
Welcome to Bespoke Brunch Reads — a linkfest of the favorite things we read over the past week. The links are mostly market related, but there are some other interesting subjects covered as well. We hope you enjoy the food for thought as a supplement to the research we provide you during the week.
While you’re here, join Bespoke Premium with a 30-day trial!
State & Local
The Circus Came to Town—and Bought the Place by Kirsten Grind (WSJ)
A company that operates lewd performances on the Las Vegas strip has bought an entire town on the edge of the Mojave desert. Plans for the purchase remain foggy at best. [Link; paywall]
U-Haul Growth States of 2022: Texas, Florida Top List Again (U-Haul)
Trucks and trailers in the U-Haul rental fleet are flowing out of California, Illinois, and New York while Texas, Florida, the Carolinas, and the broader Sunbelt receive the lion’s share of flows. [Link]
Scams
Twitch Streamer and NFT Founder DNP3 Admits to Gambling Away Investor Funds by Rosie Perper (Coindesk)
A personality who made his name on Twitch and launched several crypto projects has admitted to literally gambling away customer funds. [Link]
The Lottery Lawyer Won Their Trust, Then Lost Their Mega Millions by Simon van Zuylen-Wood (Bloomberg)
The rise and fall of a Long Island lawyer with an impressively specific practice: catering to the legal needs of lottery winners. [Link; soft paywall]
Retail
Walgreens executive says ‘maybe we cried too much last year’ about theft by Gabrielle Fonrouge (CNBC)
The CFO of Walgreens cited a significant drop in the “shrinkage” rate of lost inventory after a failed effort at hiring security guards and an admission that management may have “cried too much last year”. [Link]
Labor Markets
FTC Proposes Rule to Ban Noncompete Clauses, Which Hurt Workers and Harm Competition (FTC)
The Biden Administration has proposed a new rule that would ban noncompete agreements. The agreements have already been restricted by numerous states and in specific instances through federal regulation. [Link]
Bond Markets
Global negative-yielding debt wiped out by Japan policy shift by Tommy Stubbington (FT)
Rate hikes, guidance changes, and a global bond market selloff have driven the stock of negative yielding debt from a December 2020 peak of more than $18trn to nothing. [Link; paywall]
Supply Chains
Dell looks to phase out ‘made in China’ chips by 2024 by Cheng Ting-Fang (Nikkei Asia)
In an effort to prevent geopolitics from disrupting the flow of chips into PCs, Dell is getting rid of Chinese suppliers for chips entirely. [Link; soft paywall]
Monetary Policy
Why We Missed On Inflation, and Implications for Monetary Policy Going Forward by Neel Kashkari (Federal Reserve Bank of Minneapolis)
Kashkari makes the argument that bad forecasting was driven by an under-estimate of how significant shocks can be for inflation. [Link]
EVs
The Secret That Explains the Price of the Cheapest Tesla by Tom Randall (Bloomberg)
Unlike traditional auto OEMs, Tesla regularly changes prices for its various models depending on demand and costs. This article discusses why. [Link; soft paywall]
Sports
Pickleball popularity exploded last year, with more than 36 million playing the sport by Jessica Golden (CNBC)
Enthusiasm is building for the cheap, accessible, and low impact sport of pickleball, which is gaining fans and players at an unprecedented rate across the country. [Link]
Read Bespoke’s most actionable market research by joining Bespoke Premium today! Get started here.
Have a great weekend!
Bespoke’s Morning Lineup – 1/6/23 – And the Number is…
See what’s driving market performance around the world in today’s Morning Lineup. Bespoke’s Morning Lineup is the best way to start your trading day. Read it now by starting a two-week trial to Bespoke Premium. CLICK HERE to learn more and start your trial.
“The telegraph would bind man to his fellow-man in such bonds of amity as to put an end to war.” – Samuel Morse
Below is a snippet of content from today’s Morning Lineup for Bespoke Premium members. Start a two-week trial to Bespoke Premium now to access the full report.
In what has been an overall trend of weaker economic data, the monthly non-farm payrolls report has been an oasis. Heading into this morning’s report, the headline reading had come in better than expected for a record eight straight months, and this morning’s stronger-than-expected report extends the streak to nine. The only notable current streak we can think of that has gone longer is the 11 unsuccessful votes to elect a Speaker of the House.

While the headline reading has enjoyed a record streak of better-than-expected readings, the trend heading into this month and which still remains in place is one of weaker momentum. As shown in the chart below, while readings have been positive for the last two years, they have generally been trending lower. Combining the streak of better-than-expected readings with the actual readings in the total number of jobs created, economists were correct in forecasting a slowdown in job growth, but they overestimated the pace of it.
Not only that, but average hourly earnings and the length of the average workweek both came in weaker than expected.
Heading into this morning’s report, other indicators of employment that we saw earlier this week, including the ADP Private payrolls and jobless claims, investors were gearing up for a hot number this morning. The fact that the headline reading only came in 20K above expectations and that wage growth was weaker than expected are both modest positives.

Our Morning Lineup keeps readers on top of earnings data, economic news, global headlines, and market internals. We’re biased (of course!), but we think it’s the best and most helpful pre-market report in existence!
Start a two-week trial to Bespoke Premium to read today’s full Morning Lineup.