Commercial Bank Deposits Down a Record 3.33% YoY
The Federal Reserve’s FRED data on commercial bank deposits was just updated through the week of 3/15. From the prior week, deposits fell roughly $100 billion, or about 0.56% from $17.6 trillion down to $17.5 trillion. A week-over-week decline of 0.56% is nothing out of the norm, although it was the biggest decline in percentage terms since last April when deposits fell 0.6% during the week of 4/20.
What is out of the norm is the drop we’ve seen in bank deposits over the last year. Prior to 2023, the largest year-over-year decline we’d ever seen in bank deposits was a 1.58% drop back in September 1994. That record drop was broken earlier this year when we got a reading of -1.61% during the week of 2/1. Since 2/1, the year-over-year decline has only gotten worse. As of the most recent week (3/15), the year-over-year decline stands at -3.33%.
Below is a chart showing the year-over-year change in commercial bank deposits using data from FRED. What stands out the most is not just that we’re now at record YoY lows, but that it’s coming after what had been record YoY increases in deposits. Remember, after COVID hit, the government deposited cash into the bank accounts of Americans multiple times.

Below is a look at the absolute level of commercial bank deposits over the years going back to 1974 when FRED’s data begins. During the COVID recession from March through May 2020, bank deposits increased roughly $2 trillion. As you can see in the chart, we’ve never seen a spike anywhere near as large over such a short period of time. Notably, though, deposits kept on running higher for the next two years, rising another $2.8 trillion by the time they peaked at $18.16 trillion in mid-April 2022. That peak came a month after the Fed’s first rate hike of the current tightening cycle, and since then we’ve seen deposits fall about $650 billion from their highs. Given how elevated deposits remain above pre-COVID levels, there’s no reason to think they won’t fall further unless banks really step up the interest they’re paying on deposits given a Fed Funds rate of 5%.

Have you tried Bespoke All Access yet?
Bespoke’s All Access research package is quick-hitting, actionable, and easily digestible. Bespoke’s unique data points and analysis help investors better visualize underlying market trends to ultimately make more informed investment decisions.
Our daily research consists of a pre-market note, a post-market note, and our Chart of the Day. These three daily reports are supplemented with additional research pieces covering ETFs and asset allocation trends, global macro analysis, earnings and conference call analysis, market breadth and internals, economic indicator databases, growth and dividend income stock baskets, and unique interactive trading tools.
Click here to sign up for a one-month trial to Bespoke All Access, or you can read even more about Bespoke All Access here.

Bespoke’s Morning Lineup – 3/27/23 – No News is Good News
See what’s driving market performance around the world in today’s Morning Lineup. Bespoke’s Morning Lineup is the best way to start your trading day. Read it now by starting a two-week trial to Bespoke Premium. CLICK HERE to learn more and start your trial.
“Sitting here in limbo, waiting for the dice to roll.”– Jimmy Cliff

Below is a snippet of content from today’s Morning Lineup for Bespoke Premium members. Start a two-week trial to Bespoke Premium now to access the full report.
Andrew Jackson once said that he had always been afraid of banks, and the market echoed that sentiment for the last several weeks, but this morning, they’ve put those fears aside. A deal from First Citizens Bank to acquire the assets of SVB Financial coupled with the fact that there were no other major headlines of trouble over the weekend here or in Europe, specifically with Deutsche Bank, has futures firmly in positive territory to start the last trading week of the first quarter. The economic calendar is quiet today with the Dallas Fed Manufacturing survey being the only report scheduled for release (10:30 Eastern). In Europe, the major equity indices are all up by more than 1%. It’s a good start at least!
For the equity market, we’re kicking off the last week of the quarter in a bit of a limbo period as the S&P 500 closed out last week modestly above its 200-day moving average (DMA) after briefly breaking below it during the trading day Friday. That was a moral victory for bulls, but it came just a day after it failed to close above its 50-DMA on Thursday after briefly breaking through it to the upside.
Given the pre-opening strength in equities and lack of new stresses in the financial sector, treasuries are selling off this morning, especially at the short end of the curve as the two-year yield is up close to 20 basis points (bps) and inching towards 4%. Crude oil is back above $70 per barrel, and gold is down 1.5% after failing to hold the $2,000 level last week.

Within the S&P 500, it was a broad rally last week as nine of eleven sectors (even Financials!) finished the week in positive territory. The only losers were Real Estate and Utilities which were both down close to 2%. On the upside, it was an interesting mix as Communication Services and Technology led the way higher (so surprise), but right behind those two sectors, Materials and Energy both also rallied over 1%.

Our Morning Lineup keeps readers on top of earnings data, economic news, global headlines, and market internals. We’re biased (of course!), but we think it’s the best and most helpful pre-market report in existence!
Start a two-week trial to Bespoke Premium to read today’s full Morning Lineup.
Bespoke Brunch Reads: 3/26/23
Welcome to Bespoke Brunch Reads — a linkfest of the favorite things we read over the past week. The links are mostly market related, but there are some other interesting subjects covered as well. We hope you enjoy the food for thought as a supplement to the research we provide you during the week.
While you’re here, join Bespoke Premium with a 30-day trial!
This Week In Banking
How Goldman’s Plan to Shore Up Silicon Valley Bank Crumbled by Anna Maria Andriotis, Corrie Driebusch, and Miriam Gottfried (WSJ)
As the pressure on Silicon Valley Bank rose in February amidst losses on their bond portfolio and declining deposits, management came to Goldman for solutions. The result was an equity offering that sparked a bank run and the second-largest ever bank failure in US history. [Link; paywall]
The first social media bank run? A newsletter popular with VCs may have been the domino that started the Silicon Valley Bank implosion by Steve Mollman (Yahoo! Finance)
A newsletter sent out back on February 23rd and widely read by the VC community described Silicon Valley Bank as “technically insolvent” and “levered 185:1”. That was one possible catalyst for the sudden evaporation of the bank’s deposit base a couple of weeks later. [Link]
Policy
How Biden saved Silicon Valley startups: Inside the 72 hours that transformed U.S. banking by Adam Cancryn, Ben White, and Victoria Guida (Politico)
The collapse of Silicon Valley Bank caught many offsides, including members of the Biden administration who frantically huddled through the weekend to understand the problem and start developing solutions. [Link]
European regulators criticise US ‘incompetence’ over Silicon Valley Bank collapse by Laura Noonan (FT)
The scramble last weekend to come up with a plan for stabilizing the banking system in the US has been met with dismay in Europe, where the decision to protect depositors is being described as “total and utter incompetence” for how they “killed a fly with a sledgehammer”. [Link; paywall]
Why Barney Frank Went To Work For Signature Bank by Isaac Chotiner (The NYer)
A remarkable interview with the king of giving interviewees enough rope to hang themselves. Former Representative Barney Frank attempts to explain why he flipped his view on bank regulation when he joined the board of a bank that ended up in FDIC receivership this weekend. [Link; soft paywall]
Republican U.S. Senator Rick Scott, Democrat Warren unveil Fed oversight bill by David Morgan (Yahoo!)
A bipartisan bill introduced in the Senate would replace the Federal Reserve’s internal inspector general with one appointed by the President and confirmed by the Senate. [Link]
What Have We Learned?
SVB, Bailouts, and How to Regulate Capitalism by Yakov Feigen (Building A Ruin)
Since we’re apparently going to be doing some kind of bank bailout regularly anyways, why not cut out the chaotic middlemen and direct investment publicly? [Link]
Investment Management
Star-Led Hedge Funds Hit by Steep Losses, Stunting Their Comeback by Nishant Kumar (Bloomberg)
Financial market chaos in March led to modest losses at multi-strategy funds with a diverse range of portfolio managers. Some more concentrated funds that hit it big last year got absolutely pounded with one fund actually shuttering. [Link; soft paywall]
What You Gain—and Lose—When You Lock Money Up for the Long Run by Jason Zweig (WSJ)
A proposed fund would see investors pay lower fees the longer they hold, but pay a penalty for withdrawals before a lockup period ended
. [Link; paywall]
Visible Prices
Pay Transparency in Job Postings Has More than Doubled Since 2020 by Cory Stahle (Hiring Lab)
A combination of hot labor markets and regulatory intervention in some large states is pushing a change in norms around pay transparency in job listings. [Link]
Bowling for $418? Surge Pricing Creeps Into Restaurants, Movies, Gym Class by Harriet Torry (WSJ)
A widening range of industries are experimenting with surge pricing that changes based on supply and demand at any given time of day or date. [Link; paywall]
Investment
Exclusive: Samsung’s new Texas chip plant cost rises above $25 billion by Alexandra Alper, Stephen Nellis and Heekyong Yang (Reuters)
Soaring raw materials costs are the primary source of price inflation for the huge manufacturing facilities that the chips industry has planned for a variety of locations across the US. [Link]
Boardrooms
Wealthy Executives Make Millions Trading Competitors’ Stock With Remarkable Timing by Robert Faturechi and Ellis Simani (ProPublica)
Well-connected operators are conducting some awfully suspicious trading not in their own company’s shares but in stocks linked to their company including both suppliers and competitors. [Link]
Paging Costanza
The New York Yankees are worth $6 billion, but players still need to pay $9 for Wi-Fi on team flights by Nicolas Vega (CNBC)
The Yankees really need a new travel manager to handle the same duties as Seinfeld’s co-star while he worked for the Steinbrenners. Cheapskate policies on flights are keeping ballplayers off the internet unless they pay up. [Link]
Real Estate
Home remodeling is slowing down, but ‘historic boom’ is coming by Dani Romero (Yahoo!)
An aging housing stock, low fixed mortgage costs, and huge home equity balances are all factors likely to continue driving significant home remodel spend in coming years. [Link; auto-playing video]
New York nears deal to ban gas stoves in new homes by Marie J. French (Politico)
As part of a broader trend and amidst concerns over everything from climate change to indoor air quality, New York is on the verge of a ban on gas furnaces, water heaters, clothes dryers, and stoves. [Link]
Land-use reforms and housing costs: Does allowing for increased density lead to greater affordability? By Christina Stacy et al (Sage)
Using machine learning, this paper creates a dataset of land-use (zoning) reforms that increase or decrease density, and uses that dataset to show that looser zoning restrictions increase housing supply (especially at the upper end of the market) though don’t have strong impacts on rents. Conversely, increased zoning restrictions lower densities and mean higher rent growth and fewer units available to middle-income renters. [Link]
Mangia
Everything I, an Italian, thought I knew about Italian food is wrong by Marianna Giusti (FT)
An incredible retrospective laying bare the lies that are the foundation of a national cuisine. What we think of as “Italian” cuisine is a relatively recent invention that has more to do with marketing than history. [Link; paywall]
AI
The Age of AI has begun by Bill Gates (GatesNotes)
Microsoft’s founder thinks the ChatGPT model is equivalent to the graphical user interface that kick-started personal computing for the masses in the 1980s as far as technical marvels go. [Link]
Labor Markets
Job Listings Abound, but Many Are Fake by Te-Ping Chen (WSJ)
Just because a job is listed as open, it doesn’t mean that there’s actually any interest in hiring. As many as half of online job listings are only kept up to give the impression of growth. [Link; paywall]
Elon
How Elon Musk knocked Tesla’s ‘Full Self-Driving’ off course by Faiz Siddiqui (WaPo)
Personal interventions in the development process by Elon Musk have dragged down the once high-flying progress Tesla had made towards autonomous driving. [Link; soft paywall]
Read Bespoke’s most actionable market research by joining Bespoke Premium today! Get started here.
Have a great weekend!
The Bespoke Report – 3/24/23 – Shaking it Off
This week’s Bespoke Report newsletter is now available for members. (Log in here if you’re already a subscriber.)
What a difference a few hours makes. Heading into the trading day Friday, risk assets around the world were down sharply while treasury yields plunged on a flight to safety as bank vigilantes set their sights on Deutsche Bank as their next victim. After taking SVB down two weeks ago and Credit Suisse last week, Deutsche Bank seemed like the next logical target as it almost always find itself as key player during issues in the banking sector. Some may have even wondered why it hadn’t been targeted earlier!
Below is one chart from this week’s Bespoke Report that you may find interesting. The most concerning aspect of the treasury market has been intraday volatility. Traditionally, the two-year Treasury has been one of the least volatile areas of financial markets, but over the last month, the average daily move in the two-year yield has been over 17 basis points (bps), exceeding the peak volatility of the financial crisis to the most volatile trading since 1983. These are not the types of moves you would expect to see in a well-functioning market and provide another example of something that’s ‘broken’ in the aftermath of the Fed’s most aggressive tightening cycle in forty years.

Continue reading this week’s Bespoke Report newsletter by starting a one-month trial, or click the image below to view our membership options page.

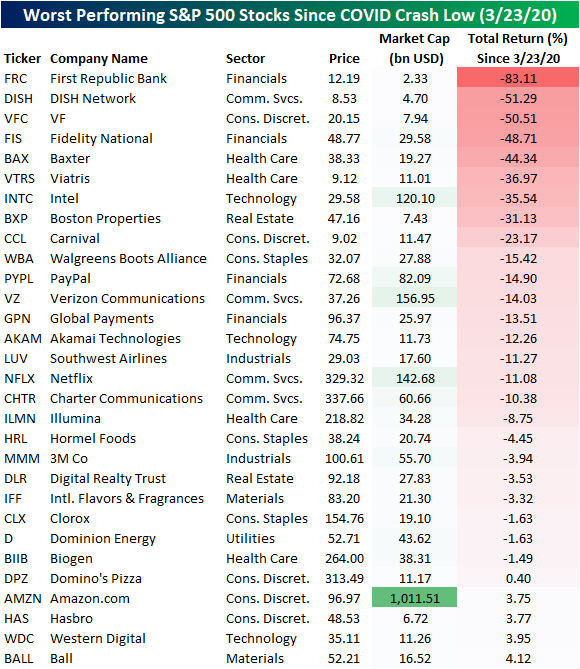
Best and Worst Stocks Since the COVID Crash Low
We are now three years out from the COVID Crash low, and even with the past year’s weakness, most assets continue to sit on solid gains. For major US index ETFs, the S&P Midcap 400 (IJH) is up the most having slightly more than doubled while the S&P Smallcap 600 (IJR) is not far behind having rallied 95.9%. Value has generally outperformed growth, especially for mid and small-caps although that has shifted somewhat this year. For example, while its gains have been more middling since the COVID crash, the Nasdaq 100 (QQQ) has been the strongest area of the equity market in 2023 thanks to the strength of sectors like Tech (XLK) and Communication Services (XLC). Although those sectors have posted strong gains this year, they have been the weakest over the past three years while Energy (XLE) far and away has been the strongest asset class. Paired with the strength of energy stocks has been solid runs in commodities (DBC)more broadly with the notable exception being Natural Gas (UNG) which has lost over 40%. Bond ETFs are similarly sitting on losses since the COVID Crash lows. As for international markets, Mexico (EWW) and India (PIN) have outpaced the rest of the world although Emerging Markets (EEM) as a whole have not been particularly strong; likely being dragged on by the weaker performance of China (ASHR) which holds a large weight on EEM.

Taking a look at current S&P 500 members, nearly half of the index has more than doubled over the past three years. As for the absolute best performers, Energy stocks dominate the list with four of the top five best-performing S&P 500 stocks coming from that sector. Targa Resources (TRGP) has been the absolute best performer with a nearly 900% total return. Other notables include a couple of heavy weight stocks: Tesla (TSLA) and NVIDIA (NVDA) with gains of 563.9% and 412.9%, respectively.

On the other end of the spectrum, there are currently 25 stocks that have posted a negative return since the COVID Crash low. The worst has been First Republic Bank (FRC) which has been more of a recent development. Whereas today the stock has posted an 83.1% loss, at the start of this month it would have been a 65% gain. Another standout on the list of worst performers has been Amazon (AMZN). Most other mega caps have more than doubled since the March 2020 S&P 500 low, however, the e-commerce giant has hardly offered a positive return.
Have you tried Bespoke All Access yet?
Bespoke’s All Access research package is quick-hitting, actionable, and easily digestible. Bespoke’s unique data points and analysis help investors better visualize underlying market trends to ultimately make more informed investment decisions.
Our daily research consists of a pre-market note, a post-market note, and our Chart of the Day. These three daily reports are supplemented with additional research pieces covering ETFs and asset allocation trends, global macro analysis, earnings and conference call analysis, market breadth and internals, economic indicator databases, growth and dividend income stock baskets, and unique interactive trading tools.
Click here to sign up for a one-month trial to Bespoke All Access, or you can read even more about Bespoke All Access here.
Sector Performance Experiences a Historical Divergence
The first quarter of 2023 is coming to a close next week, and checking in on year to date performance, there has been a big divergence between the winners and losers. Although the S&P 500 is up 2.84% on the year as of yesterday’s close, only three of the eleven sectors are higher. Not only are those three sectors up on the year, but they have posted impressive double digit gains only three months into the year. Of those three, Consumer Discretionary has posted the smallest gain of 10% whereas Technology and Communication Services have risen 17.2% and 18.1%, respectively. The fact that these sectors are home to the main mega cap stocks — like Apple (AAPL), Amazon (AMZN), and Alphabet (GOOGL), which have been on an impressive run of late — helps to explain how the market cap weighted S&P 500 is up on the year without much in the way of healthy breadth on a sector level.
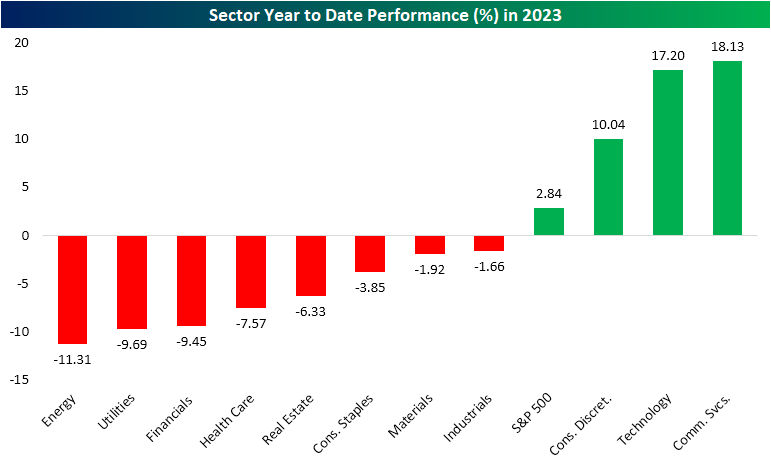

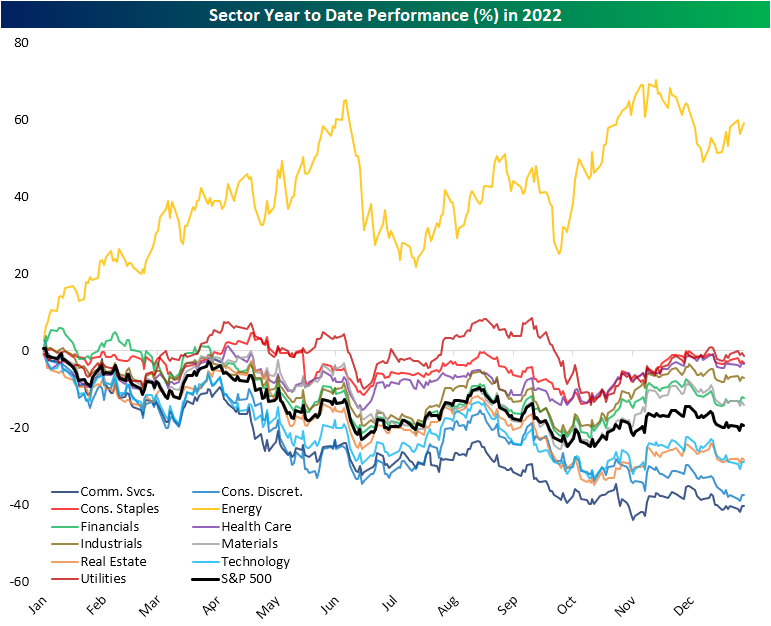
One thing that is particularly remarkable about this year’s sector performance is just how rare it is for a sector to be up 10%+ (let alone 3) while all other sectors are lower. And that is for any point of the year let alone in the first quarter. As we mentioned in yesterday’s Sector Snapshot and show in the charts below, going back to 1990, there have only been two other periods in which a sector has risen at least 10% YTD while all other sectors were lower YTD. The first of those was in May 2009. In a similar instance to now, Consumer Discretionary, Tech, and Materials were the three sectors with double digit gains back then. With those sectors up solidly, the S&P 500 was little changed on the year with a less than 1% gain. As you can see below, though, by the end of 2009, every sector had pushed into positive territory as the new bull market coming out of the global financial crisis was well underway.

The next occurrence was much more recent: 2022. Obviously, it was a tough year for equities except for the Energy sector which had a banner year. Throughout most of the year, the sector traded up by well over 20% year to date even while the rest of the equity market was battered.
Have you tried Bespoke All Access yet?
Bespoke’s All Access research package is quick-hitting, actionable, and easily digestible. Bespoke’s unique data points and analysis help investors better visualize underlying market trends to ultimately make more informed investment decisions.
Our daily research consists of a pre-market note, a post-market note, and our Chart of the Day. These three daily reports are supplemented with additional research pieces covering ETFs and asset allocation trends, global macro analysis, earnings and conference call analysis, market breadth and internals, economic indicator databases, growth and dividend income stock baskets, and unique interactive trading tools.
Click here to sign up for a one-month trial to Bespoke All Access, or you can read even more about Bespoke All Access here.
Bespoke’s Morning Lineup – 3/24/23 – Markets Can’t Calm Down
See what’s driving market performance around the world in today’s Morning Lineup. Bespoke’s Morning Lineup is the best way to start your trading day. Read it now by starting a two-week trial to Bespoke Premium. CLICK HERE to learn more and start your trial.
“It is well enough that people of the nation do not understand our banking and monetary system, for if they did, I believe there would be a revolution before tomorrow morning.” – Henry Ford
Below is a snippet of content from today’s Morning Lineup for Bespoke Premium members. Start a two-week trial to Bespoke Premium now to access the full report.
They’re starting to drop like flies. The dragnet on global banks has moved on to Deutsche Bank (DB) this morning as the stock trades down over 10% following a sharp decline yesterday as well. Given the tendency of the bank to always find itself right in the middle of any issue related to banking troubles, it’s almost surprising that it didn’t happen sooner. There only potential catalyst for the decline in Deutsche Bank stock this morning is a report that suggests that the language in other CoCo bond documents gives regulators discretion to write down the value of those bonds. The fact that central banks worldwide have been happily hiking rates amid global bank runs hasn’t helped the situation.
Credit default swaps (a relatively illiquid market) for Deutsche Bank have surged to a four-year high this morning as investors poke at the bank’s stock and bonds for any evidence of underlying problems. Defenders have cited the bank’s healthy common equity tier one capital (CET1) ratio of 13.4% and the fact that the ratings agencies had been recently upgrading the bank’s credit rating, but for now, the bank’s reputation is all the probable cause the bank vigilantes need.
The trouble in European markets has made its way over to US markets as bank stocks are all trading lower, crude oil is down sharply, and treasuries are as popular as a Taylor Swift concert ticket. There have been some wild moves across financial markets in activity that has been anything but orderly. The two-year Treasury market is a perfect example where 20 bps daily moves in yield, while previously uncommon, have become the norm. Just over two weeks ago, the two-year yield was over 5%. This morning, the yield is at 3.56%. Who’s running this market? Ticketmaster?

Our Morning Lineup keeps readers on top of earnings data, economic news, global headlines, and market internals. We’re biased (of course!), but we think it’s the best and most helpful pre-market report in existence!
Start a two-week trial to Bespoke Premium to read today’s full Morning Lineup.
The Bespoke 50 Growth Stocks — 3/23/23
The “Bespoke 50” is a basket of noteworthy growth stocks in the Russell 3,000. To make the list, a stock must have strong earnings growth prospects along with an attractive price chart based on Bespoke’s analysis. The Bespoke 50 is updated weekly on Thursday unless otherwise noted. There were 18 changes to the list this week.
The Bespoke 50 is available with a Bespoke Premium subscription or a Bespoke Institutional subscription. You can learn more about our subscription offerings at our Membership Options page, or simply start a two-week trial at our sign-up page.

The Bespoke 50 performance chart shown does not represent actual investment results. The Bespoke 50 is updated weekly on Thursday. Performance is based on equally weighting each of the 50 stocks (2% each) and is calculated using each stock’s opening price as of Friday morning each week. Entry prices and exit prices used for stocks that are added or removed from the Bespoke 50 are based on Friday’s opening price. Any potential commissions, brokerage fees, or dividends are not included in the Bespoke 50 performance calculation, but the performance shown is net of a hypothetical annual advisory fee of 0.85%. Performance tracking for the Bespoke 50 and the Russell 3,000 total return index begins on March 5th, 2012 when the Bespoke 50 was first published. Past performance is not a guarantee of future results. The Bespoke 50 is meant to be an idea generator for investors and not a recommendation to buy or sell any specific securities. It is not personalized advice because it in no way takes into account an investor’s individual needs. As always, investors should conduct their own research when buying or selling individual securities. Click here to read our full disclosure on hypothetical performance tracking. Bespoke representatives or wealth management clients may have positions in securities discussed or mentioned in its published content.
Seasonality Keeps Claims Below 200K?
Initial jobless claims remained healthy this week with another sub-200K print. Claims fell modestly to 191K from last week’s unrevised reading of 192K. That small decline exceeded expectations of claims rising up to 197K. Given claims continue to impress, the seasonally adjusted number has come in below 200K for 9 of the last 10 weeks. By that measure, it has been the strongest stretch for claims since last April when there were 10 weeks in a row of sub-200K prints. Prior to that, from 2018 through 2020 the late March and early April period similarly saw consistent readings under 200K meaning that some of the strength in the adjusted number could be on account of residual seasonality.

In fact, this point of the year has some of the weeks in which claims have the most consistently historically fallen week over week. Taking a historical median of claims throughout the year, claims tend to round out a short-term bottom in the spring before an early summer bump. In other words, seasonal strength will begin to wane in the coming months.
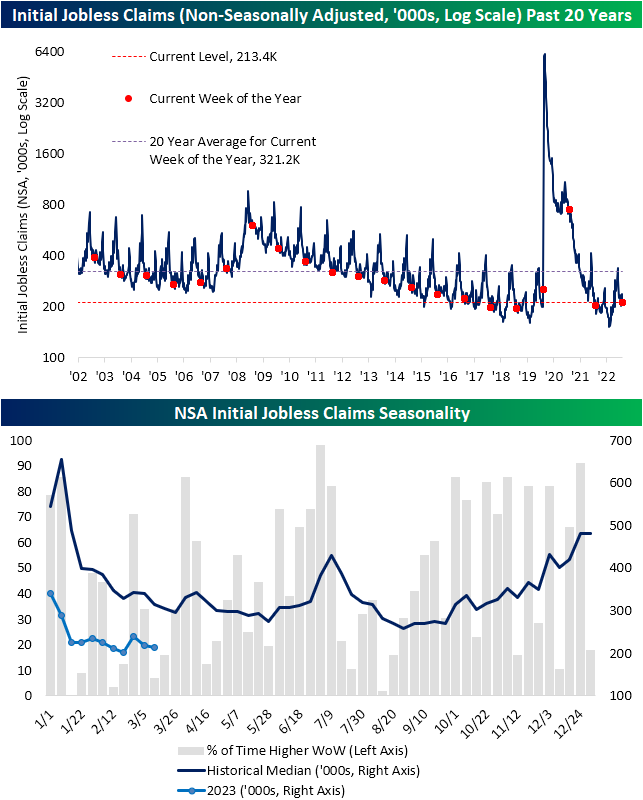
While initial claims improved, continuing claims worsened rising to 1.694 million from 1.68 million the previous week. Albeit higher, that remains below the 2023 high of 1.715 million set at the end of February.

Have you tried Bespoke All Access yet?
Bespoke’s All Access research package is quick-hitting, actionable, and easily digestible. Bespoke’s unique data points and analysis help investors better visualize underlying market trends to ultimately make more informed investment decisions.
Our daily research consists of a pre-market note, a post-market note, and our Chart of the Day. These three daily reports are supplemented with additional research pieces covering ETFs and asset allocation trends, global macro analysis, earnings and conference call analysis, market breadth and internals, economic indicator databases, growth and dividend income stock baskets, and unique interactive trading tools.
Click here to sign up for a one-month trial to Bespoke All Access, or you can read even more about Bespoke All Access here.
A Fed Day Like Most Others
Yesterday’s Fed decision and comments from Fed Chair Powell gave markets plenty to chew on. As we discussed in last night’s Closer and today’s Morning Lineup, there have been a number of conflicting statements from officials and confusing reactions in various assets over the past 24 hours. In spite of all that uncertainty, the S&P 500’s path yesterday pretty much followed the usual script. In the charts below we show the S&P’s average intraday pattern across all Fed days since Powell has been chair (first chart) and the intraday chart of the S&P yesterday (second chart). As shown, the market’s pattern yesterday, especially after the 2 PM ET rate decision and the 2:30 PM press conference, closely resembled the average path that the market has followed across all Powell Fed Days since 2018.
The S&P saw a modest bounce after the 2 PM Fed decision and then a further rally right after Powell’s presser began at 2:30 PM. That initial post-presser spike proved to be a pump-fake, as markets ultimately sold off hard with a near 2% decline from 2:30 PM to the 4 PM close.

So what typically happens in the week after Fed days? Since 1994 when the Fed began announcing policy decisions on the same day as its meeting, the S&P has averaged a decline of 10 basis points over the next week. During the current tightening cycle that began about a year ago, market performance in the week after Fed days has been even worse with the S&P averaging a decline of 0.99%. However, when the S&P has been down over 1% on Fed days (like yesterday), performance over the next week has been positive with an average gain of 0.64%. As always, past performance is no guarantee of future results.

Have you tried Bespoke All Access yet?
Bespoke’s All Access research package is quick-hitting, actionable, and easily digestible. Bespoke’s unique data points and analysis help investors better visualize underlying market trends to ultimately make more informed investment decisions.
Our daily research consists of a pre-market note, a post-market note, and our Chart of the Day. These three daily reports are supplemented with additional research pieces covering ETFs and asset allocation trends, global macro analysis, earnings and conference call analysis, market breadth and internals, economic indicator databases, growth and dividend income stock baskets, and unique interactive trading tools.
Click here to sign up for a one-month trial to Bespoke All Access, or you can read even more about Bespoke All Access here.