Small Business Outlook Cratering
Small business optimism continued to decline in March with the headline index from the NFIB falling from 90.9 down to 90.1. That headline reading was actually better than the consensus forecast of 89.3, but it was still in the bottom decile of the indicator’s historical range dating back to 1986.

Looking across individual categories, breadth was weak in the report with only three indices moving higher month over month, three going unchanged, and all the others falling. As with the headline number, many categories are historically depressed in the bottom decile of readings, including some record lows.
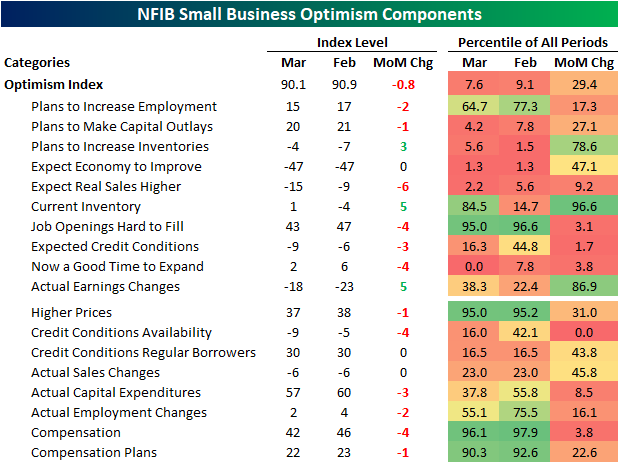
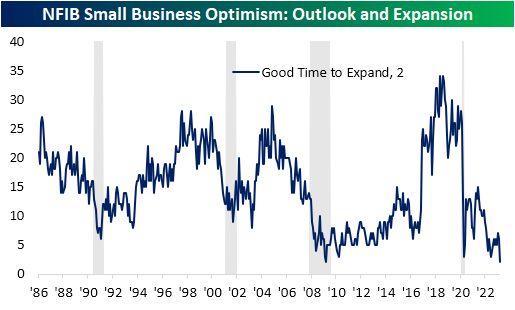
That record low was in the percentage of respondents reporting now as a good time to expand. Only 2% reported now as a good time to expand, down 4 points month over month. While the reading has been at the low end of its historical range for much of the past year, March’s reading matched the historical low from March 2009.
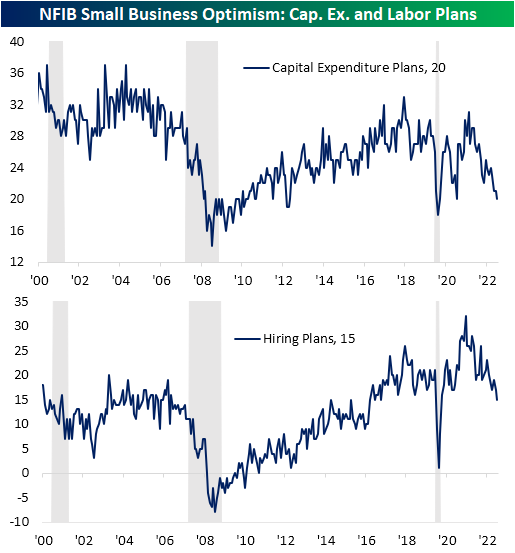
Given the small business outlook for the economy has soured, fewer firms are reporting plans to increase hiring or capital expenditures. In fact, the index for capex plans fell to 20, which alongside March 2021, is the lowest reading since the spring of 2020. Similarly, hiring plans are at new lows for the post-pandemic period.
One factor likely impacting business plans has been financial conditions. The most pronounced decline of any category last month was a record 4-point decline in the availability of loans. While the reading has been rolling over for some time, that drop leaves the index at the lowest level since December 2012.

Have you tried Bespoke All Access yet?
Bespoke’s All Access research package is quick-hitting, actionable, and easily digestible. Bespoke’s unique data points and analysis help investors better visualize underlying market trends to ultimately make more informed investment decisions.
Our daily research consists of a pre-market note, a post-market note, and our Chart of the Day. These three daily reports are supplemented with additional research pieces covering ETFs and asset allocation trends, global macro analysis, earnings and conference call analysis, market breadth and internals, economic indicator databases, growth and dividend income stock baskets, and unique interactive trading tools.
Click here to sign up for a one-month trial to Bespoke All Access, or you can read even more about Bespoke All Access here.

Bespoke’s Morning Lineup – 4/11/23 – Small Businesses Glum
See what’s driving market performance around the world in today’s Morning Lineup. Bespoke’s Morning Lineup is the best way to start your trading day. Read it now by starting a two-week trial to Bespoke Premium. CLICK HERE to learn more and start your trial.
“What are the odds that people will make smart decisions about money if they don’t need to make smart decisions—if they can get rich making dumb decisions?” – Michael Lewis

Below is a snippet of content from today’s Morning Lineup for Bespoke Premium members. Start a two-week trial to Bespoke Premium now to access the full report.
It’s looking like another quiet start to the trading day here in the US as equity futures are little changed and the yields on two and ten-year US Treasuries have moved less than a basis point. The only economic report on the calendar today was the NFIB’s index of small business sentiment, and while it was slightly better than expected, the headline index declined and remains below where it was at the depths of the COVID shutdowns. Within that report, the percentage of small businesses saying now is a good time to expand dropped to levels only seen at the depths of the Financial Crisis in March 2009 while the index for hiring plans dropped to its lowest level since May 2020. In other words, small business sentiment is not particularly optimistic. We’d also note that within the latest Commitment of Traders report, net short positions on the S&P 500 reached their highest level since 2007, so it’s not as though investors are positioned bullishly against the weaker macro backdrop.
In Europe, Retail Sales for February fell 0.8% on a m/m basis, but that was actually in line with expectations. Stocks on the continent are modestly higher after yesterday’s holiday
As recession concerns have grown in the wake of the SVB Financial and Signature Bank failures and the run of deposits from other smaller banks, investors have become increasingly convinced that the indicators which have been flashing recession warning signs for months now may in fact turn out to be accurate. If the economy was slipping into recession, one would expect to see those concerns manifesting in the performance of cyclical sectors. Specifically, Industrials would be one sector expected to underperform while defensive sectors like Utilities would outperform. Looking at the relative strength of the two sectors, however, the market’s message hasn’t exactly confirmed the headlines.
The chart below shows the ratio in closing prices between the S&P 500 Industrials sector ETF (XLI) versus the Utilities sector (XLU). When the line is rising, the Industrials sector is outperforming Utilities and vice versa. Over the last five years, there have been two distinct troughs in the chart. The first was in March 2020 while the next was last September. Back in late February, it looked as though the ratio was on the verge of hitting new five-year highs, but the bank failures and run on deposits stopped the relative outperformance of Industrials right in its tracks. It’s still too early to tell whether this will be a temporary pause or a new leg lower in the ratio, but with banks kicking off earnings season later this week, the tone of companies giving their results will shed a lot of light on that answer. At this point, if the market really was convinced of an impending recession, this ratio would likely be falling much faster.

Our Morning Lineup keeps readers on top of earnings data, economic news, global headlines, and market internals. We’re biased (of course!), but we think it’s the best and most helpful pre-market report in existence!
Start a two-week trial to Bespoke Premium to read today’s full Morning Lineup.
Full-Time Septuagenarian Workers Put in the Most Hours
We track US employment trends in our monthly Bespoke Consumer Pulse survey along with dozens of other interesting consumer and personal finance topics. Each month since 2014, we’ve asked our 1,500 survey participants (with balanced demographics according to the US census) whether they’re employed or not along with how many hours they typically work each week.
When it comes to the average hourly work week, we get the results below when we break down our survey response data by age. The two age bands of employed workers that work the least are the youngest (18 to 24) and oldest (75 or older). Those aged 45 to 54 work the most each week at 38.5 hours, while the 35 to 44 group works the second most at 37.6 hours.

Of course, the youngest workers and oldest workers could be working part-time, which would bring down the average work week for these two age bands. We get some interesting results when we look at average weekly hours for full-time employees only. As shown below, the oldest full-time employees average by far the most weekly hours at 43.0, while the three age bands between ages 45 and 74 all average right around 41 hours. The youngest full-time workers average the fewest weekly hours of any age band at 37.7.
Why would 75+ year-olds be working the longest hours of any age cohort when they’re supposed to be enjoying retirement? Is it work satisfaction? Work ethic? Economic reasons? This may be something we attempt to find out in future surveys!

If you would like to check out our full Bespoke Consumer Pulse report, here’s a link that tells you how to do that.
Have you tried Bespoke All Access yet?
Bespoke’s All Access research package is quick-hitting, actionable, and easily digestible. Bespoke’s unique data points and analysis help investors better visualize underlying market trends to ultimately make more informed investment decisions.
Our daily research consists of a pre-market note, a post-market note, and our Chart of the Day. These three daily reports are supplemented with additional research pieces covering ETFs and asset allocation trends, global macro analysis, earnings and conference call analysis, market breadth and internals, economic indicator databases, growth and dividend income stock baskets, and unique interactive trading tools.
Click here to sign up for a one-month trial to Bespoke All Access, or you can read even more about Bespoke All Access here.
Bespoke’s Morning Lineup – 4/10/23 – Cold Start
See what’s driving market performance around the world in today’s Morning Lineup. Bespoke’s Morning Lineup is the best way to start your trading day. Read it now by starting a two-week trial to Bespoke Premium. CLICK HERE to learn more and start your trial.
“I don’t think one should ever be satisfied with any objective that you’re trying to accomplish because perfection is never attained.” – Fred Ridley
Below is a snippet of content from today’s Morning Lineup for Bespoke Premium members. Start a two-week trial to Bespoke Premium now to access the full report.
With European markets closed for Easter and many Asian markets also still on holiday, it’s been a quiet pre-market session. Chinese stocks were open for trading, though, and they traded modestly lower. S&P 500 futures have been weakening into the open with the Nasdaq leading the way lower, as some of the tech sector’s outperformance this year gets unwound. Friday’s employment report has also raised the odds of a 25-bps hike at the May meeting to better than a two-in-three chance.
Enjoy the quiet while it lasts because earnings season kicks off at the end of this week when the major banks start to report on Friday with Blackrock (BLK), Citi (C), JPMorgan Chase (JPM), PNC (PNC), and Wells Fargo (WFC) all on the calendar. Outside of these banks, the only other notable reports this week will be Delta (DAL) on Thursday and UnitedHealth (UNH) on Friday.
It may be a dull start to the week for stocks, and from a bull’s perspective, dull is good. Historically, the week following Easter has been better than normal. Since 1945, the S&P 500’s median performance during Easter week has been a gain of 0.54% with positive returns just under 60% of the time. For all weeks in the post-WWII period, the S&P 500’s median weekly performance has been just over half of that at a gain of 0.29% with positive returns 56.6% of the time.
Breaking out performance further by how the market was performing YTD heading into the holiday when the S&P 500 was up on the year heading into Easter the median performance during Easter week was a gain of 0.67% with gains 61.7% of the time. That compares to a gain of just 0.20% in years when it was down YTD. Recall that last year, the S&P 500 was down 7.8% heading into Easter and declined 2.8% during Easter week.

Our Morning Lineup keeps readers on top of earnings data, economic news, global headlines, and market internals. We’re biased (of course!), but we think it’s the best and most helpful pre-market report in existence!
Start a two-week trial to Bespoke Premium to read today’s full Morning Lineup.
Bespoke Brunch Reads: 4/9/23
Welcome to Bespoke Brunch Reads — a linkfest of the favorite things we read over the past week. The links are mostly market related, but there are some other interesting subjects covered as well. We hope you enjoy the food for thought as a supplement to the research we provide you during the week.
While you’re here, join Bespoke Premium with a 30-day trial!
Renewables
Contingent Supply: Why Spodumene Reserves May Be the Key to a More Secure Lithium Supply Chain by Arnab Datta & Alex Turnbull (Employ America)
One possible approach to insuring price volatility in key EV inputs doesn’t get carried away is establishing strategic reserves of an important input. [Link]
A Football Field-Sized Boat Will Service US Offshore Wind Farms by Josh Saul (BNN Bloomberg)
In Louisiana, a shipyard is busy turning out the first wind farm service vessel designed to operate in US waters, part of a fledgling offshore industry in this country. [Link]
EVs
2025 Ram REV Just a Regular 1500 Truck With Electric Underpants by Alexander Stoklosa (MotorTrend)
Stellantis’ entry into the EV pickup market offers a massive 168kWh battery pack in its base model with a gigantic 229kWh pack in the longer-range version. That larger pack is a full 100 kWh larger than the F-150 Lightning, for a total size more than 4x that of a sedan like a Tesla Model 3. [Link]
Special Report: Tesla workers shared sensitive images recorded by customer cars by Steve Stecklow, Waylon Cunningham and Hyunjoo Jin (Reuters)
Tesla employees reportedly had access to and shared details from recordings from the company’s internal car cameras. [Link]
Taxes
Internal Revenue Service Inflation Reduction Act Strategic Operating Plan (IRS)
Last year the Inflation Reduction Act granted significant new resources to the IRS, with this report serving to update the Treasury Secretary on what it’s doing with those resources. [Link; 150 page PDF]
Sports
‘It’s about the damn money’ by Kent Babb (MSN/WaPo)
North Carolinian golfer and LIV Tour participant Harold William Varner III on why he’s joining the upstart Saudi golf tour; one part discussion of the golf business and one part biography for one of the most interesting characters in the game. [Link]
Babe Ruth bat sells for record $1.85M after ‘photographic corroboration’ by Dan Hajducky (ESPN)
A bat used by the Babe in 1921 has been photographically corroborated to establish he actually did swing the stick personally. [Link]
Interest Rates
Latest Fed Increase Came Down to the Wire. ‘That Was a Rough Weekend.’ by Nick Timiraos (WSJ)
FOMC voters only decided on their rate plans in the days immediately preceding the March meeting, a highly unusual outcome driven by the bank collapses of March. [Link; paywall]
The pain and SOFRing are almost over by Alexandra Scaggs (FTAlphaville)
After much sturm und drang, regulators have required that even though it will continue to be published, LIBOR will become synonymous with the reference rate that it’s being replaced by. [Link; soft paywall]
Real Estate
Moody’s: Multifamily Demand “Softened notably over the past few quarters” by Bill McBride (Calculated Risk)
Apartment landlords are reporting an uptick in vacancy rates and declining rents in just the latest sign that national rent tightness is over. [Link]
Read Bespoke’s most actionable market research by joining Bespoke Premium today! Get started here.
Have a great weekend!
Zillow the Go-To in Online Real Estate Search
Yesterday we published a note on the most recent results from our Bespoke Consumer Pulse survey that we conduct on 1,500 US consumers each month (with demographics balanced to census numbers). In regards to real estate and housing, one of the many questions we ask consumers is what their favorite website/app is to search for real estate. When it comes to searching for houses, there’s Zillow and then there’s everyone else. As shown below, 48.3% of respondents said that Zillow is their favorite website/app for searching for real estate. Realtor.com ranks second all the way down at 15.6%. While Zillow’s popularity in our survey dipped somewhat in late 2019 and 2020, it has been trending steadily higher since mid-2021 and just hit new survey highs (since 2014) this month.

While Zillow’s popularity with US consumers hit a record high in our survey this month, the company’s share price certainly hasn’t followed this trend. Since the end of 2020, shares of Zillow (ZG) are down 67%, and they’re down 16.5% over the last five years. Of course, in between we saw shares explode higher by more than 600% from their post-COVID lows in March 2020 to their highs in early 2021:
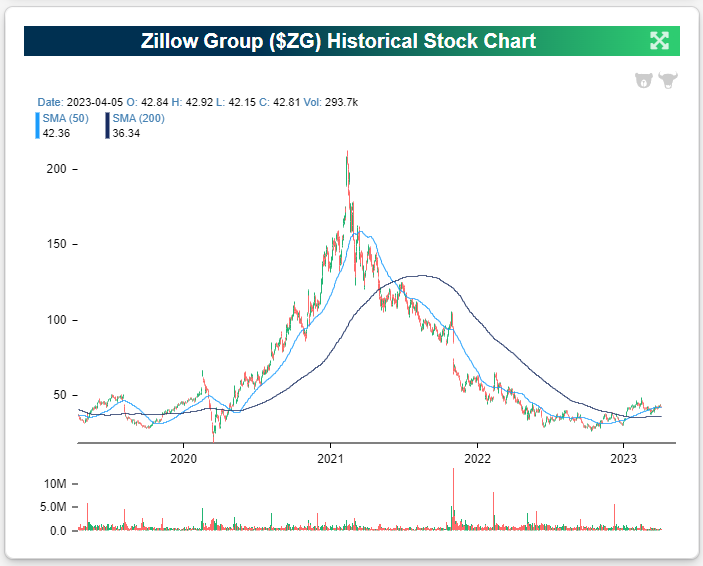
The shorter-term chart for ZG looks quite different, though, with a series of higher highs and higher lows since shares bottomed last October.

Check out our full Consumer Pulse Report here if you’re interested in the latest consumer trends across the economy.
Have you tried Bespoke All Access yet?
Bespoke’s All Access research package is quick-hitting, actionable, and easily digestible. Bespoke’s unique data points and analysis help investors better visualize underlying market trends to ultimately make more informed investment decisions.
Our daily research consists of a pre-market note, a post-market note, and our Chart of the Day. These three daily reports are supplemented with additional research pieces covering ETFs and asset allocation trends, global macro analysis, earnings and conference call analysis, market breadth and internals, economic indicator databases, growth and dividend income stock baskets, and unique interactive trading tools.
Click here to sign up for a one-month trial to Bespoke All Access, or you can read even more about Bespoke All Access here.
Claims Get Revised
Jobless claims were in focus this morning as seasonally adjusted initial claims were surprisingly high at 228K versus expectations of 200K. Previously, adjusted claims had consistently come in well below 200K with 10 readings below that level in the last 11 weeks. However, that large increase in the most recent week’s data was matched with large revisions to the past couple of years’ data as the BLS updated its seasonal adjustment methodology. The net impact of those changes was to redistribute claims throughout the year, revising up readings from Q1 and Q4 while Q2 and Q3 were revised down; total or average annual readings were not changed. As discussed in greater detail on the BLS website and we will review in more depth in tonight’s Closer, there are two methods for seasonal adjustment: multiplicative or additive. Most of the time the claims data has used multiplicative seasonal factoring, but periods like the first year of the pandemic in which the indicator experiences unusually large level increases means an additive approach becomes more apt. This week, the BLS applied a new hybrid approach with additive factoring applied from early March 2020 through mid-2021 and multiplicative factoring for all other periods.
As shown below, that change back to multiplicative factoring resulted in some large revisions for initial claims over the past couple of years. In turn, that has dramatically changed the picture jobless claims have painted. Previously (red line in chart below) claims had been more or less trending sideways after bottoming around a year ago, but after these revisions (blue line) claims are trending upwards and bottomed this past September. In addition, the upward revision to 247K to the print from two weeks ago would mark the highest level since January 2022.

As for the non-seasonally adjusted data, the story is much less noisy being unaffected by the aforementioned revisions. In other words, the overall picture for claims hasn’t changed when looking at this series. Claims remain near historically healthy levels consistent with the few years prior to the pandemic. Granted, those are off the strongest readings from last year. At this point of the year, claims are also trending lower as could be expected based on seasonal patterns. The next couple of weeks may see claims move higher because of seasonality, though, that would likely prove to be a temporary bump in the road with claims resuming the trend lower through the late spring.

The revision likewise impacted continuing claims which rose to 1.823 million in the most recent week. That brings claims back up to the highest levels since December 2021 as they have risen sequentially for three weeks in a row.

Have you tried Bespoke All Access yet?
Bespoke’s All Access research package is quick-hitting, actionable, and easily digestible. Bespoke’s unique data points and analysis help investors better visualize underlying market trends to ultimately make more informed investment decisions.
Our daily research consists of a pre-market note, a post-market note, and our Chart of the Day. These three daily reports are supplemented with additional research pieces covering ETFs and asset allocation trends, global macro analysis, earnings and conference call analysis, market breadth and internals, economic indicator databases, growth and dividend income stock baskets, and unique interactive trading tools.
Click here to sign up for a one-month trial to Bespoke All Access, or you can read even more about Bespoke All Access here.
Sentiment Back to Bullish
Sentiment saw a huge rebound this week based on the latest AAII survey. With the S&P 500 taking out early March highs late last week, bullish sentiment jumped 10.8 percentage points to 33.3%. Although there was a higher level of bullish sentiment as recently as February 16th, this week’s increase was the largest WoW jump since June of last year. Even though a double-digit jump in bullish sentiment sounds significant, S&P 500 performance has been unremarkable following similar instances historically.

The rise in bullish sentiment borrowed almost entirely from those reporting as bearish. Bearish sentiment fell 10.6 percentage points down to 35%. That is the lowest reading since mid-February and the first double-digit drop since November.
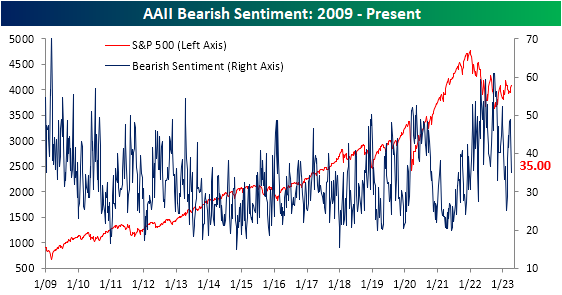
The huge shift in favor of bulls this week resulted in the bull-bear spread narrowing to -1.7 points. That is the least negative reading in the spread since February when the bull-bear spread had broken a record streak of bearish readings.

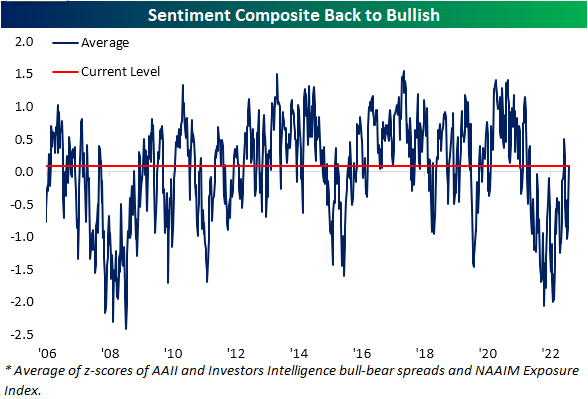
As we noted last week, the AAII survey has been a holdout in showing more optimistic sentiment readings. Whereas other sentiment surveys like the NAAIM exposure index and the Investors Intelligence survey had essentially returned to historical averages, the AAII survey saw firmly bearish sentiment readings with a bull-bear spread of 1.6 standard deviations from its historical average as of last week. Given the quick turnaround this week, the AAII survey is no longer weighing on our Sentiment Composite as it moved back into positive territory indicating bullish sentiment for only the fourth week since the start of 2022.
Have you tried Bespoke All Access yet?
Bespoke’s All Access research package is quick-hitting, actionable, and easily digestible. Bespoke’s unique data points and analysis help investors better visualize underlying market trends to ultimately make more informed investment decisions.
Our daily research consists of a pre-market note, a post-market note, and our Chart of the Day. These three daily reports are supplemented with additional research pieces covering ETFs and asset allocation trends, global macro analysis, earnings and conference call analysis, market breadth and internals, economic indicator databases, growth and dividend income stock baskets, and unique interactive trading tools.
Click here to sign up for a one-month trial to Bespoke All Access, or you can read even more about Bespoke All Access here.
Bespoke’s Morning Lineup – 4/6/23 – Quiet Heading Into The Weekend
See what’s driving market performance around the world in today’s Morning Lineup. Bespoke’s Morning Lineup is the best way to start your trading day. Read it now by starting a two-week trial to Bespoke Premium. CLICK HERE to learn more and start your trial.
“If you want to make enemies, try to change something.” – Woodrow Wilson
Below is a snippet of content from today’s Morning Lineup for Bespoke Premium members. Start a two-week trial to Bespoke Premium now to access the full report.
It hasn’t been an especially good week for economic data so far with notable weakness in employment-related data. Besides the JOLTS and ADP reports which were weaker than expected, the employment component of the ISM Manufacturing report was the lowest in over two years while the employment component of the Services report declined relative to February and is barely clinging to positive territory. Initial Jobless Claims were also just released and came in at 228K relative to expectations for 200K. Continuing Claims were 1.823 mln versus forecasts for 1.7 mln. Initial Claims were the highest since last December while Continuing Claims were the highest since December 2021 So, you can add more weak employment data to this week’s pile. In reaction to the report, futures saw a modest tick lower but nothing major.
All of these indicators are a sideshow, though. Tomorrow’s Non-Farm Payrolls report will either confirm the weakness we have seen in these indicators or render them irrelevant (for a few days at least). Unfortunately, the equity market will be closed for the main event in observance of Good Friday. Bond markets will be open, and lately, they’ve been more volatile than the stock market anyway, so don’t think there won’t be any fireworks. And if that isn’t enough for you, crypto never sleeps!
Open or closed tomorrow, we’ll be watching to see if another epic streak can continue or come to an end. Monthly Non-Farm Payrolls have come in better than expected for eleven straight months, so a better-than-expected report would make it a full year. Never before has the been a streak that long or for that matter even half as long.

Our Morning Lineup keeps readers on top of earnings data, economic news, global headlines, and market internals. We’re biased (of course!), but we think it’s the best and most helpful pre-market report in existence!
Start a two-week trial to Bespoke Premium to read today’s full Morning Lineup.
Smartphones Closing in on TAM; Longer Replacement Cycles
For nearly ten years now we’ve been running our Pulse survey of 1,500 US consumers balanced to census that asks them dozens of questions related to personal finance and economic sentiment. With nearly ten years of data, these survey results are invaluable and give us as good of a read on consumer trends as we can find. (If you would like to learn more about our monthly Bespoke Consumer Pulse survey and the report we produce that accompanies it, you can do so here.)
Along with broader questions about things like employment, credit card payments, new home purchases, and risk tolerance, we also dive into consumer interest across things like smartphones, streaming services, social media use, and e-commerce. In regards to smartphones, every month we ask survey takers a simple question: “Do you own a smartphone?” Below is a chart showing the percentage of respondents that answered “yes” to that question on a monthly basis dating back to July 2014.
In the mid-2010s when we began asking the question, our survey results showed that smartphone penetration in the US was still between 75-85%. By 2020, that number had moved up to ~90%, and since then it has steadily ticked higher to its current level of 97.2%, which hit a new all-time high this month. At 97.2%, there’s basically no runway left when it comes to the total addressable market (TAM) of smartphones in the US. Everyone has one at this point!

The two main competitors in the smartphone space are iPhones and Androids. In our monthly Pulse survey, we closely track trends in this space for investors and companies that are interested in this data.
Along with there now being basically no room to expand smartphone ownership in the US, another problem for smartphone makers is that consumers are replacing them less often. Below are the results from a question we ask survey-takers on how long they typically keep their smartphone before getting a new one. Most respondents to this question typically keep their smartphones for 2+ years before replacing them, but this number actually started to trend lower from 2019 through mid-2021. During that time, respondents reporting that they replace their smartphones every year or less ticked higher. This trend shifted again in 2021, however, and since then we’ve seen a larger and larger share of respondents say that they typically keep their smartphone for 2+ years. Longer replacement cycles mean fewer sales, which is why it’s important for a company like Apple (AAPL) to introduce meaningful new iPhone features that will get consumers to replace their existing iPhones sooner. (Also, remember that longer-lasting batteries and more durable hardware are great for customers, but they also increase the replacement cycle.)

If you would like to check out our full Bespoke Consumer Pulse report, here’s a link that tells you how to do that.
Have you tried Bespoke All Access yet?
Bespoke’s All Access research package is quick-hitting, actionable, and easily digestible. Bespoke’s unique data points and analysis help investors better visualize underlying market trends to ultimately make more informed investment decisions.
Our daily research consists of a pre-market note, a post-market note, and our Chart of the Day. These three daily reports are supplemented with additional research pieces covering ETFs and asset allocation trends, global macro analysis, earnings and conference call analysis, market breadth and internals, economic indicator databases, growth and dividend income stock baskets, and unique interactive trading tools.
Click here to sign up for a one-month trial to Bespoke All Access, or you can read even more about Bespoke All Access here.