The Closer – Waller Rules, IP Miss, Issuance Ramps, EIA, 20y Auction Amazes – 11/16/22
Log-in here if you’re a member with access to the Closer.
Looking for deeper insight into markets? In tonight’s Closer sent to Bespoke Institutional clients, we start out tonight with some commentary on today’s Fedspeak followed by a look at the latest dose of semis earnings (page 1). We then dive into some details of today’s economic data including various retail sales categories and industrial production (page 2). Afterward, we take a look at corporate issuance, FX, real yields, and crude term structure (page 3). Then we provide a recap of the latest EIA data (page 4) before finishing with an overview of today’s very strong 20 year bond auction (Page 5)
See today’s full post-market Closer and everything else Bespoke publishes by starting a 14-day trial to Bespoke Institutional today!
Consumer Discretionary’s Muddled Relative Strength
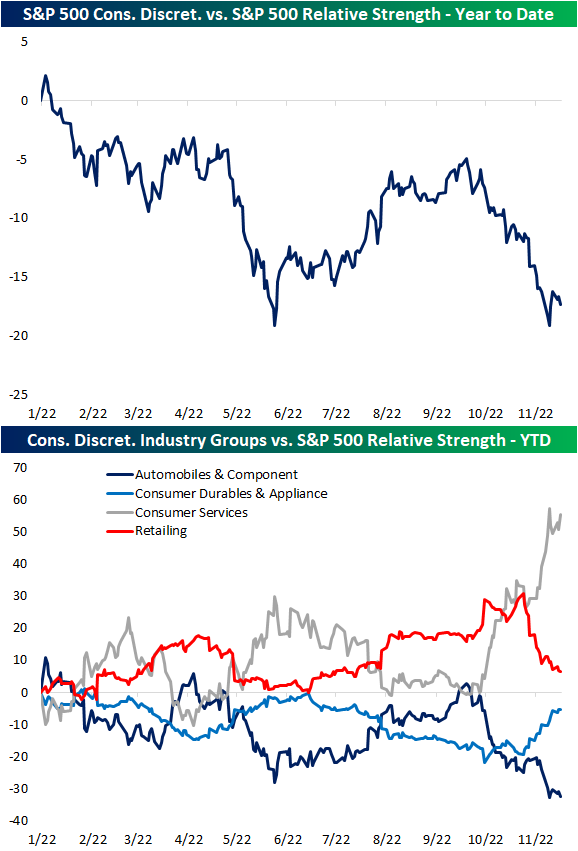
Ranging from today’s retail sales report to homebuilder sentiment to the earnings of some of the largest retailers like Target (TGT) and Lowe’s (LOW), the economic and earnings calendar this week has given Consumer Discretionary stocks plenty of news to digest. Outside of the spring to late summer, the sector has generally been on the decline relative to the S&P 500 in 2022. Last week, that relative strength line bounced right as it reached the late May low. However, over the past few days, it has been resuming its move lower, meaning it is back to underperforming.
While on a sector level the relative strength line has been falling, drilling down to the industry group level, there has been more variation. For example, even with some positive responses to earnings from the likes of Home Depot (HD) or Lowe’s (LOW), the retailing industry has seen a sharp grind lower in its relative strength line versus the S&P 500. Similarly, autos have seen a turn lower although it has been underperforming the S&P for a longer period of time since the early fall. Meanwhile, Consumer Durables and Appliances (which includes stocks like the homebuilders and home appliance makers) has been moving higher. That move has paled in comparison to the relative strength of Consumer Services stocks (restaurants, cruise lines, hotels and resorts), though, as that group’s line has surged over the past couple of months.
As mentioned above, retailers in the Consumer Discretionary sector have been underperforming the S&P 500 lately but there is another group of retailers in which performance has been more solid. The Food & Staples Retail industry is a component of the Consumer Staples sector, and its relative strength line has been trending higher since the spring lows. In fact, after the past week’s move higher thanks in part to a strong response to Walmart (WMT) earnings, its relative strength line is approaching some of the highest levels of the past year, entirely recovering the massive drop from May in the wake of another, much more negatively received, WMT earnings report. Click here to learn more about Bespoke’s premium stock market research service.
B.I.G. Tips – Earnings Season Recap and Triple Plays
Today we published our newest Earnings Triple Plays report. This season there were a total of 133 earnings triple plays out of just under 2,000 individual quarterly earnings reports from US-listed stocks.
What is a triple play? When a stock reports quarterly earnings, it registers a “triple play” when it beats analyst EPS estimates, beats analyst revenue estimates, and raises forward guidance. We coined the term back in the mid-2000s, and you can read more about it at Investopedia.com. We consider triple plays to be the cream of the crop of earnings season, and we’re constantly finding new long-term opportunities from this basket of names each quarter. You can track the newest earnings triple plays on a daily basis at our Triple Plays page if you’re a Bespoke Premium or Bespoke Institutional member. To read our newest report and see some of the triple plays with intriguing charts at the moment, start a two-week trial to Bespoke Premium!
Homebuilder Hopes Demolished
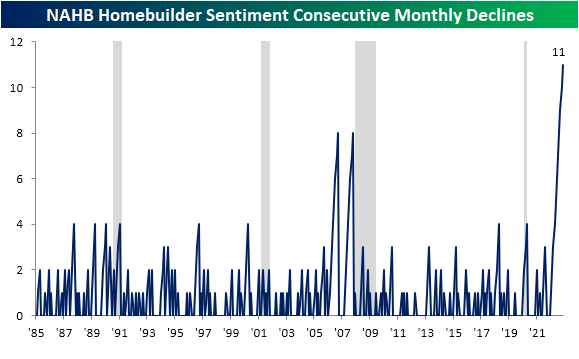
The national average on a 30-year fixed rate mortgage has come back below 7%, but it remains elevated versus recent history as housing data still can’t catch a break. This morning, the NAHB released their latest reading on homebuilder sentiment and for the eleventh month in a row, the headline index fell month over month. As shown below, the current streak of nearly a year straight of declines is far and away a record, surpassing two eight-month long streaks leading up to the Financial Crisis.
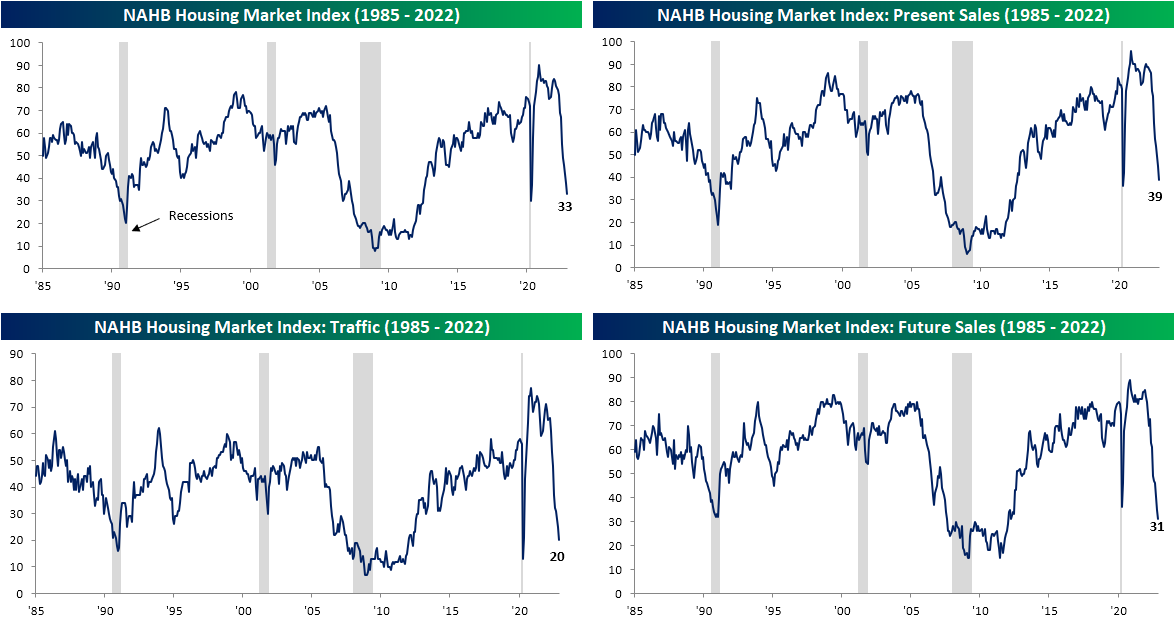
This month, homebuilder sentiment dropped another 5 points down to 33. That is not the largest drop of the current streak of declines, with bigger drops of 8 points last month or 12 points in July, but it still ranks in the bottom 4% of all months on record. In other words, not only is homebuilder sentiment falling consistently, but it’s falling fairly fast. The other components have also seen bottom decile declines with the only sub-index avoiding declines being in the West.
After the November decline, the headline homebuilder sentiment reading sits 3 points above the spring 2020 low. Similarly, Present Sales and Traffic are down to the lowest level since April 2020 while Future Sales have actually surpassed those levels to now sit at the weakest reading in over a decade.
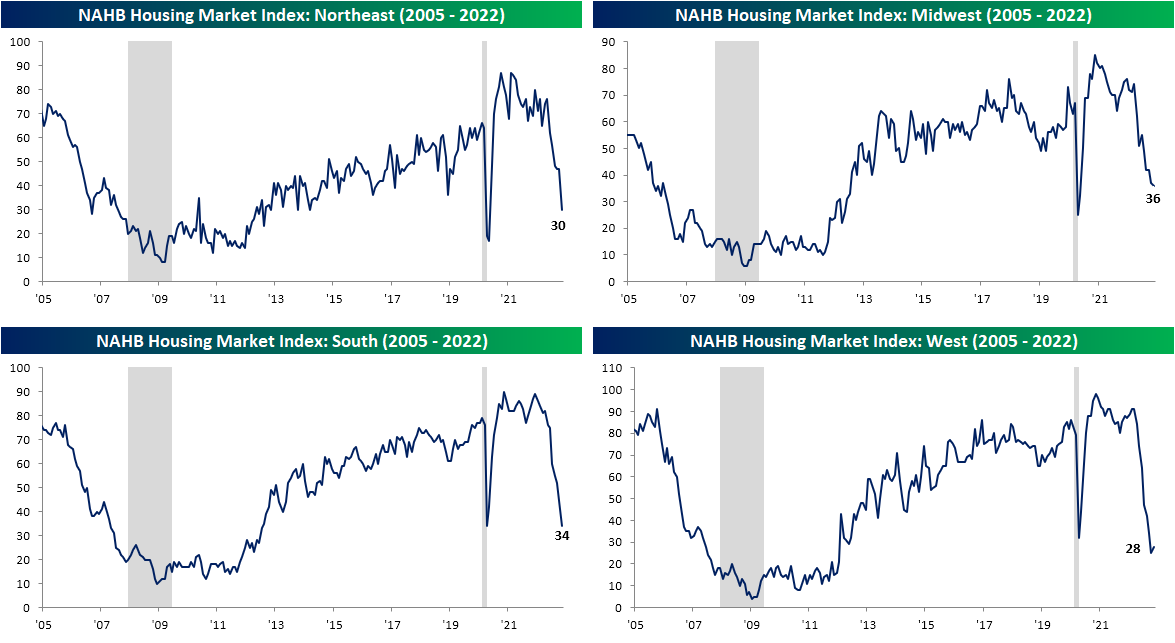
Last month, we highlighted how the geographic breakdown of sentiment was showing homebuilders in the Northeast being much more optimistic than their counter parts in the rest of the country. In November, that region joined the rest of the pack with a massive 17 point decline. That ranks as the third largest monthly decline on record behind a 19 point drop in June 2010 and the 45 point decline at the onset of the pandemic in April 2020. While that has not been enough to result in a new low, similar to sentiment in the Midwest, sentiment in the South is down to the lowest level in a decade. The same could be said for the West although it rose marginally month over month.
As for the reaction of homebuilder stocks, the iShares US Home Construction ETF (ITB) is trading 1.1% lower as of this writing. As shown below, after last week’s equity market surge on CPI in which the group moved not only above its 50-DMA but also its 200-DMA, ITB has continued to hold above its moving averages for now. Without much follow through on the post-CPI surge, any move above last week’s highs would be a welcome bullish sign, whereas the 200-DMA is looking to be the critical level of support for the time being. Click here to learn more about Bespoke’s premium stock market research service.
Bespoke’s Morning Lineup – 11/16/22 – Retail Divide
See what’s driving market performance around the world in today’s Morning Lineup. Bespoke’s Morning Lineup is the best way to start your trading day. Read it now by starting a two-week trial to Bespoke Premium. CLICK HERE to learn more and start your trial.
“You always hear the phenomenon that people are trading down, that’s not happening in our space.” – Marvin Ellison, CEO Lowe’s (LOW)
“Based on softening sales and profit trends that emerged late in the third quarter and persisted into November” Target (TGT) Earnings Release (11/16/22)
Below is a snippet of content from today’s Morning Lineup for Bespoke Premium members. Start a two-week trial to Bespoke Premium now to access the full report.
After some geo-political tensions yesterday afternoon following reports of a Russian missile strike on Poland, markets are breathing a sigh of relief this morning after NATO said that the missile likely did not come from Russia and wasn’t an act of aggression. Despite the eased tensions, futures are modestly lower this morning following a mixed batch of earnings reports. Treasury yields are lower on continued optimism that inflation pressures in the US are easing (we’ll see what Fed officials think throughout the day as a number of speakers are on the calendar), but over in the UK, CPI rose by a 40+ year high of 11.1% y/y.
It looks like it’s a morning of the haves and have-nots in retail. Target (TGT) noted in its earnings release that sales trends are softening after reporting weaker-than-expected EPS and sales. Lowe’s (LOW) seems to be operating on a whole different landscape, though, as the company reported better-than-expected EPS and sales while raising guidance. In an interview on CNBC, CEO Marvin Ellison noted that he has seen no signs of a consumer slowdown and no sign of trading down. Two large American retailers with two entirely different viewpoints on the consumer. It will be interesting to see which comments today’s Fed speakers decide to place more weight on. Getting back to the Lowe’s report, while Ellison noted that consumer trends remain strong, he also added that input prices are starting to trend down, so even from the strong report, there were some positive signs on the inflation front… but it’s just ‘one data point‘.
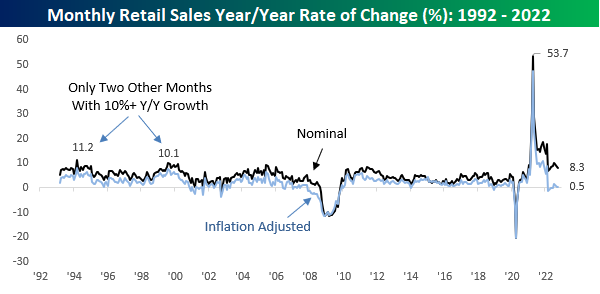
It’s only fitting that right in the thick of retail earnings season, we’re also getting the monthly update on Retail Sales for October this morning. The report came in stronger than expected with headline Retail Sales rising 8.3% on a y/y basis. While that’s strong at the surface, keep in mind that Retail Sales are a nominal reading. After adjusting for inflation, the y/y reading was up 0.5%.
Our Morning Lineup keeps readers on top of earnings data, economic news, global headlines, and market internals. We’re biased (of course!), but we think it’s the best and most helpful pre-market report in existence!
Start a two-week trial to Bespoke Premium to read today’s full Morning Lineup.
Bespoke’s Morning Lineup – 11/15/22 – The Day Trader Turns 155
See what’s driving market performance around the world in today’s Morning Lineup. Bespoke’s Morning Lineup is the best way to start your trading day. Read it now by starting a two-week trial to Bespoke Premium. CLICK HERE to learn more and start your trial.
“Hunches and the mysterious ticker-sense haven’t so very much to do with success.” – Edwin Lefèvre, Reminiscences of a Stock Operator
Below is a snippet of content from today’s Morning Lineup for Bespoke Premium members. Start a two-week trial to Bespoke Premium now to access the full report.
We’re now in the thick of retailer earnings season, and this morning’s two big reports were from Home Depot (HD) and Walmart (WMT). The former is trading modestly lower after reporting better-than-expected EPS and sales while reaffirming guidance. WMT, meanwhile, is surging over 6% after a better-than-expected report and announcing a $20 billion stock buyback. More importantly, inventory levels at the company appear to be coming under control as management guided last quarter. It’s been a roller-coaster ride for WMT this year. After plunging this summer on a profit warning, the stock has recovered all of its losses, and based on where it is trading in the pre-market is now up on the year.
WMT’s positive report has contributed to a positive tone in the futures market. Equities are firmly higher, led by the Nasdaq which is up well over 1%, crude oil is marginally lower, and the ten-year yield is lower. This could all change at 8:30 with the release of the October PPI, but for now, rising stock prices accompanied by lower rates and lower oil prices are more than any bull could ask for.
The spread of the internet during the mid to late 1990s is traditionally regarded as a key catalyst behind the birth of day trading in the stock market. The internet spawned online investing which enabled anyone with available funds to set up a brokerage account and point and click their savings away. Day trading became popular during the dot-com bubble (and again during the COVID lockdowns when consumers flush with cash and nothing to do started trading on their mobile phones on apps like Robinhood), but day traders have been around much longer than that. The founding of the Nasdaq in 1971 and its electronic platform facilitated the practice of more rapid trading, but day trading traces its roots all the way back to the late 1800s following the invention of the ticker tape which was first unveiled on this day 155 years ago.
Prior to Edward Calahan’s invention of the ticker tape, the only way stock prices were disseminated was by word of mouth, through the mail, or by messenger, and you can’t really day trade when you’re getting stock quotes through the mail (even FedEx didn’t start until 1971). Calahan’s invention unlocked the opportunity for anyone with a telegraph line and enough money to pay for a feed to set up a ticker tape and get ‘real-time’ stock quotes (actually delayed by a minimum of 15 minutes but still real-time in 1800s terms). The ticker tape sped up the flow of information and enabled investors to make more well-informed decisions, but it also spawned the creation of bucket shops and other types of venues in cities across the country where traders could go and bet on the direction of stock prices intraday.
Throughout society and culture, we use all sorts of common phrases without even thinking about them (bite the bullet, hands down, etc). In the investment sphere, ‘don’t fight the tape’ is one of them. Without the invention of the ticker tape, there would have been no tape to fight for the last 155 years! Instead, investors would be ‘fighting the mail’ or the messenger (although from a messenger’s perspective being fought with certainly sounds a lot better than being ‘shot’).
When it comes to sentiment lately, consumers don’t seem to be fighting the tape. The latest example we can cite came in yesterday’s monthly update to the NY Fed’s Survey of Consumer Expectations. You may have seen some headlines highlighting the fact that both short-term and long-term inflation expectations ticked higher, but sentiment toward the stock market remains right near the lowest levels in the history of the survey (2013). As shown in the chart below, barely more than a third of investors expect the stock market to be higher one year from now. The only month with a lower reading was in June when it ticked down to 33.8%.

Our Morning Lineup keeps readers on top of earnings data, economic news, global headlines, and market internals. We’re biased (of course!), but we think it’s the best and most helpful pre-market report in existence!
Start a two-week trial to Bespoke Premium to read today’s full Morning Lineup.
Brazil (EWZ) Remains a Black Sheep
As we noted in an earlier tweet, in tandem with the S&P 500 (SPY) here in the US, equities have surged around the globe over the past week. Countries like Taiwan (EWT), Germany (EWG), and Sweden (EWD) have posted some of the most impressive gains with double-digit percentage moves. However, these are also some of the countries currently trading the furthest below their 52-week highs and are down the most since the start of the year.
Relative to the rest of the world, the S&P 500’s one-week performance has actually been middling at just over 5%. Of the 23 major global economies shown below (those which we track in our Global Macro Dashboard), there are only six other countries that have experienced smaller gains. Then there is Brazil (EWZ), the sole country in the red. Inverse to what have been the top performers in the past week, Brazil generally has been a massive outperformer since the start of 2022. Alongside Mexico (EWW), Brazil is the only country to have moved higher year to date with an impressive 10.5% gain. After last week’s decline, though, EWZ is now back below its 50-DMA.
Below we take a look at the 100-day rolling correlation of the daily moves of the Brazil ETF (EWZ) versus the average of all the other country ETFs listed above. That correlation has rolled over quickly in the past several months as Brazil has turned into the black sheep of global equities. In fact, that correlation is currently approaching the low end of the past couple of decade’s range. In fact, currently it is at the lowest level since December 2019 and prior to that the fall of 2018 was the only other recent example of Brazilian equities being this disconnected from other global stock markets. Click here to learn more about Bespoke’s premium stock market research service.
Bespoke’s Morning Lineup – 11/14/22 – Slow Monday
See what’s driving market performance around the world in today’s Morning Lineup. Bespoke’s Morning Lineup is the best way to start your trading day. Read it now by starting a two-week trial to Bespoke Premium. CLICK HERE to learn more and start your trial.
“It is not down on any map; true places never are.” – Herman Melville, Moby Dick
Below is a snippet of content from today’s Morning Lineup for Bespoke Premium members. Start a two-week trial to Bespoke Premium now to access the full report.
After a CPI-fueled monster rally last week where US stocks had one of their best weeks of the year, the tone in equities to kick off the new week has been muted. Futures were lower overnight and remain in the red as we type this, but they have been gradually moving up off their overnight lows. Treasury yields are higher this morning, but the 10-year yield is still below 3.90% for now. If you were looking for signs of a Fed pause after last week’s relatively benign inflation print, Fed Governor Christopher Waller wants you to think again. Bloomberg is reporting that the governor says “we’ve still got a ways to go” not before the Fed starts cutting rates but before it even stops raising rates. He went on to say that last Wednesday’s CPI report was good news but just one data point. We’ll grant the governor that October’s CPI may have been just one data point in the CPI series, but has he noticed the myriad of other pieces of data in the last few months that show inflation pressures have been easing, not to mention the fact that we’ve just seen one of the most aggressive paces of monetary tightening in a six-month span?
After rallying more than 14% off its October lows, Europe’s benchmark STOXX 600 index opened and traded above both its 50 and 200-day moving average for the entire session on Friday and is on pace to do the same thing again today. That’s something we haven’t been able to say since January. Perhaps even more impressive than the 14% rally in local currency is the fact that in dollar-adjusted terms, the STOXX’s performance off the October lows has been a gain of just over 20%. The next level to watch for European stocks is the high from August. Despite their short-term outperformance, European stocks remain in a deep hole relative to the US. Over the last five years, the STOXX 600 is up 32% in dollar-adjusted terms while the S&P 500 has rallied 69%.

Our Morning Lineup keeps readers on top of earnings data, economic news, global headlines, and market internals. We’re biased (of course!), but we think it’s the best and most helpful pre-market report in existence!
Start a two-week trial to Bespoke Premium to read today’s full Morning Lineup.
Bespoke Brunch Reads: 11/13/22
Welcome to Bespoke Brunch Reads — a linkfest of the favorite things we read over the past week. The links are mostly market related, but there are some other interesting subjects covered as well. We hope you enjoy the food for thought as a supplement to the research we provide you during the week.
While you’re here, join Bespoke Premium with a 30-day trial!
National Security
Stratcom Commander Says U.S. Should Look to 1950s to Regain Competitive Edge by C. Todd Lopez (Department of Defense)
While the lesson of Ukraine is that many global adversaries are woefully under-equipped for wars the US might become involved in, the Secretary of Defense advocates a return to an era when the US was able to develop and procure weapons on much shorter timelines. [Link]
Canadian intelligence warned PM Trudeau that China covertly funded 2019 election candidates: Sources by Sam Cooper (Global News)
The federal elections in 2019 were targeted by Chinese intelligence networks, per an analysis by Canada’s own intelligence community. Agents were placed in MPs’ offices and campaigns were orchestrated to punish MPs viewed as insufficiently pro-China. [Link]
Wheels Come Off
FTX used $4 billion including customer funds to keep Alameda afloat: Reuters by Inbar Preiss (The Block)
As crypto exchange FTX collapsed this week, reports emerged that customer funds had been used to cover massive trading losses at an affiliated market-making firm. [Link]
Mortgage Fund in Canada Halts Payouts Amid Liquidity Crunch by Layan Odeh (Yahoo!/Bloomberg)
A Canadian mortgage firm is halting redemptions in response to repayment stress and a surge in investor requests to return their capital. [Link]
Appearances Can Be Deceiving
The U.S. Labor Market Is Less Tight Than It Appears by Rand Ghayad, Carl Shan, and Yao Huang (Harvard Business Review)
An analysis of job postings on LinkedIn suggests that much of the huge increase in job openings is a mirage, with roughly half as much true demand for workers as official statistics would otherwise indicate. [Link]
Monetary Policy Stance Is Tighter than Federal Funds Rate by Jason Choi, Taeyoung Doh, Andrew Foerster, and Zinnia Martinez (FRBSF)
When adjusting the path of the Fed Funds rate to account for information from other financial markets, the Fed Funds rate rose above 5.25% by September of this year, much more policy tightening than has actually taken place thus far. [Link]
Social Media
TikTok Secretly Scores Influencers on Metrics Like ‘Cooperation’ and ‘Diligence’ by Thomas Germain (Gizmodo)
Internal scores at TikTok are being used to rank influencers on the platform across a range of metrics that include enthusiasm, willingness to promote products, and other inputs. [Link]
How Australia became the world’s greatest lithium supplier by Royce Kurmelovs (BBC)
After riding the wave of Chinese demand for iron ore and copper in the last commodities bull market, Australia is jockeying for a spot at the top of the decarbonization supercycle as well. [Link]
Auto Industry
A City Fights Back Against Heavyweight Cars by David Zipper (Bloombeg)
Soaring demand for super-sized trucks are creating huge risks for pedestrians and the climate. Washington, DC is attempting to push back, introducing a new $500/vehicle registration fee for vehicles that weigh over 6,000 pounds. [Link; soft paywall]
Polling
The (good) pollsters got the midterms right by G. Elliott Morris (Substack)
High quality polls generally did a good job of predicting the outcome this election; by some measures, Senate polling was tied with 2006 as the most accurate cycle on record. That’s a huge contrast with the 3-4 point errors in polls for the last Presidential election. [Link]
Read Bespoke’s most actionable market research by joining Bespoke Premium today! Get started here.
Have a great weekend!
The Bespoke Report – 11/11/22 – Real? Or Just Fantasy
This week’s Bespoke Report newsletter is now available for members.
If you thought things were going to calm down after the midterms, think again. No later than two days after Americans voted, financial assets of all types had what were some of the most extreme moves in years. On Thursday, the 10-year US Treasury yield had the 17th most extreme downside move (normalized to the last 200 trading days) since 1980. The S&P 500 had the 15th largest one day rally since 1980, and the US Dollar Index had its 9th largest daily decline over that same span. Investors have been through a lot over the last several years, but Thursday ranked right up there with all of them, and we’re not even including the ‘you-know-what’ show that’s been going on at Twitter! All we can say is that thankfully the moves in stocks and bonds were up rather than down.
There wasn’t a lot of data this week, but it was still full of fireworks rivaling any grand finale. To read this week’s full Bespoke Report newsletter and access everything else Bespoke’s research platform has to offer, start a two-week trial to one of our three membership levels.

