Bespoke’s Weekly Sector Snapshot — 5/27/21
Bespoke’s Top Earnings Triple Plays
Here at Bespoke, our job is to identify winners and losers, and one of the ways we try to find earnings-season winners is through our list of “triple plays.”
Long-term Bespoke subscribers know how much we like triple plays, but for those that haven’t heard of the term, we came up with it back in the mid-2000s for companies that beat analyst EPS estimates, beat analyst revenue estimates and also raise guidance. Investopedia.com is one of the best online resources for financial markets education, and they’ve given us credit for coining the “triple play” term on their website. We consider triple play stocks to be the cream of the crop of earnings season, and we are constantly finding new long-term buy opportunities from this basket of names each quarter.
We’ve been covering epic earnings strength versus estimates for a couple of quarters now, but it’s worth mentioning again that companies are reporting triple plays at the highest rates we’ve seen since we began tracking this data in the early 2000s. Since the Q1 2021 earnings season began on 4/12/21, we’ve seen 272 earnings triple plays. Prior to COVID, a normal earnings season would see 50-100 triple plays. Given their high numbers, triple play stocks are not seeing the same type of upside price reaction that they used to see. We view this as an opportunity to find the triple plays that may still offer upside but haven’t seen it yet due to broader market trends.
In this regards, we’ve gone through the price charts of all 272 triple plays to find the ones that look the best either from a short-term or long-term technical perspective. In all, we identified 49 triple play stocks that we cover in our just-published “Top Triple Plays” report. This report is not meant to be a “buy list” but rather an idea generator that you can use as a starting point for further research into the names we’ve identified.
Learn how to see the 49 stocks in this quarter’s Top Triple Plays report below!
See our Top Earnings Season Triple Plays by signing up for a Bespoke Premium membership now. Click this link for a 14-day trial!
Chart of the Day: Manufacturing Hard Data Slows
Initial Jobless Claims Only 150K Above Pre-Pandemic Levels
For the fourth week in a row, initial jobless claims have made a move lower coming in at 406K. That is down 38K from last week’s unrevised level of 444K. That brings claims to the lowest level of the pandemic, and just 150K above the last sub-one million print in March of last year.

On a non-seasonally adjusted basis, the picture is equally as positive. Claims through the regular state program fell to 420.5K which is again the lowest level since the start of the pandemic. Including other programs no longer significantly increases the total claims count either. PUA claims came in below 100K for the second time in a row this week as they printed at 93.5K. As we noted last week, some states have announced plans to do away with programs like PUA, so this number will become more and more negligible.

Relative to initial claims, seasonally adjusted continuing claims (which are lagged an additional week) have not been trending as positively over the past few months as the series has been moving sideways to even slightly higher. This week saw some respite in this trend as seasonally adjusted regular state continuing claims fell by 96K to 3.642 million. That is still 2K above the low from 2 weeks ago, but the week over week improvement was the largest since the week of March 12th when continuing claims had fallen 282K.
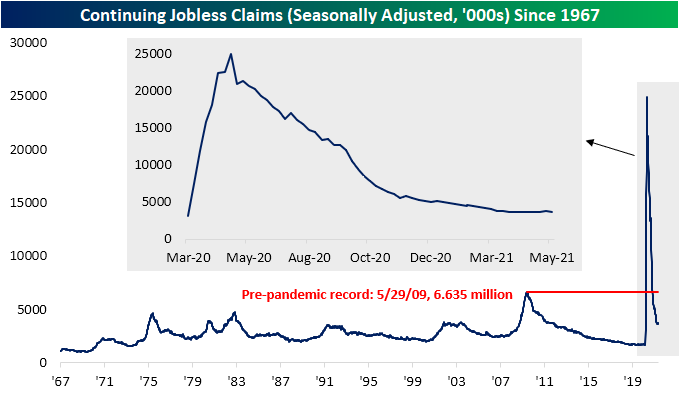
Before seasonal adjustment, the picture is much better. Regular state claims through May 14th have fallen for 12 weeks in a row with the 150K drop this week the largest week-over-week decline since March 12th. Factoring in other programs for a more complete picture delays the data yet another week, but it does paint an even more optimistic picture. After rising at the start of the year, total claims across all programs peaked during the week of February 19th at 20.7 million. In the roughly three months since then, claims have generally ground lower having fallen by 4.9 million. While regular state claims have dropped by 1.18 million in that time, PUA claims have been a bigger contributor to the total decline having erased 1.87 million claims. Pandemic Unemployment Assistance and Extended Benefits programs have also been significant contributors to the overall decline in claims. Combined, these two programs have seen a 1.8 million drop. In other words, while it may not be apparent from the headline seasonally adjusted number, continuing claims are improving alongside initial claims. Click here to view Bespoke’s premium membership options for our best research available.


Bespoke’s Morning Lineup – 5/27/21 – Jobless Claims at Pandemic Low
See what’s driving market performance around the world in today’s Morning Lineup. Bespoke’s Morning Lineup is the best way to start your trading day. Read it now by starting a two-week free trial to Bespoke Premium. CLICK HERE to learn more and start your free trial.
“I have thought it my duty to exhibit things as they are, not as they ought to be.” – Alexander Hamilton
We’ve just received a slug of economic data, and it was a mixed bag. Durable Goods Orders saw a pretty big miss at the headline level (-1.3% vs 0.85) but were slightly better than expected after stripping out Transportation (1.0% vs 0.7%). Jobless claims came in better than expected on both an initial (406K vs 425K) and continuing basis (3,642K vs 3,680K). The second look at Q1 GDP was unchanged at 6.4%, but the Price Index and Core PCE both came in higher than expected.
Despite the stronger than expected inflation data, futures have actually seen a modest bounce following the data.
Read today’s Morning Lineup for a recap of all the major market news and events including a recap of some notable earnings reports, major economic data out of Europe, and the latest US and international COVID trends including our vaccination trackers, and much more.

The charts below come from page seven of our Morning Lineup and show the daily COVID case trends for various regions around the world. The country that stood out more than any others in recent weeks has been India, but the daily number of new cases has nearly been cut in half as the surge part of the recent wave burns itself out. Looking at other major countries/regions, most have been on the decline, but there has been a modest uptick in cases in both Brazil and Chile although neither country is close to its highs from the Spring. Meanwhile, here at home the daily number of new cases continues to shrink and is now below 100 new daily cases per million.

Daily Sector Snapshot — 5/26/21
January Trends Back in Play
Yesterday, by far the biggest mover in the S&P 1500 was GameStop (GME) which rallied 16.34% on the day. While that was the biggest single-day gain since only April 14th when it popped 18.11%, it is being followed by a 12.6% gain today as the stock trades above $200 for the first time since mid-March. Meanwhile, another favorite from the massive short squeeze period earlier this year, AMC Entertainment (AMC), is similarly surging as it is now up 55% so far this week. That brings it to the highest level since the high on January 27th; the same day of GME’s high during the meme stock mania.

Looking beyond just these two focal points of January price action, more broadly the stocks that were the best performers year to date at the time of the GME and AMC highs on January 27th are once again outperforming today. On average, the decile of Russell 3,000 stocks that were up the most YTD on January 27th has risen 2.72% today. Moving down through the other deciles, there is a clear trend in which the stocks that were weaker back in January are seeing worse performance today.
At the same time, highly shorted stocks are back to outperforming. The stocks in the decile of the most heavily shorted names (which includes AMC and GME) are up an average of 2.33% today. Once again, moving down across deciles, there is a clear trend of stocks with lower short interest as a percent of float experiencing weaker performance today and vice versa. Click here to view Bespoke’s premium membership options for our best research available.

Gold (GLD) Extending Winning Streak to 10
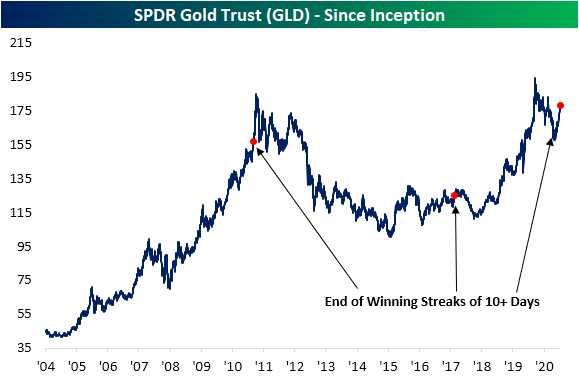
Just over a week ago, gold, the SPDR Gold Trust ETF (GLD) closed above its 200-DMA for the first time since February 1st. The rally that took GLD above its 200-DMA has also broken the downtrend that had been approaching a year in age. Today, GLD is up another 0.22% to the highest level since January 7th.

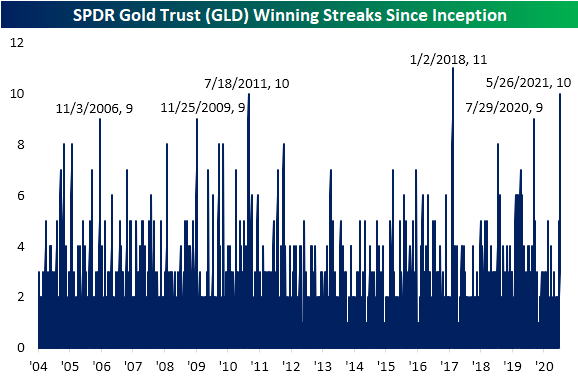
Given another move higher today, GLD is also on pace to close in the green for the tenth day in a row. That is not necessarily the case for other measures of the yellow metal like front-month futures which experienced a 2 bps decline on Monday, but with regards to GLD that is tied for the second-longest winning streak on record. At ten days long, the current streak of consecutive gains is the longest run since the 11-day streak ending 1/2/18. Prior to that, July 2011 was the only other double-digit streak with a few other nine-day-long steaks; the most recent of which ended in July of last year.
The recent rally in GLD continues to set up the over-decade-long cup and handle pattern that we have made note of in the past, though, GLD still needs to rally another 8.15% to take out last summer’s highs to complete the pattern. Given the nearly 8% rally over the course of the current winning streak, GLD has reached extremely overbought levels at more than 2 standard deviations above its 50-DMA and begs the question of how much steam is left.
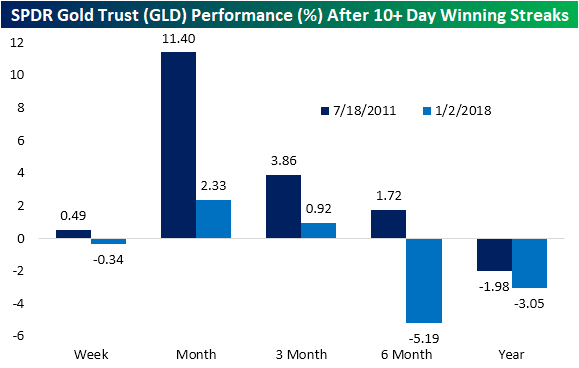
While it is certainly too small of a sample size to put too much weight on, looking at the streaks in 2011 and 2018 that also went on for 10 or more days there has been somewhat mixed performance. The instance in 2011 saw further gains one week later and particularly strong performance over the next month with an 11.4% move higher. Granted, those gains were erased over the course of the rest of the year after the streak came to a close. One year out, GLD was lower than where it stood at the end of the streak. The more recent streak on the other hand was lower one week after coming to an end. While there was a bit more upside in the next quarter, six and twelve months later it was again lower. In order for GLD to take out last year’s high, it’s going to have to buck its recent trend that followed prior extended streaks. Click here to view Bespoke’s premium membership options for our best research available.
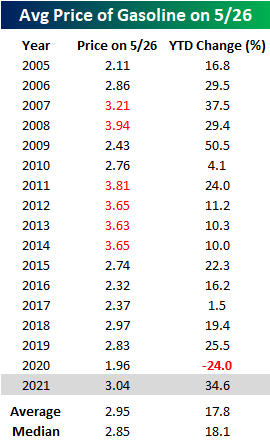
Largest YTD Change in Prices at the Pump Since 2009
It’s that time of year again. Summer driving season kicks off this weekend with the Memorial Day holiday, and if you’re planning on doing a road trip, you may want to consider a trailer for the back of the car to hold all the gas money. The table below shows the AAA national average price of a gallon of gasoline on this day for every year since 2005. At the current level of $3.04, the national average is the highest it has been at this time of year since 2014, and since 2005 there have been just six other years where prices were higher. In terms of the YTD change, prices are already up 34.6% this year, which is the third-largest YTD increase since 2005 and the largest since 2009. That’s not only nearly twice the historical average but also a big swing from last year when prices were actually down 24% YTD as of 5/26.
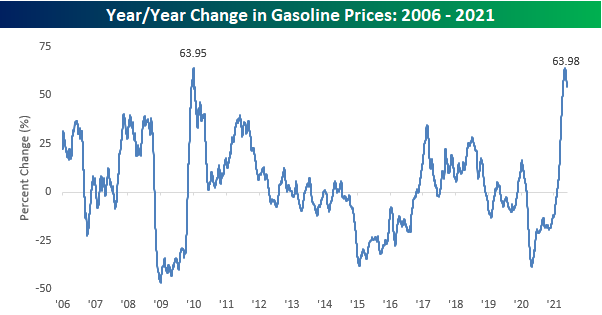
Given the big reversal from a 24% YTD decline last year to one of the largest YTD increases this year, you can imagine that gas prices are up a lot over the last year. Not only is the national average price up a lot, but it also just saw its largest y/y increase on record. Back on May 4th, the y/y increase in the national average topped out at 63.98%, which just barely eclipsed the prior record high of 63.95% from back in January 2010 coming out of the Financial Crisis. It should come as no surprise that the two largest y/y increases in gasoline prices since 2006 have both occurred coming out of major economic contractions. Crude oil and gasoline are notoriously volatile, and their direction is highly correlated to the business cycle.
There’s no arguing the downside of higher gasoline prices for the consumer, but what’s done is done. Looking ahead, seasonal trends suggest that barring a major disruption in supply, the upside potential for gasoline prices may be limited. The chart below compares the YTD change in crude oil prices so far in 2021 to a composite of the average YTD change for all years since 2005. While this year’s increase has been much steeper than the typical year, we have reached the time of year where gas prices typically start to peak out and trade sideways through the Summer before a steady decline to close out the year. Click here to view Bespoke’s premium membership options for our best research available.
