All or Nothing Days Make a Comeback
For those unfamiliar with the term, we consider an “all or nothing day” to be one where the S&P 500’s net daily A/D (advance/decline) reading is greater than +/-400. Earlier this year when the market was going haywire due to the COVID outbreak and subsequent lockdowns, all or nothing days were occurring nearly every other day. In the 50 trading days from 2/21 through 5/1, there were a total of 22 all or nothing days, which works out to 44% of trading days. Going back to 1990, there were only two other periods where the percentage of all or nothing days was higher. The first was in the 50 days ending 12/5/08 while the highest frequency of all or nothing days over a 50-day period was in the second half of 2011. After a 45-trading day lull with no occurrences, all or nothing days are attempting a comeback as the S&P 500 has now seen back to back all or nothing days for the first time since March

As far as for where the frequency of all or nothing days this year ranks compared to other years, 2020 already ranks in the top six of all years since 1990, and there are still nearly four months left to go! If the current pace of all or nothing days this year keeps up through year-end (a big if given that these types of days tend to occur in bunches), 2020 would see a total of 49 all or nothing days, and that would rank as the third-highest for all years since 1990 (2011 – 70 and 2008 – 52). With fall and the most volatile time of the year now upon us, we may just get there. Click here to view Bespoke’s premium membership options for our best research available.

Chart of the Day: Nasdaq Close to a Record Reversal
Late Summer Service Slip
On Tuesday, ISM’s reading on the manufacturing sector rose by more than expected, but the service counterpart released today saw the opposite results. The headline index was expected to fall to 57 but instead fell by slightly more with the headline number coming in at 56.9. Although lower than the past two months, that is still indicative of expansionary activity in the service sector as the index remains at some of the highest levels of the past two years. The same can be said for the composite index which outside of last month, is at its highest level since February of last year.


Breadth in this month’s report was fairly mixed. The majority of indices rose month over month with the biggest increases in prices, exports, and employment. On the other hand, three indices fell and two are in contraction. Of the indices that did fall, the declines were historically large.

The index that experienced the most dramatic decline was that for New Orders. Last month, this index was at a record high of 67.7, but in a complete 180, the index had its second-largest decline on record in August (behind April’s 20 point decline) and is now in the middle of its historical range. That does not mean that there was an overall decline in new orders though. The level of 56.8 still indicates demand grew in August, just at a slower rate than in July.

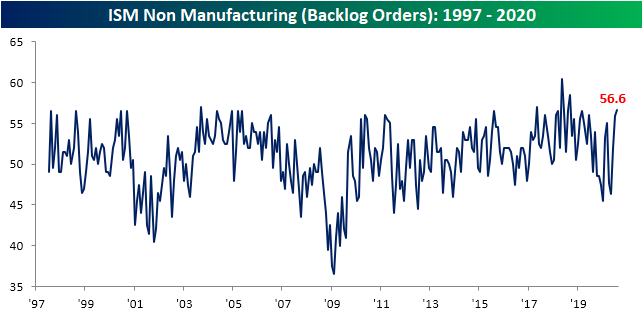
Even though new demand was not as strong, businesses still have plenty on their plates as is evident through the index of Backlog Orders. The index for Backlog Orders rose to 56.6 from 55.9. That is in the 98th percentile of all readings as the index is currently at its highest level since May of 2018.
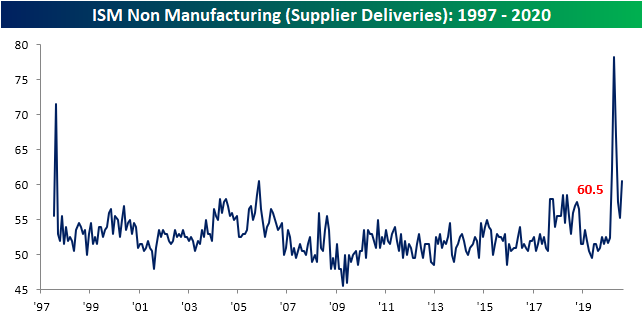
The attempt to fill the growing number of orders has led to inventory drawdowns. The index for Inventories showed a contractionary reading of 45.8. That compares to an expansionary reading of 52 last month. Outside of March’s even lower reading of 41.5, you would have to go back to February of 2010 to find the next lowest reading of this index. Additionally, as inventories have fallen, other supply chain issues seem to have appeared. The index for Supplier Delivers in which higher readings point to longer lead times, experienced its sixth-largest monthly increase on record. That increase brings the index to 60.5 which is tied with November of 2005 for the fifth-highest reading on record.

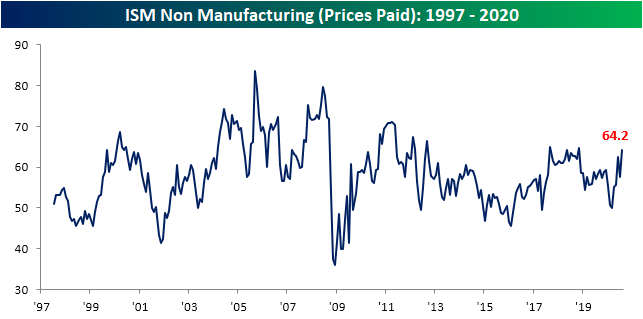
With stronger demand, falling inventories, and greater difficulty getting products from suppliers in a timely manner, it makes intuitive sense that prices are rising fairly rapidly. The index for prices paid rose to 64.2 which is the highest level since November of 2018.
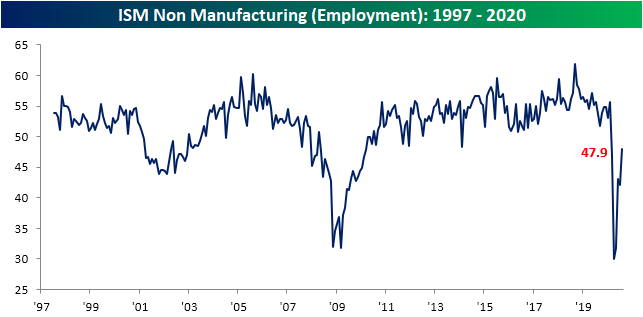
Perhaps the measure that has remained the weakest has been employment. Since the low in April, the index for Employment has risen every month except for last month. Even though it was higher again in August, it has shown a sixth straight contractionary reading. Although more businesses are reporting lower than higher levels of employment, the commentary section of the report did offer some hope. One comment noted that “The need for employees is greater, but we are having a difficult time filling open positions” while another stated that “hiring is authorized, but slow to materialize”.Click here to view Bespoke’s premium membership options for our best research available.
DocuSign (DOCU) Has Been an Earnings Beast
After the close today, DocuSign (DOCU) is scheduled to report third-quarter earnings. Below is a snapshot of DOCU from our popular Earnings Explorer tool, which allows users to pull up historical earnings results for nearly all publicly traded US companies. Over the past couple of years, this stock has been stellar on earnings. DOCU has yet to miss estimates on top-line sales and has only missed EPS once (its Q3 report last year). As for forward projections, the company has actually raised guidance on every single one of its eight quarterly reports as a public company. That means that DOCU has reported a triple play (beat EPS, beat revenues, raised guidance) in seven of the eight reports on record.
Despite consistently making the list of earnings triple plays, stock price reactions for DOCU have been a coin-flip. On its eight historical earnings reports, the stock has only risen on its earnings reaction day 50% of the time.


Based on its earnings history, it is a 50/50 chance that the stock will react positively to results tonight, but headed into earnings, the chart of DOCU is much less extended than it was just a few days ago. In the past week, DOCU surged to new highs that briefly brought it out of the past several months’ uptrend channel. In the past two sessions, though, it has pulled back to the middle/lower end of this channel. This pullback at least gives the stock some breathing room when it reports after the close. You can gain access to Bespoke’s Earnings Explorer with a Bespoke Institutional membership. Click here to start a two-week free trial today!

Sentiment Out of Sync
Recently we have noted how different sentiment indicators have been showing mixed results. While some like AAII’s weekly survey continue to show overall bearish readings, others like the survey from Investors Intelligence are more optimistic. Typically, when the S&P 500 is at an all-time high, AAII’s reading on bullish sentiment has averaged a reading around 40%. But in recent weeks not even a third of respondents have been bullish. After rising for the past four consecutive weeks and despite more all-time highs in that time, bullish sentiment pulled back this week to 30.8% from 32.08% last week. While that remains at the upper end of the past several month’s range, it is very muted compared to where equities are trading.
Meanwhile, the Investors Intelligence survey of equity newsletter writers has much more bullish tones. This week, that survey saw 61.5% of respondents report as bullish. That is the highest reading of bullishness since October of 2018 and the fourth week over week increase in a row.


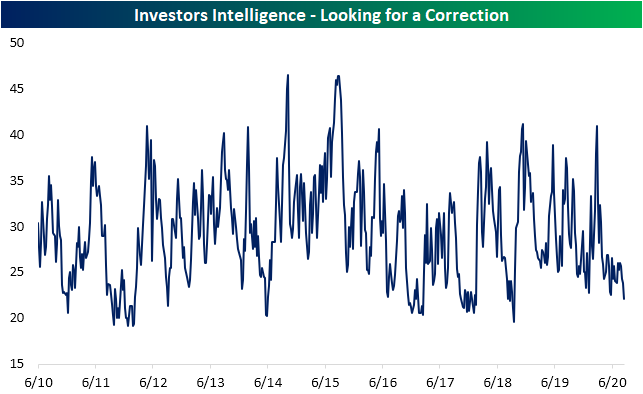
Additionally, Investors Intelligence collects the percentage of respondents that are looking for a correction. This week that reading fell for a fourth straight week to 22.1%. Similar to bullish sentiment from this survey, that is the most optimistic reading since October of 2018.
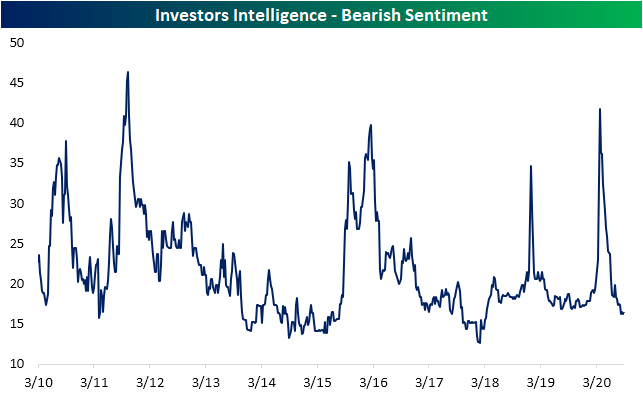
Meanwhile, AAII saw bearish sentiment rise back above 40%. Bearish sentiment remains the predominant sentiment in this survey even though this week’s reading of 41.77% is actually lower than most readings of the past several months. Again, the Investors Intelligence survey is showing the opposite from AAII as bearish sentiment is at 16.4%. That is up slightly from 16.2% last week, but that is still around some of the lowest levels since March of 2018.

Finally, investors also are slightly more decisive in the bear or bull decision as neutral sentiment fell this week from 28.3% to 27.43%, While there have been plenty of lower readings in the late spring and summer, that is still around four percentage points lower than the historical average. Click here to view Bespoke’s premium membership options for our best research available.

Bespoke’s Consumer Pulse Report — September 2020
Bespoke’s Consumer Pulse Report is an analysis of a huge consumer survey that we run each month. Our goal with this survey is to track trends across the economic and financial landscape in the US. Using the results from our proprietary monthly survey, we dissect and analyze all of the data and publish the Consumer Pulse Report, which we sell access to on a subscription basis. Sign up for a 30-day free trial to our Bespoke Consumer Pulse subscription service. With a trial, you’ll get coverage of consumer electronics, social media, streaming media, retail, autos, and much more. The report also has numerous proprietary US economic data points that are extremely timely and useful for investors.
We’ve just released our most recent monthly report to Pulse subscribers, and it’s definitely worth the read if you’re curious about the health of the consumer in the current market environment. Start a 30-day free trial for a full breakdown of all of our proprietary Pulse economic indicators.

No Inflation?
Today’s ISM Services report for the month of August came in slightly lower than forecasts, but one of the bigger stories in the report was the trend of rising prices. The Prices Paid component of August’s report rose to 64.2 which is not far from the five-year high of 64.9. Within the monthly commodities survey, there were price increases all over the place. Respondents in this month’s report noted prices increases in 26 commodities and declines in just four. The 26 commodities rising in price is the highest since October 2017. Not only that, but respondents also noted that 22 commodities were in short supply. Anyone with a basic understanding of economics can tell you that when commodities become scarce, they usually rise in price. Therefore, there’s likely a healthy pipeline of commodities that have the potential to show up in the “Up in Price” section.

Combining the results from today’s ISM Services report with the commodity survey from Tuesday’s ISM Manufacturing report, a total of 41 commodities were up in price during the month of August while just six were down. That net reading of 35 ranks as the highest in just over two years (July 2018). The chart below compares the six-month average of the net number of commodities rising in price and y/y CPI going back to 1999. As the chart illustrates, trends in the commodities survey typically track and often lead changes in y/y CPI, and while the six-month average has now been trending higher for a few months now, CPI is only just starting to tick higher. Not only that but in the next three months, the moving average of the commodities survey is only going to keep rising. Start a two-week free trial to Bespoke Institutional for full access to our research and interactive tools.

Initial Jobless Claims Get Adjusted
The widely quoted seasonally adjusted initial jobless claims number for this week was 881K, which was well below estimates of 950K and last week’s print of 1.011 million. While that is a decline, a like for like comparison of this week’s data to past readings is not entirely accurate. This week was the first week that the Department of Labor changed the seasonal adjustment methodology. In a nutshell, previously the DOL had utilized a multiplicative seasonal effect which is dependent on the level of claims meaning at times of sudden large moves like the past several months, seasonal adjustments tend to over-correct. Instead, the DOL will now use an additive seasonal effect which is independent on the level of the series and should mitigate over or under adjustments. At this point, past weeks’ readings were not revised with this new adjustment methodology and will not be revised until the usual annual revisions at the start of the calendar year.
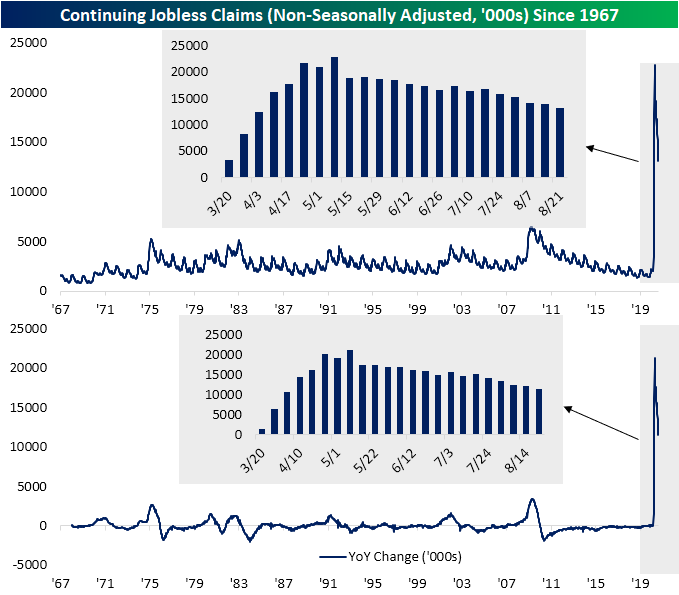
As a result of the changes in seasonal adjustment methodology, looking at the non-seasonally adjusted numbers is a better look at the data for the time being. NSA initial claims rose slightly by 7.6K to 833.4K this week. That is the smallest weekly change since June 25th when they fell by 3.3K. That leaves claims up 659.8K versus the same week last year.

As for continuing jobless claims, on a non-seasonally adjusted basis claims were lower by 764.7K. Now at 13.1 million, continuing claims are at their lowest level since early April, albeit they remain up significantly compared to the same week last year.
While the regular number for claims has been headed lower for both initial and continuing claims, factoring in Pandemic Unemployment Assistance it is not as strong of a picture. Initial PUA claims have risen for a third consecutive week coming in at 0.76 million today. That is the highest amount since late July bringing total claims (PUA + regular claims) to 1.59 million; that is the highest since the last week of July. As for PUA continuing claims, which are lagged another additional week, this week saw a 2.598 million jump in claims. That was the largest one week increase since mid-May and brings total continuing claims to their highest level since July 17th despite a consistent move lower in normal continuing claims. While that is a weaker reading than the past few months, part of that week over week increase could be due to seasonality as claims tend to trend higher from September through the end of the year. Click here to view Bespoke’s premium membership options for our best research available.

Technology Today vs. History
One near constant of 2020 has been the outperformance of Technology stocks. Both during the bear market and in its aftermath, Technology stocks—many of these businesses being insulated or benefiting from the pandemic—have consistently outperformed. Given this outperformance of Technology, lofty valuations, and more, there have been parallels drawn between now and the Dot Com era.
In the charts below, we show the long-term ratios of the S&P 500 Technology sector to other major indices as well as the other sectors. As shown, the Tech sector’s outperformance (rising line) versus basically everything else is clearly evident with the line having risen sharply over the past few years. Currently, Technology in relation to the S&P 500, Russell 2000, Dow, and Dow Transports are all around some of their highest levels since the Dot Com era. Of these, the ratios of Tech to the S&P 500 and Dow are the most elevated and of most concern. On the other hand, the ratio of Tech to Transports is far more muted, and Tech to small caps is also not as dramatically high as the Dot Com days. For these two, there were also even more elevated readings back in the early 1970s; over two decades before the Dot Com boom and bust.

When comparing Technology to other sectors, it is a more mixed bag. The ratio of Technology to Communication Services is the only one that is around a record high. As for the other sectors, the readings are much less extreme. While there are elevated readings like in the case of Financials, Materials, and Energy, they are either not yet at a new high or have other readings prior to the 1990s that are higher just like the ratio of Technology to the Dow Transports. Meanwhile, Technology versus Consumer Discretionary and Health Care are actually more on their low end of historical readings. In other words, Technology has been a massive outperformer and these readings certainly raise an eyebrow, but are perhaps not as extreme as the 1990s or even other years prior to that. Start a two-week free trial to Bespoke Institutional to access our interactive economic indicators monitor and much more.

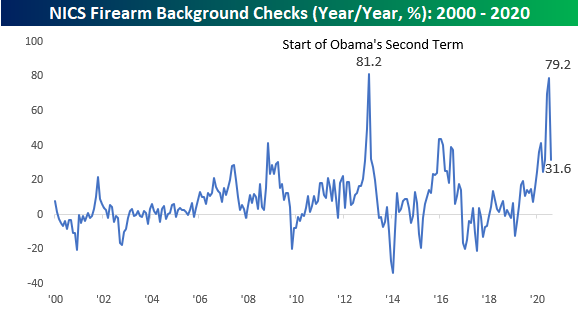
A Little Gun-Shy
As unrest has erupted around the country this year, Federal background checks for firearms have been rising to record levels. Just three months ago, in June, there were a record 3.931 million background checks. In July that total declined by nearly 300K to 3.639 million. Figures for the month of August were released earlier today and showed an additional decline of 524K to 3.115 million. While August’s decline was the largest m/m decline in background checks going back to 1998, the total number of background checks was still the 6th highest monthly total on record, and all but one (December 2015) of the five months that saw larger numbers of background checks were all this year (March, May, June, and July).

Despite what was one of the largest monthly declines on record, the y/y change in background checks was still more than 30% which while down from the 79% y/y rate in July is still a blistering pace. Start a two-week free trial to Bespoke Institutional to access all of our research and interactive tools.