Extraordinary Earnings
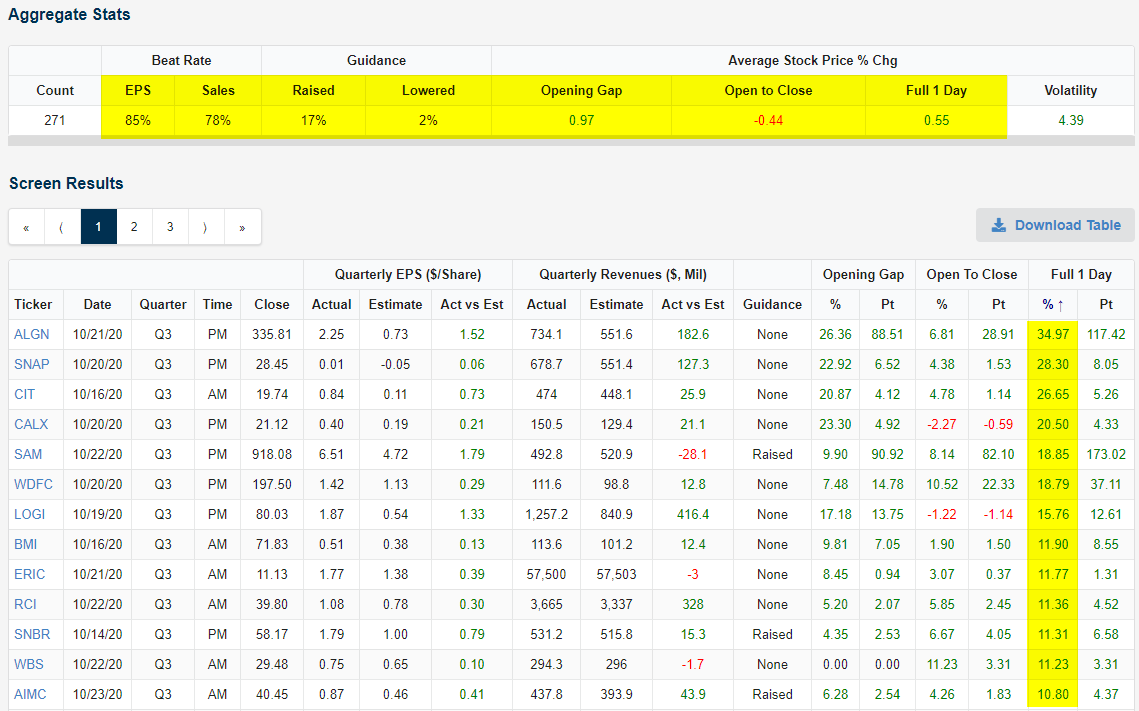
Just when we thought earnings results couldn’t get much better when it comes to beating consensus analyst estimates, the results so far this earnings season have been stronger than ever. Through last Friday, 85% of the 271 companies that had reported Q3 results beat consensus bottom-line expectations. That’s more than 25 percentage points above the average beat rate of ~60% seen over the last twenty years.
The top-line beat rate for revenues has been almost as strong at 78%, while the percentage of companies raising guidance (17%) is higher than we’ve ever seen.
Share-price reactions to earnings haven’t been as strong as beat rates, but the numbers are still positive. So far this season, the average stock that has reported has gained 0.55% on its earnings reaction day (the first full day of trading after the earnings release). To get to that +0.55% full-day gain, the average stock has actually opened higher by 0.97% and then sold off by 0.44% from the open to the close of trading. So while we’re seeing stocks gain in reaction to earnings, underneath the surface we’ve seen a stronger initial reaction to the news and then some intraday selling.
Of the 271 stocks that have reported, 13 have gained more than 10% on their earnings reaction days. These 13 stocks are listed below, with Align Tech (ALGN) at the top of the list after gaining 34.97% last Thursday. Three other stocks have gained more than 20% on their earnings reaction days — Snap (SNAP), CIT Group (CIT), and Calix (CALX). Other notables on the list of big winners so far this earnings season include Boston Beer (SAM), WD-40 (WDFC), and Logitech (LOGI).
Over at Bespoke Premium, we provide clients with the beat-rate trackers below that highlight the rolling percentage of companies beating EPS and sales estimates over the last three months. You can see the massive spike for the rolling 3-month EPS beat rate last earnings season that has ticked even higher so far this season. The only times we’ve seen beat rates even remotely close to these levels were in the early days of the 2003-2007 bull market and the early days of the post-Finanical Crisis bull market in late 2009. Back then, the EPS beat rate ticked up to the ~70% level, but again, we’re a full eight points higher than that now.

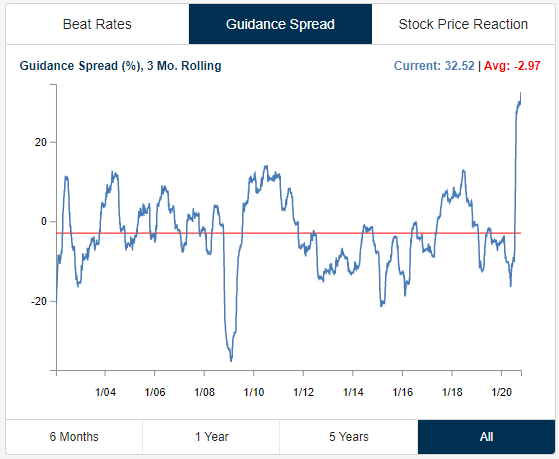
We’re seeing the same extraordinary trend when it comes to what companies are saying about their future prospects. If you follow earnings releases closely, you know that forward guidance drives share-price reactions more than backwards-looking EPS and sales results. Below is our guidance tracker that’s also available to Bespoke Premium clients. This tracker shows the net percentage of companies that have raised guidance (vs. lowered guidance) over the last three months on a rolling basis dating back to the early 2000s. Here again, the guidance spread spiked dramatically last earnings season in July and August, and it has gone on to tick even higher as this season’s results have started to come in. There has never been a period at least in the last 17 years where companies have been this positive on their outlooks relative to prior expectations. We’ve seen spikes before in early 2004, late 2009 and early 2018, but those periods look unexceptional compared to what we’re seeing now. Click here to start a two-week free trial to Bespoke Premium. You’ll start receiving our actionable research in your inbox immediately and gain access to investor tools like our Earnings Explorer referenced in this post.
Bespoke’s Morning Lineup – 10/26/20 – Changing Tides
See what’s driving market performance around the world in today’s Morning Lineup. Bespoke’s Morning Lineup is the best way to start your trading day. Read it now by starting a two-week free trial to Bespoke Premium. CLICK HERE to learn more and start your free trial.
“Do I contradict myself? Very well then I contradict myself, (I am large, I contain multitudes.)” – Walt Whitman
With COVID cases hitting new highs in both Europe and the US and little indication of any breakthrough in a stimulus deal, it doesn’t look as though any Monday rally is in the cards. These can’t be the only reasons for the market’s weakness this morning. Last Friday it was already apparent that case counts were turning higher and the hopes for stimulus were also dim.
Just as important as these developments, an extremely weak earnings report from German software firm SAP (SAP) has also pulled European stocks lower. The stock is down over 20% this morning after commenting that new lockdowns in Europe will hurt demand for the company’s products and services. We’ll hear from the major US mega caps later this week, and any suggestions of weakness on their part will not be met with a friendly reaction.
Be sure to check out today’s Morning Lineup for a rundown of the latest stock-specific news of note, market performance in the US and Europe, key earnings data from the US and Europe, mixed economic data, trends related to the COVID-19 outbreak, and much more.

Last week at this time, we were highlighting the fact that TSA air passenger throughput had just surpassed 1,000,000 for the first time since March. With strong numbers like that, it seemed as though the re-opening track was running relatively smooth. Unfortunately, the seven days since last week’s million passenger reading haven’t been nearly as strong. For seven straight days now, the total number of daily passengers on US airlines have been lower than the same day a week before. That’s the second-longest streak of consecutive daily week/week declines since the start of the pandemic.
In terms of magnitude, the size of the week/week declines has been small on a percentage basis (average of 3%), so it’s not as though air traffic is crashing to a halt, but if the million passenger milestone was a positive trend towards reopening, the slowdown that has followed it suggests that rising case counts have caused Americans to hunker down a little bit. That’s the kind of environment we find ourselves in these days where a real-time indicator of economic momentum can indicate a positive trend at one point and then one week later it totally contradicts itself.

Bespoke Brunch Reads: 10/25/20
Welcome to Bespoke Brunch Reads — a linkfest of the favorite things we read over the past week. The links are mostly market related, but there are some other interesting subjects covered as well. We hope you enjoy the food for thought as a supplement to the research we provide you during the week.
While you’re here, join Bespoke Premium with a 30-day free trial!
Voting
Rock the Vote by Steven W. Webster (Indiana University Working Paper)
More frequent earthquakes related to fracking activity in Oklahoma led to increases in turnout of registered Democrats (who generally oppose fracking). At the least, this is a creative instrumental variable to study democratic accountability. [Link; 26 page PDF]
People are volunteering to be poll workers in record numbers in Philly and the suburbs by Oona Goodin-Smith and Jonathan Lai (Philly Inquirer)
There’s been lots of attention on voter turnout this year, but turnout for poll working positions has also been record-shattering in Pennsylvania thanks to robust voting enthusiasm. [Link]
Taxes
The IRS Reels in a Whale of an Offshore Tax Cheat—and Goes for Another by Laura Saunders (WSJ)
A private equity billionaire admitted to criminal tax evasion featuring over $200mm in income over 15 years, and another billionaire has been charged with hiding $2bn in income offshore. These are relatively rare cases of IRS enforcement on the highest income earners. [Link; paywall]
SEC Issues Record $114 Million Whistleblower Award (SEC)
In a payout likely (based on our speculation) linked to Goldman Sachs’ 1MDB settlement, the SEC paid out $114mm to a whistleblower that led to an undisclosed enforcement action. [Link]
Paul Singer’s Elliott Management moving headquarters to Florida: Bloomberg News (Reuters)
Elliott, which operates in special situations and activist investing, is moving to Florida despite keeping hundreds of employees on its payroll in New York City. [Link]
Sustainability
Microsoft finds underwater datacenters are reliable, practical and use energy sustainably by John Roach (Microsoft)
Earlier this fall, Microsoft announced the results of a project designed to create more reliable data centers by sealing them in metal cylinders with nitrogen and dropping them on the sea floor, which maintains a very cool and stable temperature profile. That stability helps improve performance and longevity. [Link]
Geothermal energy is poised for a big breakout by David Roberts (Vox)
An overview of geothermal energy technology, which offers the opportunity for an abundant, if technologically challenging, energy source that is entirely renewable and can actually act as baseload power (unlike the daily rhythms of solar power, or the fickle weather-sensitivity of wind). [Link]
The paradox of lithium pricing in the Tesla era by David Stevenson (FT)
While a shift to large-scale battery use will lead to absolutely massive lithium demand, the price of lithium has been falling thanks to new production and disruptions from trade disputes. [Link]
Investing
‘Our Recent Performance Sucks.’ Here’s Your $10 Billion Back. by Jason Zweig (WSJ)
A large Philly-based value shop recently closed and returned $10bn in capital to investors after a 30 year track record of strong returns. Recent results were simply too poor to justify continued operations. [Link; paywall]
People Fear a Market Crash More Than They Have in Years by Robert Shiller (NYT)
The combination of COVID and elections have US investors extremely anxious about the possibility of a major equity market decline per data collected by Shiller and the International Center for Finance at Yale. [Link; soft paywall]
Real Estate
Hamptons real estate prices break records as New York City wealthy flee to the beach by Robert Frank (NBC)
As COVID hit New York, the wealthy decamped for more spacious accommodation on Long Island, driving the average sales price for Hamptons homes up almost 50% in Q3 versus Q2. [Link]
Scandal
Leon Black’s Epstein Links Threaten Apollo’s Fundraising by Heather Perlberg and Sabrina Willmer (Bloomberg)
After PE giant Apollo Global Management head Leon Black was reported to have links to sex offender Jeffrey Epstein, clients started to halt investments with the company. [Link; soft paywall]
Reopening
Disney Denounces California’s Theme-Park Reopening Plans by R. T. Watson (WSJ)
Eager to resume operations, Disney is chafing under California regulations that require “minimal” community spread before a theme park can be re-opened in the state. [Link; paywall]
Entrepreneurship
How a tiny peanut butter company grew to $500k per month in sales by Zachary Crockett (The Hustle)
Too much of a good thing can swamp a business, and that was the experience of Nerdy Nuts, a home-based peanut butter company that started as the pandemic hit. [Link]
Read Bespoke’s most actionable market research by joining Bespoke Premium today! Get started here.
Have a great weekend!
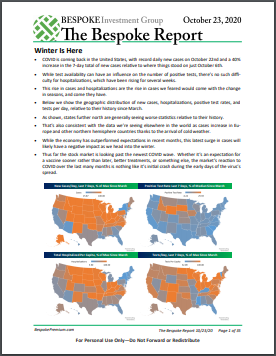
The Bespoke Report — Winter Is Here
With COVID surging in the US and across the northern hemisphere, we discuss economic impacts that are already starting to appear in survey data. We also review the week that was in global equity markets, the weakening US dollar, rising interest rates, the extremely strong housing market, and of course earnings. It was a very busy week in the US and Europe this week, featuring reports from a wide range of important companies. We give a full recap, including a breakdown of how COVID-sensitive names have reported before previewing the pre-Halloween economic and earnings slate in this week’s Bespoke Report.
This week’s Bespoke Report newsletter is now available for members.
To read the report and access everything else Bespoke’s research platform has to offer, start a two-week free trial to one of our three membership levels. You won’t be disappointed!

Nasdaq vs. Dow Outperformance
You may not realize it, but while the Tech-heavy Nasdaq Composite is up a ridiculous 28% so far in 2020, the Dow Jones Industrial Average is still in the red on the year.
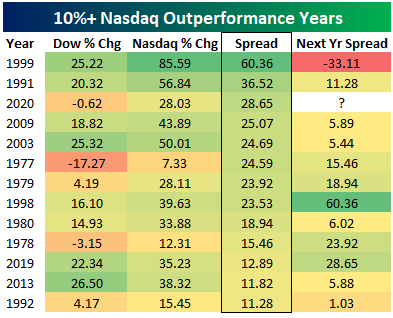
Below is a table showing the Dow and Nasdaq’s annual percentage change since 1972 when the Nasdaq came into existence. Were the year to end now, the Nasdaq would be outperforming the Dow by 28.65 percentage points. This would be the third strongest outperformance for the Nasdaq on record and the strongest since 1999 when the spread was 60 percentage points!

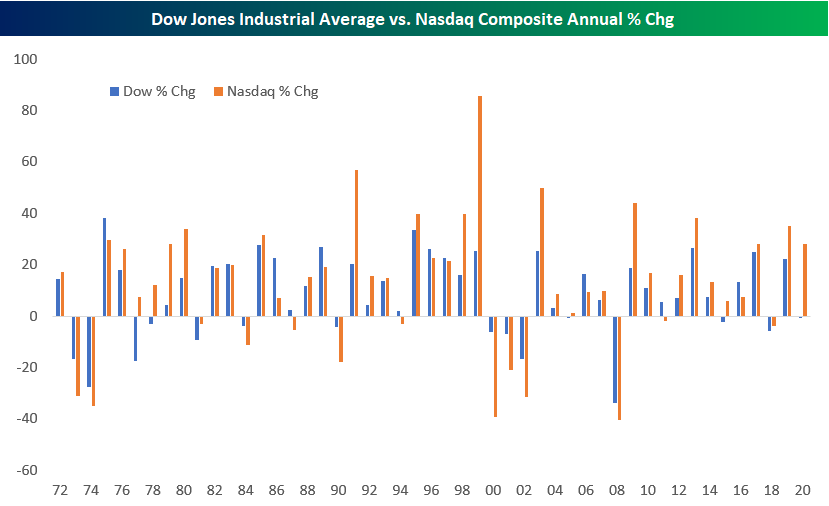

Below are all years since 1972 in which the Nasdaq outperformed the Dow by at least ten percentage points. The Nasdaq has posted an annual gain of 20%+ in seventeen different years, but never in a year when the Dow was in the red. Probably the year that most resembles 2020 in terms of the performance spread is 1979 when the Nasdaq rose 28.11% and the Dow rose just 4.19%. Following that year in 1980, both the Dow and Nasdaq surged again and the Nasdaq outperformed by another 18.9 percentage points.
Interestingly, of the twelve years where the Nasdaq outperformed the Dow by more than ten percentage points, the Nasdaq went on to beat the Dow again in the next year eleven out of twelve times. The only time we’ve seen the Nasdaq crumble versus the Dow in the following year was in 2000 after 1999’s outperformance. In 1999, the Nasdaq beat the Dow by a humongous 60 percentage points. After that large gap, though, the Nasdaq ran out of gas in 2000 and underperformed the Dow by 33 percentage points when the Dot Com Bubble finally burst. Click here to view Bespoke’s premium membership options for our best research available.
Bespoke’s Morning Lineup – 10/23/20 – Around the Curve
See what’s driving market performance around the world in today’s Morning Lineup. Bespoke’s Morning Lineup is the best way to start your trading day. Read it now by starting a two-week free trial to Bespoke Premium. CLICK HERE to learn more and start your free trial.
“When the winds of change blow, some people build walls and others build windmills.“ – Unknown
Major US indices are on pace to finish a down week on a positive note as long-term interest rates continue to rise, and the dollar is on pace to close at a 52-week low. Earnings news has been mixed, but the notable laggard is Intel (INTC) which is down over 10% following another weak report last night after the close.
Be sure to check out today’s Morning Lineup for a rundown of the latest stock-specific news of note, market performance in the US and Europe, key earnings data from the US and Europe, mixed manufacturing and services sector PMI data, trends related to the COVID-19 outbreak, and much more.
We haven’t talked about the yield curve (which we measure as the spread between the yields on the 10-year and 3-month US Treasuries) much lately, but it deserves some attention based on recent moves. Driven by higher rates at the long end of the curve, the yield curve stands at 77.36 basis points (bps) as of this morning. Not since late March have we seen a steeper reading. Back in June, the curve saw a brief surge on investor optimism of a smooth re-opening as COVID cases had been on the decline. That spike in the curve didn’t last long as cases in the South spiked up in early Summer. This time around the steeper curve has occurred against a backdrop of deteriorating trends on the COVID front similar in magnitude to what was seen in the Summer, but with polls showing odds for the Democratic party to see a sweep in early November, the prospect of a big relief bill looks more likely, pushing long-term rates higher. Whether that happens only time will tell, but that’s at least what polls are currently showing.

Record Steak of Negative Bull-Bear Spread Readings Comes to an End
Even though the S&P 500 has drifted lower over the past week having trouble holding onto its intraday highs, sentiment has continued to improve. AAII’s reading on bullish sentiment has moved above 35% for the first time since April 9th this week, rising to 35.75% and up just under one percentage point from last week.

As bullish sentiment has risen, bearish sentiment has declined precipitously. Just 33.03% of investors reported as bearish this week compared to 35.75% last week. That is the lowest level since February 20th right as the bear market began earlier this year. This week also marked a fourth consecutive week that bearish sentiment has fallen while bullish sentiment has risen. That is only the ninth such streak in the history of the data with only one streak going to five weeks (in February of 1991) and the most recent streak ending at four weeks in January of 2018.
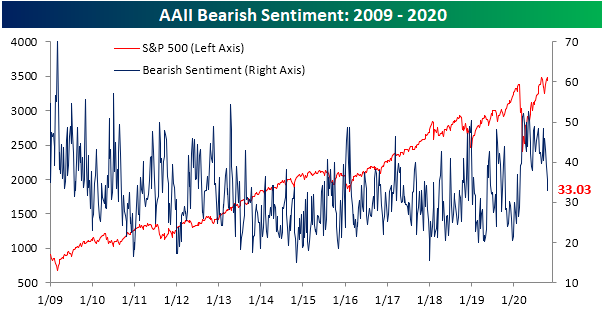
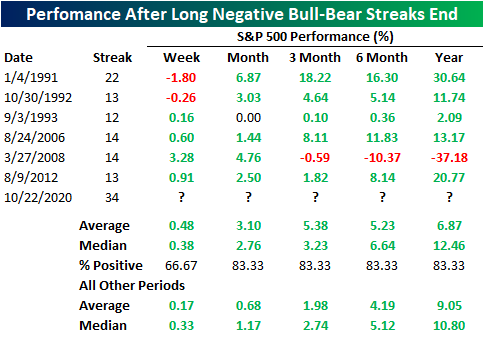
The continued inverse moves in bullish and bearish sentiment have finally resulted in the bull-bear spread to tip positive. For the first time in 34 weeks (since February 20th), there were more investors reporting as bullish than bearish. As shown in the second chart below, that brings to an end what was by far the longest streak of negative readings in the bull-bear spread on record.


Given that streak of negative readings in the bull-bear spread went on for such a long time, it is hard to compare to previous lengthy streaks. In the past, there have only been six other streaks in which the bull-bear spread was negative for more than 10 weeks. As shown in the table below, performance for the S&P 500 has typically been positive following these past occurrences with slight outperformance relative to all periods. The only time that returns were well below average and negative three months to one year later was in 2008. Click here to view Bespoke’s premium membership options for our best research available.
Leading Indicators Returning Back to a Normal Range
Like some other indicators earlier this year, the index of Leading Economic Indicators released each month by the Conference Board experienced both its largest-ever m/m decline and increase in the span of under six months. In March, when the US economy was essentially shut down, the index of Leading Indicators dropped a record 7.4% in just a single month. By June, as the economy started re-opening, the index saw a record m/m gain of over 3%. While it hasn’t been enough to erase all of the declines, it has come a long way. Since that June surge, though, we’ve seen a deceleration of the growth in Leading Indicators for three months in a row to September’s level of 0.66%. While 0.66% is down a lot from the June high, before the last three months, 0.66% would have been the strongest level of growth in this index since February 2018.
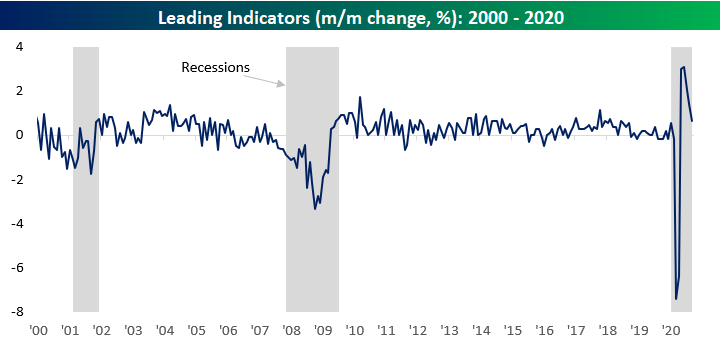
As mentioned above, the index of Leading Indicators is still well off of its highs, but it has still erased more than half of the declines we saw prior to the COVID crash. The chart below shows the Leading Indicators index going back to 1959, and looking at the index’s behavior during prior recessions would once again suggest that the recession is over. In every recession of the last 60 years, never before has there been a time where the index saw this large of an increase from its lows with the economy still in recession.

The ratio of Leading Indicators to Coincident Indicators also shows an interesting trend with regards to the current period relative to others. First off, as we have noted in the past, throughout history the ratio has typically started to roll over well before the onset of a recession. Even in the current period, the ratio peaked more than a year before the recession started. Compared to prior periods, the rollover wasn’t nearly as large in magnitude as prior periods, and there’s obviously no way this ratio could have predicted a global pandemic, but technically speaking its record of accurately predicting recessions remains intact.
The lower chart shows a larger version of the ratio since the start of 2009, and in it, we show each of the prior periods during this span where the ratio saw an extended period without making a new high. For the current period, it has now been 24 months since the ratio’s last peak. While that’s a long time, from the middle of 2011 through mid to late 2013, the index went even longer without making a new high. Click here to view Bespoke’s premium membership options for our best research available.

Chart of the Day: MYR Group (MYRG)
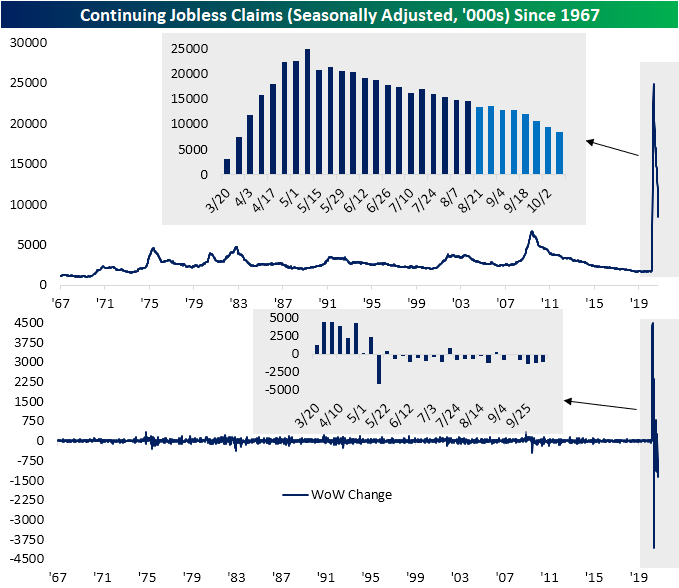
California Back in the Game as Claims Continue to Fall
Another week, another pandemic low for jobless claims. Initial jobless claims came in at a seasonally adjusted 787K this week. That is down 55K from last week’s revised number which was taken down by a similarly large 56K from the original print of 898K. Since the report released on October 1st, reporting of claims out of the most populous state in the US, California, has been on pause in order to reduce backlogs and implement fraud protection. As a result, California claims have been held constant at 226K over the past few weeks. This week the revisions for those past weeks are in and reporting from the Golden State has resumed. The most recent claims reading from that state came in at 158K compared to the revised 176K last week. In other words, although it did not account for the entirety of the big moves, California’s numbers accounted for a large portion of the downward revision last week as well as this week’s decline.

Regardless of the nuance concerning California, overall national claims were healthier this week. Unadjusted claims fell as is seasonally normal for this week of the year, coming in at a pandemic low of 756.6K. That is a 73.1K decline from last week’s revised 829.7K print (revised down from 885.9K).

Lagged one week to initial claims, continuing jobless claims were also lower this week falling to 8.373 million. That is not only the lowest level since the final two weeks of March, but it was also the first time that continuing claims were below 10 million in back to back weeks since then. Again, with the point that state-level reporting quirks could play a role in the large moves, this week also marked a third consecutive week that claims have fallen by more than one million week over week; the only time in the history of the data that has happened.
While regular continuing claims have continued to fall, they do not necessarily tell the full story as there are multiple other programs like Pandemic Unemployment Assistance (PUA), Pandemic Emergency Unemployment Compensation (PEUC), and extended benefits to name a few. Although these are lagged yet another week (most recent data for the first week of October), they show the same story of continued improvements as total claims have fallen for three straight weeks. The two largest programs—regular state claims and PUA claims—have been the main drivers. On the other hand, one worrying sign is PEUC and extended benefits have been on the rise in recent weeks, though they both remain relatively small but still a growing shares of total claims. Click here to view Bespoke’s premium membership options for our best research available.
