Bespoke’s Morning Lineup – 11/3/20 – Two Markets
See what’s driving market performance around the world in today’s Morning Lineup. Bespoke’s Morning Lineup is the best way to start your trading day. Read it now by starting a two-week free trial to Bespoke Premium. CLICK HERE to learn more and start your free trial.
I have an idea about voting, how about on every ballot we include “None of the above”. Imagine if you won the election but lost to ‘None of the Above’. Wouldn’t that make you re-think your positions?” – Jesse Ventura
Futures markets are indicating a continuation of the 2016 market script we discussed yesterday, and polls have shown some signs of tightening up in some battleground states. Will there be another Election night surprise this Election Cycle? Stay tuned. Economic data is on the light side today, but there’s a steady pace of earnings after the close.
Be sure to check out today’s Morning Lineup for a rundown of the latest stock-specific news of note, market performance in the US and Europe, key earnings data from the US and Europe, trends related to the COVID-19 outbreak, and much more.

Former North Carolina senator and presidential candidate John Edwards made the theme of ‘Two Americas’ popular in 2004 and 2008 in terms of the United States increasingly becoming a country of haves and have nots. Within the equity market as well, we also see the theme of ‘two markets’ playing out. Starting with the S&P 500, the index bounced off support yesterday after its worst full-week performance leading up to a Presidential election in its history. The S&P 500 already made a lower high in October, so any bounce here that fails to take out the high from October will result in a second lower high.

For the Russell 2000 – an index which heretofore had been underperforming the S&P 500 by a wide margin – the technical picture looks more positive. When the broader market rallied in September and early October, rather than make a lower high, it actually made its second higher high. Then, in the subsequent pullback, it found support at its uptrend off the March lows, making what could turn out to be a higher low. The seemingly constant underperforming Russell 2000 now looks like more of a leader than the S&P 500.

ISM Manufacturing Report and Elections
With the ISM Manufacturing report coming in at the highest level in two years today we wondered whether a strong manufacturing sector ahead of an election has any impact on the results. One would think that surging activity in the Manufacturing sector would be good for a President’s re-election chances. To shed some light on this, the table below shows the election results of each election since 1952 based on which party was in the White House and which party won the election. For each Presidential Election, we also show the level of the October ISM Manufacturing report, its three-month change as well as the distance of the most reading relative to its 52-week range.
Looking at the overall results, we were surprised to find that there’s not that much of a connection between levels of the ISM Manufacturing report before an election and the actual results of the election. Overall, when the party of the President in the Oval in the Oval office stays the same, the median level of the ISM Manufacturing report ahead of the election is 54.1. When the party flips, the median level is modestly lower at 52.0. October’s ISM Manufacturing report was also the third-highest level heading into a Presidential election on record. The only two that were higher were the election of 1972 (67.0) when Nixon defeated McGovern and 1964 (60.7) when Johnson defeated Goldwater, and in both of those elections, the party of the President stayed the same.
Additionally, when the party in control stays the same, the ISM Manufacturing report has been slightly closer to a 52-week high (-4.2) than it has when the parties flip (-5.4). However, the only two times that the ISM Manufacturing report was at a 52-week high leading up to the election were in 1972 and 1980. In 1972, Nixon was re-elected, but in 1980 President Carter lost his re-election bid despite the ISM Manufacturing report being at a 52-week high, and the three-month change was the strongest of any other election since 1952.
While those two metrics would suggest a slight case for a strong ISM Manufacturing report helping the party in power, the median three-month change has actually been worse when the party of the President stays the same (-0.7) versus when there is a change (-0.5). Click here to view Bespoke’s premium membership options for instant access to our research and interactive tools.

Manufacturing Employment Finally Expands
Both Markit and ISM’s readings on the manufacturing sector exceeded expectations this morning indicating that the sector of the economy continued to grow at an accelerated pace in October. In regards to the ISM report, the headline number rose to 59.3 after falling to 55.4 last month. The index is now at its highest level since September of 2018.
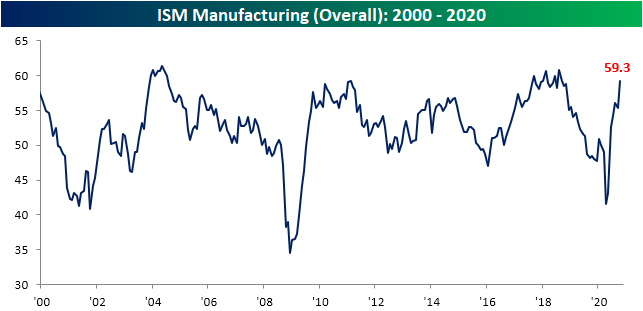
Commentary from respondents is backing up the strong showing of the headline number. The bulk of comments made mention that demand has continued to improve with some companies saying that conditions are almost back to or even better than pre-COVID levels.

Looking across the various categories of the report, breadth was very strong with all but one index rising month over month. That index that moved lower was for Customer Inventories which has fallen deeper into contraction. On the other hand, the indices for Business Inventories and Employment exited contractionary territory with significant increases this month; both MoM increases around the top 10% of readings. Elsewhere in the report, demand is very strong with New Orders, Backlog Orders, and Export Orders all heading higher. Meanwhile, as businesses ramp up production to meet that demand, Imports, Production, and Employment also improved. That has also led prices to rise while supply chains still are showing some signs of stress as lead times remain elevated as seen through the Supplier Deliveries index.

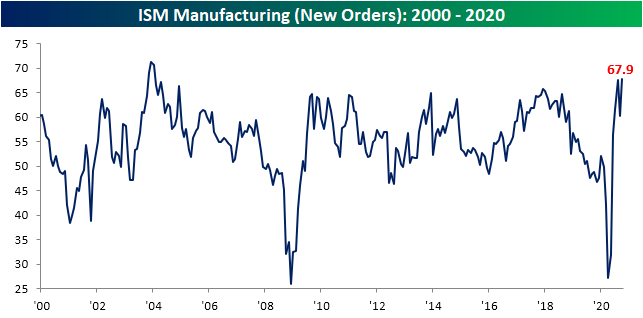
As noted in the comments section, many businesses have reported that demand has been very healthy. The index for New Orders is consistent with this. After pulling back in September, the index rose past the August high of 67.6 in October. At 67.9, the New Orders index is at its highest level since late 2003/early 2004 and the 7.7 point month over month increase was in the top 5% of all monthly moves. As new orders expand at a rapid pace, backlogs have been on the rise as well. The index of Backlog Orders rose to 55.7 from 55.2; the highest level in two years.

That strong demand has been taking its toll on inventories over the past few months. After three straight months of contraction in inventories, October saw inventories expand for the first time as the index rose to 51.9 from 47.1 in September. That is the highest level since April of last year. The improvement in business inventories indicates some normalization for supply chains that are seeking to match historically strong demand.
Meanwhile, the index for Customer Inventories, which tracks whether inventories are too high, too low, or just right, fell to 36.7 in October versus 37.9 in September. At its lowest level in a little more than a decade, around a third of respondents are reporting that customer inventories are still too low. In other words, inventories are finally beginning to build but still have a ways to go to meet demand.


Taking the spread of New Orders and Customer Inventories, there have only been two other months in the past two decades (December of 2003 and December of 2009) in which the spread was higher. That means that new orders continue to rise much faster than inventory levels which will be a tailwind for production in the future.

One of the most promising areas of the October report was that for the first time since July of 2019, the index for Employment rose above 50, meaning there was finally net hiring. That rise in employment is surely on account of rising production to meet the surging demand. Click here to view Bespoke’s premium membership options for our best research available.

Triggered Americans
After three months of declines, gun background checks in the United States rose again in October, rising from 2.892 million up to 3.305 million. That’s the highest monthly reading since July as the wave of civil unrest started to abate. While off the highs seen earlier this year, October’s number of background checks was the fifth-highest monthly total on record and higher than all but one monthly reading prior to 2000. Just to illustrate how much of a surge we have seen in background checks for firearms this year, the chart below shows the total number of background checks in the first ten months of each year since 2000. At the current total of 32.1 million, total background checks are dwarfing every other year on record. This year’s total number of background checks is already higher than any full-year total since 2000, and even September’s YTD total of 28.8 million would have surpassed every other prior year on record.
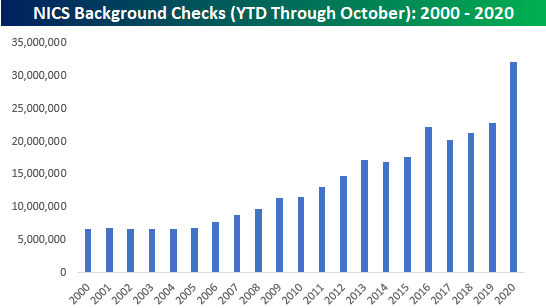
Not only is this year’s increase in background checks the highest on record, but the y/y increase in this year’s first ten months relative to last year is also the largest increase on record. Prior to 2020, the largest y/y change over the first ten months of the year was 2016’s increase of 26.3%. This year, though, background checks are up by over 40%! We’ve seen a number of statistics this year showing that uncertainty on the part of Americans towards the economy and country, in general, is at record highs, and the increase in the number of Americans purchasing firearms is just another real-life example. Click here to view Bespoke’s premium membership options and unlock full access to our research and interactive tools.

Bespoke Market Calendar — November 2020
Please click the image below to view our November 2020 market calendar. This calendar includes the S&P 500’s average percentage change and average intraday chart pattern for each trading day during the upcoming month. It also includes market holidays and options expiration dates plus the dates of key economic indicator releases. Start a two-week free trial to one of Bespoke’s three research levels.
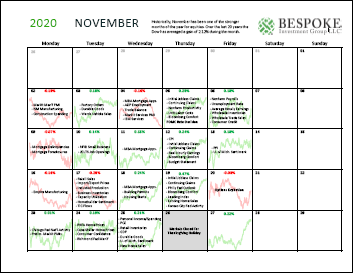
Chart of the Day: Monday Gaps Up of 1%+
Bespoke’s Morning Lineup – 11/2/20 – Dusting Off the 2016 Script
See what’s driving market performance around the world in today’s Morning Lineup. Bespoke’s Morning Lineup is the best way to start your trading day. Read it now by starting a two-week free trial to Bespoke Premium. CLICK HERE to learn more and start your free trial.
“The whole framework of the presidency is getting out of hand. It’s come to the point where you almost can’t run unless you can cause people to salivate and whip on each other with big sticks. You almost have to be a rock star to get the kind of fever you need to survive in American politics.” – Hunter S. Thompson, Fear and Loathing on the Campaign Trail ’72
After the worst last full week of trading heading into a Presidential election in more than half a century, futures are trading significantly higher this morning as Election Day is less than 24 hours away. That’s a pretty good description of the market this morning, but surprisingly enough, it’s also the exact same thing you could have said four years ago on the Monday morning heading into Election Day 2016. Back then, the S&P 500 was down 2% in the last full week of trading heading into Election Day and rallied sharply in the two days heading into the election results on November 8th.
This election cycle, the S&P 500 is once again indicated to open up over 1% following what was the worst ever last full week of trading for the S&P 500 heading into an election. Will history continue to repeat itself over the next 36 to 48 hours? About half of the population really hopes it does, while the other half really hopes it doesn’t. Regardless of the outcome, hopefully, we’ll know the answer tomorrow night…or Wednesday…or this weekend…or at least the end of the year!
Be sure to check out today’s Morning Lineup for a rundown of the latest stock-specific news of note, market performance in the US and Europe, key earnings data from the US and Europe, economic data, trends related to the COVID-19 outbreak, and much more.
For the sake of comparison, we wanted to see how close 2016 and 2020 really have been to each other, so in the chart below we compare the S&P 500 in the year leading up to the last Friday before Election 2016 and now. 2020 is plotted on the left axis, while 2016 is on the right axis. One major difference between the two periods is the level of volatility. In 2016, the S&P 500 ‘only’ fell about 15% from its peak earlier in the year, while this year we saw a decline of more than 30%. But once you get past the differences between the size of the moves, there are some similarities in the patterns. In both cases, the S&P 500 bottomed from a significant decline in Q1, rallied sharply until late Spring, pulled back in June, and then rallied for the remainder of the Summer. In both years, once election season rolled around in September, the market pulled back right up through the Friday before Election Day. As the saying goes, history does not repeat itself but it often rhymes.

Bespoke Brunch Reads: 11/1/20
Welcome to Bespoke Brunch Reads — a linkfest of the favorite things we read over the past week. The links are mostly market related, but there are some other interesting subjects covered as well. We hope you enjoy the food for thought as a supplement to the research we provide you during the week.
While you’re here, join Bespoke Premium with a 30-day free trial!
Voting
How Long Will Vote Counting Take? Estimates and Deadlines in All 50 States by Alicia Parlapiano (NYT)
A helpful reference for the time it will take for states across the country to total up votes cast early and on election day amidst very high turnout and a pandemic in 2020. [Link; soft paywall]
Inside Decades of Nepotism and Bungling at the N.Y.C. Elections Board by Brian M. Rosenthal and Michael Rothfeld (NYT)
Some background on why New York City is one of the worst places in the country to vote, plagued by inefficiency and lines that other parts of the country wouldn’t tolerate. [Link; soft paywall]
Politics Gets Weird
Quiz: Can You Tell a ‘Trump’ Fridge From a ‘Biden’ Fridge? by John Keefe (NYT)
A fascinating if completely haphazard insight into voters’ mindsets, including both analysis and the enjoyable and mystifying game of guessing which is which. [Link; soft paywall]
They’re Afraid. They’re Buying Guns. But They’re Not Voting for Trump. by Ciara O’Rourke (Politico)
Democrats in deep blue parts of Texas are buying guns and getting trained to use them in the midst of a turbulent election season that has exposed all kinds of anxieties. [Link]
COVID
A room, a bar and a classroom: how the coronavirus is spread through the air by Heather Galloway (El País)
A fascinating piece of journalism that is very helpful in explaining how various mitigations can reduce risk of COVID spread indoors. [Link]
COVID & Humidity by olfadreyer (Github)
Humidity is one major factor in how much of the SARS-COV-2 virus builds up in the air. This project seeks to illustrate how lower humidity can drive more airborne viral load. [Link]
A large national outbreak of COVID-19 linked to air travel, Ireland, summer 2020 separator commenting unavailable by Murphy et al (Euro Surveillance)
Using detailed contact tracing, this study seeks to identify the COVID risk associated with air travel, despite low passenger loads and mask wearing. Bottom line: masks and lots of space between passengers still led to lots of cases. [Link]
COVID Lifestyle
With No Commute, Americans Simply Worked More During Coronavirus by Jo Craven McGinty (WSJ)
Less time commuting led to a lot more time working and doing chores per survey data, with primary jobs taking up 35% of the additional time. [Link; paywall]
Chewy launches virtual vet visits as pandemic fuels pet boom by Melissa Repko (CNBC)
With telemedicine taking off for humans, it probably shouldn’t be a big surprise that furry friends are also getting veterinary attention over the internet. [Link]
Need a Pandemic Puppy ASAP? Call the Bernedoodle Delivery People by Michael M. Phillips (WSJ)
High demand for companionship during the pandemic has led to a boom in long-distance doggy deliveries, with specialists keeping an eye on pups flying commercially across the country. [Link; paywall]
Algos Gone Wild
Virtual Influencers Make Real Money While Covid Locks Down Human Stars by Thuy Ong (Bloomberg)
Social media accounts for non-human characters are gaining popularity, with hundreds of thousands of followers eagerly awaiting photos created in photoshop. [Link; soft paywall]
How an Algorithm Blocked Kidney Transplants to Black Patients by Tom Simonite (Wired)
A widely-used algorithm makes adjustments that assign healthier scores to Black kidney patients holding other factors equal; the result is less intensive care for more seriously ill Black people. [Link; soft paywall]
Games
The baseball card market is thriving thanks to COVID-19 by Paula Froelich (NYP)
Prices for rare baseball cards are exploding as investors enter the market as well as the same enthusiasts which have kept the market alive for so many years. [Link]
Hasbro revenue slips on production delays in movies, TV shows, shares fall by Uday Sampath Kumar (Reuters)
While Hasbro is seeing massive demand for board games, the shutdown of filming of movies and TV tied to its intellectual property have hurt revenues badly. [Link; auto-playing video]
Harley-Davidson officially spins off new electric bicycle company with stunning first model by Micah Toll (Electrek)
While Harley is known for its internal combustion engines, a new unit spun out of its skunkworks is dedicated to building electric bikes and the initial teaser is mouth-watering. [Link]
Big Names
David Einhorn Says Tech Stocks Are in an ‘Enormous’ Bubble by Hema Parmar and Joshua Fineman (Yahoo!/Bloomberg)
Greenlight Capital’s principal thinks mania in IPOs, concentration in a small number of stocks, and aggressive valuations are all factors cited in the claim. [Link]
Investor Bill Gross accused of blaring ‘Gilligan’s Island’ song on loop to torment neighbor by Laurence Darmiento (LAT)
Billionaire and former PIMCO head Bill Gross allegedly blared the theme song to Gilligan’s Island on a loop as a way to annoy his neighbor amidst a dispute over a statue. [Link]
Read Bespoke’s most actionable market research by joining Bespoke Premium today! Get started here.
Have a great weekend!
The Bespoke Report – Trick or T(h)reat
Talk about a Halloween scare. In a week where the S&P 500 has historically risen 1%, it traded down more than 5% which was its worst one-week performance since the COVID crisis. Even more notable was the fact that it was the worst performance for the S&P 500 in the last full week before a Presidential election on record. At the close on Friday, the S&P 500’s week-to-date decline was nearly twice the decline of the second-worst week in 1932 when the S&P dropped 2.96% in the last full week leading up to the 1932 election of FDR!
It was a very busy week for the market with a traffic jam of worries to contend with. In this week’s Bespoke Report, we give a full recap of everything going on this week and what it means going forward.
This week’s Bespoke Report newsletter is now available for members.

To read this week’s report and access everything else Bespoke’s research platform has to offer, start a two-week free trial to one of our three membership levels. You won’t be disappointed!

Country Stock Market Performance — Average Country Down 12% YTD
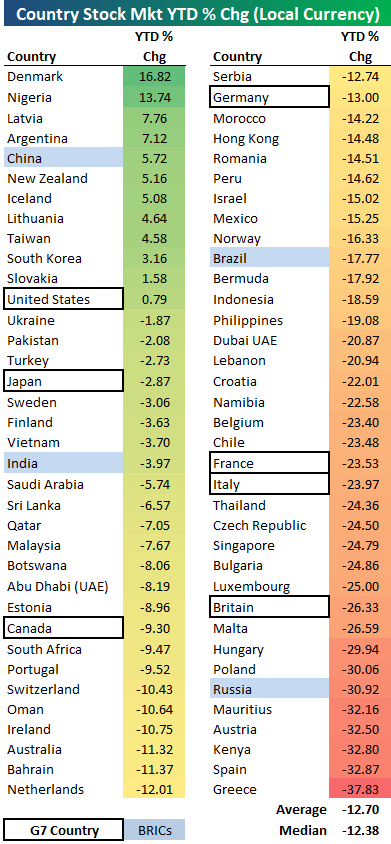
Equity markets around the globe had been hanging in there up until early September, but since then we’ve seen a sell-off that has left global equity indices down quite a bit year-to-date. Below is a table showing the year-to-date performance (in local currency) of major equity indices for 72 countries. As shown, the average country is currently down 12.7% year-to-date, while the median decline is 12.38%. Of the 72 countries, only 12 are currently in the green for the year, while the remaining 60 are in the red.
Denmark’s equity market is currently up the most with a YTD gain of 16.82%, followed by Nigeria at +13.74% and Latvia at 7.76%. China ranks fifth with a gain of 5.72%, while the US (S&P 500) is now just barely hanging on to a YTD gain at +0.79%.
The remaining G7 countries are performing quite a bit worse than the US. While Japan is only off 2.87% on the year, the big European countries like the UK, Italy, and France are all down more than 23%. The UK is down the most in the G7 with a decline of 26.33%.
Of the four BRIC countries, China is doing the best, while India is down 3.97%, Brazil is down 17.77%, and Russia is down 30.92%.
Seven countries are currently down more than 30% year-to-date — Poland, Russia, Mauritius, Austria, Kenya, Spain, and Greece. Greece is currently down more than any other country with a YTD loss of 37.83%. Click here to view Bespoke’s premium membership options for our best research available.