Chart of the Day – Consumer Staples Elevated Price and P/Es
Bespoke’s Morning Lineup – 4/26/23 – The More Things Change…
See what’s driving market performance around the world in today’s Morning Lineup. Bespoke’s Morning Lineup is the best way to start your trading day. Read it now by starting a two-week trial to Bespoke Premium. CLICK HERE to learn more and start your trial.
“Unlike some governments which fear change and fear the future, China is beginning to reach out toward new horizons, and we salute your courage.” -Ronald Reagan 4/27/1984

Below is a snippet of content from today’s Morning Lineup for Bespoke Premium members. Start a two-week trial to Bespoke Premium now to access the full report.
Times have really changed in the last 39 years. In 1984, when President Reagan became the third US President, after Nixon and Ford, to visit China, it was a much smaller player on the global economic stage. According to the World Bank, Chinese GDP per capita was $250.7 in 1984, compared to $17,121.2 in the US. Through 2021 (the latest available data), GDP per capita in the US has increased by over 300% to $70,248, which sounds impressive at face value. However, in China, the same figure has grown by 4,900% to $12,556 per capita. US GDP per capita is still much larger than it is in China, but the gap has narrowed immensely, and China is on a much more equal footing with the US than it was then.
What’s also changed in the last 39 years is the relationship between the US and China. Reagan’s visit was a major diplomatic event where he was greeted with a 21-gun salute in Tiananmen Square. Today, it’s hard to imagine a US President even considering a visit to China, as diplomatic relations between the two countries have mostly frozen over. If there’s one bipartisan issue in Washington right now, it’s that China is an enemy rather than a friend.
One thing that hasn’t changed between now and 1984 is the issue of Taiwan’s independence, one of the primary reasons for the now icy relationship. During President Reagan’s visit in 1984, Chinese Premier Zhao noted in a news conference with reporters that “The question of Taiwan remains the major obstacle to stable, sustained development of Sino-U.S. relations”. The more things change…
Moving on to the markets this morning, futures are trading modestly higher as concerns over First Republic (FRC) get pushed back, and positive earnings from several companies, most notably Microsoft (MSFT), drive positive sentiment. Given the concerns over the banking sector and the debt limit, Treasuries are at the short end of the curve. Speaking of how the more things change, the more they stay the same, just as MSFT is trading at 52-week highs, the company finds itself in regulatory crosshairs on antitrust concerns. This time it’s the proposed acquisition of Activision (ATVI) which the UK CMA has blocked citing risks to innovation in cloud gaming. Is this the 2020s or the late 1990s?
Looking ahead, as the FOMC appears almost certain to hike rates another 25 basis points (bps) next week, even as risks of a recession increase, the spread between short and long-term US Treasuries yields continues to widen. As of yesterday’s close, the 10-year vs. 3-month yield curve, the Federal Reserve’s preferred measure of the yield curve as an indicator of a recession, was inverted by 164 bps, which is the most extreme reading since the early 1980s. Every other time in the last 60 years that it inverted by as much or more, the economy was either right on the cusp of or already in a recession.

Even more extreme than the actual level of the yield curve is the pace at which it has flattened/inverted over the last year. As shown in the chart below, the 367 bps pace at which the yield curve has flattened over the last year is the most extreme since just before the onset of the second dip of the double-dip recession in May 1981. Besides that, the only other time that the curve flattened by as much was in 1973, just months before the onset of a recession lasting nearly a year and a half.

Our Morning Lineup keeps readers on top of earnings data, economic news, global headlines, and market internals. We’re biased (of course!), but we think it’s the best and most helpful pre-market report in existence!
Start a two-week trial to Bespoke Premium to read today’s full Morning Lineup.
S&P 500 Futures Historically Shorted
As we do each Monday, in last night’s Closer we highlighted the latest futures positioning data from last Friday’s release of the CFTC’s Commitments of Traders report. Of all assets, perhaps the most striking number was in S&P 500 futures. In data as of last Tuesday, a net 15.11% of open interest among speculators was positioned short. That marked the most bearish positioning for this class of investors since September 2007. Prior to that, there have been relatively few instances of speculator positioning exceeding 15% net short. Most of those occurred in the late 1990s and early 2000s when positioning readings were far more volatile on account of open interest being much smaller than it is today. With that being said, we would also note that open interest has been trending lower in the past few years with recent readings being some of the lowest since 2008 on a 52-week moving average basis.
Make sure to check out tonight’s Closer, where we provide an analysis of the performance of the S&P 500 following other historically net short readings.

Have you tried Bespoke All Access yet?
Bespoke’s All Access research package is quick-hitting, actionable, and easily digestible. Bespoke’s unique data points and analysis help investors better visualize underlying market trends to ultimately make more informed investment decisions.
Our daily research consists of a pre-market note, a post-market note, and our Chart of the Day. These three daily reports are supplemented with additional research pieces covering ETFs and asset allocation trends, global macro analysis, earnings and conference call analysis, market breadth and internals, economic indicator databases, growth and dividend income stock baskets, and unique interactive trading tools.
Click here to sign up for a one-month trial to Bespoke All Access, or you can read even more about Bespoke All Access here.

Fed Days Flipping Script
The FOMC blackout period is now underway meaning there will be no communications from FOMC members until the day of the May meeting. As we detailed yesterday, performance outside of and during blackout periods has been pretty weak during the current roughly year-long tightening cycle. However, things have been improving more recently. As for Fed days themselves, the opposite has been true.
In the chart below, we show the performance of the S&P 500 on the day of FOMC rate decisions going back to 1994. Earlier in the current tightening cycle, Fed days offered the market a brief respite from selling. In fact, some of the strongest Fed days (in terms of S&P 500 performance) of the past few decades occurred last year as the rolling 10-meeting average hit a more than decade-long high in July. With that being said, that average has been rolling over with weaker reactions to the FOMC in the past few meetings. In other words, to some extent, S&P 500 performance during and outside of blackout periods and on Fed days has begun to flip the script in the past few FOMC meetings.

Have you tried Bespoke All Access yet?
Bespoke’s All Access research package is quick-hitting, actionable, and easily digestible. Bespoke’s unique data points and analysis help investors better visualize underlying market trends to ultimately make more informed investment decisions.
Our daily research consists of a pre-market note, a post-market note, and our Chart of the Day. These three daily reports are supplemented with additional research pieces covering ETFs and asset allocation trends, global macro analysis, earnings and conference call analysis, market breadth and internals, economic indicator databases, growth and dividend income stock baskets, and unique interactive trading tools.
Click here to sign up for a one-month trial to Bespoke All Access, or you can read even more about Bespoke All Access here.
B.I.G. Tips – “Buy the Dip” and “Day After” Trends
Discover the fascinating world of “buy the dip” investing and its rollercoaster journey through the years in our newest in-depth analysis. This BIG Tips report delves into the historical action of the S&P 500 tracking ETF (SPY) after up days versus down days and reveals some surprising findings that have shaped the market since 1993. Subscribe to Bespoke Premium now to access the full report!
Chart of the Day – 4/25/23 – Sour Sixteen
Bespoke’s Morning Lineup – 4/25/23 – Earnings Season Kicks Into Gear
See what’s driving market performance around the world in today’s Morning Lineup. Bespoke’s Morning Lineup is the best way to start your trading day. Read it now by starting a two-week trial to Bespoke Premium. CLICK HERE to learn more and start your trial.
“I don’t think people understand there’s 100% correlation with what happens to a company’s earnings over several years and what happens to the stock.” – Peter Lynch
Below is a snippet of content from today’s Morning Lineup for Bespoke Premium members. Start a two-week trial to Bespoke Premium now to access the full report.
After a slow start, earnings season has picked up pace with around 60 US companies reporting results this morning. These companies have combined sales of $350 billion, and the results have been very positive. The EPS beat rate is at 77%, while the revenue beat rate is still high at 73%. Additionally, only two companies have lowered their guidance, while five companies have raised theirs. It’s only one morning of results, but does this look anything like an earning collapse?
Despite this positive news, futures are lower, although not by a significant amount. Treasury yields have also decreased by 5 basis points or more across the curve. In the commodities space, crude, gold, and copper are all trading lower.
Even when you consider its volatile nature, bitcoin has had a notably strong six months, with its price almost doubling off the lows from last fall. The bulk of this rally occurred in the final months of 2022 and the first four months of 2023. However, there has been a moderate pullback in the last two weeks, as the rally lost momentum just as it was testing the 30,000 level. Over the past few days, bitcoin has been testing its 50-day moving average, which has held for now. If you are involved in crypto, it’s essential to watch this key level (~27,200).

Although bitcoin and the crypto space have little to do with the stock market, some traders monitor the space on the belief that they provide a good barometer of overall risk appetite. Trend changes in Bitcoin eventually bleed through to the equity market. Comparing the performance of the S&P 500 to the relative strength of Bitcoin versus the S&P 500 shows a loose but unconvincing link between the two series. The ratio of Bitcoin to the S&P 500 peaked about two months before the S&P 500’s peak in late 2021/early 2022. However, when the S&P 500 hit its recent low in October, it took another two months before the relative strength of Bitcoin began to pick up steam. Rather than leading moves in the stock market, shifts in the relative strength of Bitcoin tend to coincide with shifts in the S&P 500.

Our Morning Lineup keeps readers on top of earnings data, economic news, global headlines, and market internals. We’re biased (of course!), but we think it’s the best and most helpful pre-market report in existence!
Start a two-week trial to Bespoke Premium to read today’s full Morning Lineup.
Chart of the Day – Sell in May? It’s Complicated
Fed Blackout Begins
Saturday began the FOMC’s blackout period meaning there will be no communication from Fed officials for the next several days until the May 3rd meeting (Hooray). As of Monday afternoon, the CME’s FedWatch Tool is pricing in a nearly 90% chance of a 25 bps hike at that meeting.
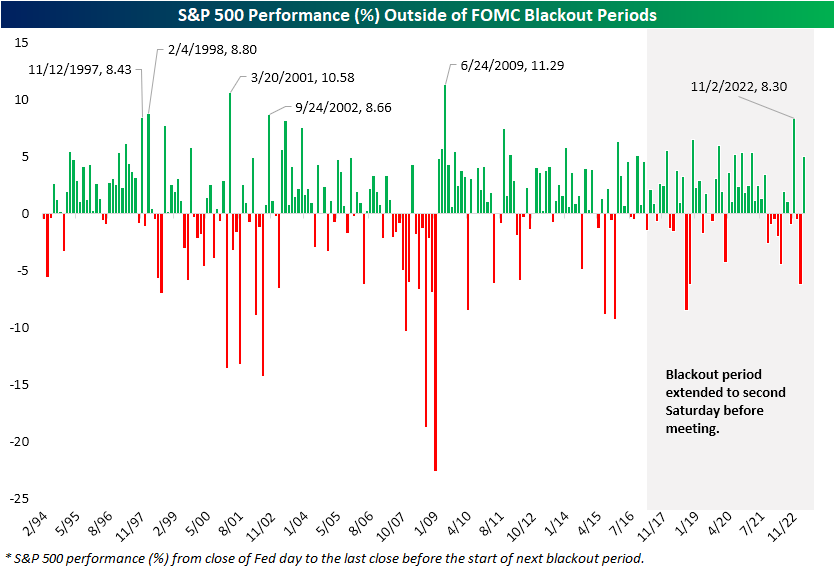
In the chart below, we show the performance of the S&P 500 from the end of a Fed day until the start of the blackout period for each inter-meeting period since 1994 when the FOMC began announcing its rate decisions on the same day as the meetings. Since the current tightening cycle began a little over a year ago, most periods between meetings and blackouts have seen the S&P 500 turn lower with a median decline of 0.53%. One notable exception to that weakness was after the meeting last November when the S&P 500 went on to rally over 8% leading up to the blackout period. That was the strongest run for the S&P 500 from meeting to blackout since June 2009. As for more recently, the 5% gain from the March meeting through last Friday again stands out ranking as the second strongest of the current tightening cycle (out of ten).
In the chart below, we show the performance from the start of each past blackout period up through the last close prior to the FOMC meeting. Again, the current tightening cycle has tended toward weak performance for the S&P 500 with more declines than gains. However, the last blackout period in March saw the strongest gain for the S&P 500 since the runup to the June 2020 meeting.

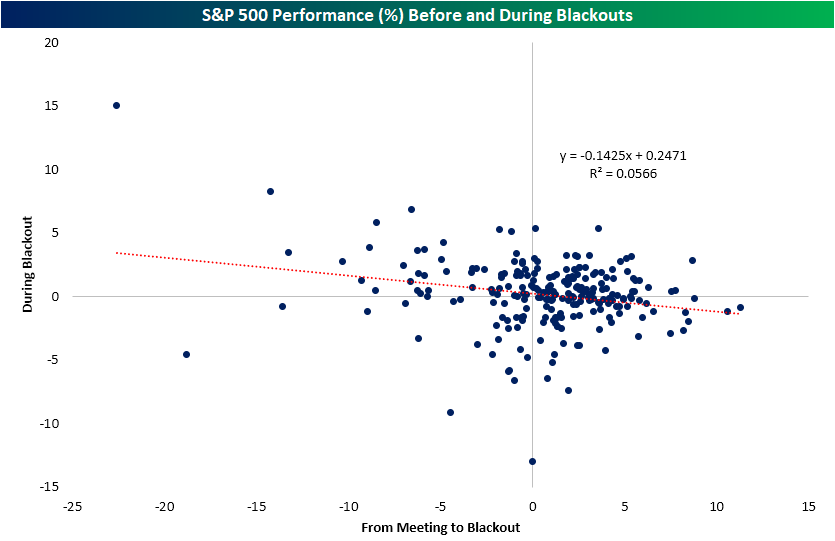
Although there has been some strength during and leading up to blackout periods more recently (especially relative to earlier this tightening cycle), over the full history of the data, strong performance ahead of the blackout period is not a good explainer of performance during the blackout period itself. As shown below, there has historically been a wide dispersion of results without much in the way of a trend. In other words, the strong performance headed into the blackout period in and of itself does not mean it will continue as Fed speakers go quiet.
Have you tried Bespoke All Access yet?
Bespoke’s All Access research package is quick-hitting, actionable, and easily digestible. Bespoke’s unique data points and analysis help investors better visualize underlying market trends to ultimately make more informed investment decisions.
Our daily research consists of a pre-market note, a post-market note, and our Chart of the Day. These three daily reports are supplemented with additional research pieces covering ETFs and asset allocation trends, global macro analysis, earnings and conference call analysis, market breadth and internals, economic indicator databases, growth and dividend income stock baskets, and unique interactive trading tools.
Click here to sign up for a one-month trial to Bespoke All Access, or you can read even more about Bespoke All Access here.
Bespoke’s Morning Lineup – 4/24/23 – Earnings On Deck
See what’s driving market performance around the world in today’s Morning Lineup. Bespoke’s Morning Lineup is the best way to start your trading day. Read it now by starting a two-week trial to Bespoke Premium. CLICK HERE to learn more and start your trial.
“It is not enough that we do our best; sometimes we must do what is required.” – Winston Churchill
Below is a snippet of content from today’s Morning Lineup for Bespoke Premium members. Start a two-week trial to Bespoke Premium now to access the full report.
In what is sure to be a very active week with respect to earnings, it’s starting off on a very quiet note as equity futures are little change and trading just barely below the flatline. Outside of Japan, which finished the session modestly higher, Asian stocks started the week on a negative note while most European benchmarks are little changed with a slight positive bias. In the Treasury market, yields are lower. On the economic calendar today, the only two reports are the Chicago Fed National Activity Index at 8:30 AM and the Dallas Fed Manufacturing report at 10:30.
In last weekend’s Bespoke Report, we highlighted the massive outperformance of European stocks relative to the US since the October lows. While Europe may be outperforming the US, it hasn’t been a global trend. The snapshot below from our Trend Analyzer shows the performance of international regional equity markets and where they finished last week relative to their trading ranges. Right at the top of the list are three ETFs whose focus is on Europe. They were among the best-performing international ETFs last week, the best performers YTD, and are all the most extended relative to their trading ranges.
Europe may have been higher last week, but Emerging Markets sold off. As shown at the bottom of the list, ETFs associated with Emerging Markets and Latin America were all at the bottom of the list and declined more than 1.5% last week. They are also some of the worst performers YTD and among the only ETFs in the group that aren’t overbought relative to their short-term trading ranges. The hardest hit on the week was Latin America where Chile’s proposed nationalization of its lithium industry hasn’t helped investor sentiment towards that area of the world.

The MSCI Emerging Markets ETF (EEM) has been in pretty much of a sideways trading range all year, but the technical picture is leaning more negative than positive. While EEM finished off its lows on Friday, it closed below its 50-day moving average (DMA) and has now seen both a lower low and a lower high.

Our Morning Lineup keeps readers on top of earnings data, economic news, global headlines, and market internals. We’re biased (of course!), but we think it’s the best and most helpful pre-market report in existence!
Start a two-week trial to Bespoke Premium to read today’s full Morning Lineup.