The Triple Play Report — 12/1/23
An earnings triple play is a stock that reports earnings and manages to 1) beat analyst EPS estimates, 2) beat analyst sales estimates, and 3) raise forward guidance. You can read more about “triple plays” at Investopedia.com where they’ve given Bespoke credit for popularizing the term. We like triple plays as an indication that a company’s business is firing on all cylinders, with better-than-expected results and an improving outlook. A triple play is indicative of positive “fundamental momentum” instead of pure fundamentals, and there are always plenty of names with both high and low valuations on our quarterly list.
Bespoke’s Triple Play Report highlights companies that have recently reported earnings triple plays, and it features commentary from management on triple-play conference calls, company descriptions and analysis, and price charts. Bespoke’s Triple Play Report is available at the Bespoke Institutional level only. You can sign up for Bespoke Institutional now and receive a 14-day trial to read this week’s Triple Play Report, which features 28 new stocks. To sign up, choose either the monthly or annual checkout link below:
Bespoke Institutional – Monthly Payment Plan
Bespoke Institutional – Annual Payment Plan

InterDigital (IDCC) is an example of a company that reported an earnings triple play recently. As shown below, IDCC has been in an uptrend for all of 2023 and is now at a new all-time high. YTD, it’s up 102%. On 11/2, the company’s shares gained 8.6% on earnings, and since then, the stock has rallied another 20.6%.

In our database that goes back to 2003 for the company, IDCC hadn’t had a triple play before November 2023’s earnings report. As a company involved in wireless communication and video technology, the industry landscape is perpetually in evolution. What’s really exciting about IDDC lately is that it became a founding member of Avanci 5G automobile patent licensing platform as the value of 5G to automobile manufacturers increases. In Q3, Mercedes-Benz and BMW were licensed for 5G, for which the royalty rates are double the original 4G. Revenue from connected cars will continue to grow over time according to CEO Liren Chen. Second, IDCC signed a license with Lenovo to cover its HEVC video compression technology. Lastly, the company is beginning to dive into research that will bring 6G to the world. It looks like exciting times for IDCC, and exciting times for many of the companies that also reported Q3 triple plays. You can read more about IDCC and the 27 other triple plays in our newest report by starting a Bespoke Institutional trial today.
Bespoke Investment Group, LLC believes all information contained in these reports to be accurate, but we do not guarantee its accuracy. None of the information in these reports or any opinions expressed constitutes a solicitation of the purchase or sale of any securities or commodities. This is not personalized advice. Investors should do their own research and/or work with an investment professional when making portfolio decisions. As always, past performance of any investment is not a guarantee of future results. Bespoke representatives or clients may have positions in securities discussed or mentioned in its published content.
Bespoke’s Morning Lineup — 12/1/23
See what’s driving market performance around the world in today’s Morning Lineup. Bespoke’s Morning Lineup is the best way to start your trading day. Read it now by starting a two-week trial to Bespoke Premium. CLICK HERE to learn more and start your trial.
“Any customer can have a car painted any color that he wants so long as it is black.” – Henry Ford

Below is a snippet of commentary from today’s Morning Lineup. Start a two-week trial to Bespoke Premium to view the full report.
In its last earnings conference call, Tesla CEO Elon Musk noted that the rollout of the Cybertruck has been “production hell”. During yesterday’s rollout, the sentiment from that conference call was on display when the Tesla website said that the base model of the Cybertruck wouldn’t be available until 2025. Given the complexities involved in manufacturing the Cybertruck with, among other things, its stainless-steel exterior, it shouldn’t come as a surprise that it’s difficult to produce. Still, we found it ironic that the product launch came just one day short of 110 years after Henry Ford unveiled the first moving assembly line for cars and reducing the time it took to complete the build of an entire car from half a day to an hour and a half! And now on to the markets.
The year is now 92% complete, but a lot can happen in the final month. With a gain of 9.1% on a total return basis through the end of November, the S&P 500 had its best month since July 2022 and only its 15th monthly gain of over 9% since the start of 1980. With November’s gain, the S&P 500 is up 13.8% over the last year which is two percentage points better than the one-year average total return of 11.8% dating back to 1928. While the last year was above average, the last two years have been weak. The 1.7% annualized gain would be flat if it wasn’t for the dividends. It’s hard to believe but the S&P 500 closed yesterday just 0.80 points above where it closed exactly two years earlier! After factoring in inflation during that time, investors are staring at an annualized decline of about 5% over the last two years. While the two-year return has been well below the historical annualized average of 10.6%, returns for the last five and ten years have been modestly above average, while the 20-year annualized gain of 9.7% is 1.2 percentage points below the historical average.

Sign up for a two-week trial to Bespoke Premium to continue reading more of today’s macro analysis.
Bear’s Unprecedented Drop
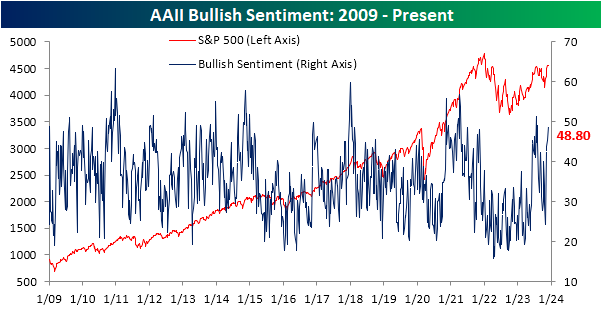
November was a remarkable month for stocks, though equities have stalled out just below prior lows. That has not thwarted investor sentiment though. The latest sentiment survey from the AAII showed 48.8% of investors reported as bullish, up from 45.3% last week. That is now the highest reading on bullish sentiment since the first days of August, and is more than 10 percentage points above the historical average of 37.5%.
While bullish sentiment has not yet moved above its prior highs, the share of respondents reporting as bearish has set a new low. The reading has experienced a dramatic shift having started November above 50%, and fallen all the way down to 19.6% this week. That is the lowest level of bearish sentiment since the first week of 2018!

Perhaps even more impressive is that over 30 percentage point drop in the past four weeks ranks as one of the largest declines on record. Since the start of the survey in 1987, the current four week decline ranks as the fourth largest on record. The last occurrence was all the way back in April 2009.

As a result of the massive drop in bears, the bull-bear spread has risen to 29.2, just shy of the July high of 29.9.

The AAII survey was not alone in having seen a surge in optimism. For example, the Investors Intelligence survey likewise is seeing the strongest bullish sentiment since early August and the NAAIM Exposure Index is at the highest level since late July. Combining these readings into our sentiment composite shows the index is now at 0.95 indicating the average sentiment survey is now almost a full standard deviation above (meaning more bullish than) its historical average.


Chart of the Day – 60/40 Surge
Continuing Claims Brutal Rise Continues
Initial jobless claims experienced a 22K drop last week (after a 2K upward revision this week), the largest one week decline since June 24th. Claims experienced a modest rebound in the most recent print rising back to 218K. At that level, claims are in the middle of the past couple of year’s range which is also historically healthy relative to pre-pandemic readings.

Before seasonal adjustment, claims experienced an unusually large drop back below 200K. That is the first sub-200K print since the end of October. Additionally, it is a record low relative to the comparable week of the year throughout history. While that may sound like a positive, we’d be hesitant to begin shooting off confetti. That drop and low reading are more likely a function of the Thanksgiving holiday, and as shown below, this week’s drop is only a dent to the seasonal rise in claims that is typical for this time of year. In other words, one week does not make a trend.

While the initial claims number is likely not trending in a more positive direction, the concerning climb in continuing claims has pressed on. Seasonally adjusted continuing claims have continued their rapid rise with a week-over-week increase in nine of the last ten weeks. That has resulted in a fresh two-year high of 1.927 million.

Mega-Cap AI Mentions Explode Thanks to NVIDIA
Now that NVIDIA (NVDA) has reported its Q3 numbers (the last of the mega-caps to report), below is an updated look at the number of times “AI” was mentioned during conference calls going back to 2021. The revolutionary ChatGPT app was released in November 2022, and since then, we’ve seen an explosion in “AI” mentions from mega-cap management teams. As shown below, “AI” was mentioned a total of 418 times this quarter across the conference calls of AAPL, AMZN, META, MSFT, GOOGL, and NVDA. The big jump from last quarter’s 350 “AI” mentions was thanks to 154 mentions on NVDA’s call alone!
Apple (AAPL) remains the lone mega-cap that’s hardly discussing “AI” at all on its calls with just nine mentions this quarter. Thus far, Apple has not jumped on the “AI” bandwagon at least when it comes to quarterly earnings conference calls. Amazon (AMZN), on the other hand, has picked up the “AI” pace with 48 mentions this quarter. In Q4 2022 just after ChatGPT’s release, “AI” was mentioned just once on AMZN’s eight prior quarterly calls.
Meta (META) “AI” mentions ticked up even more on its latest call to 71, while Microsoft (MSFT) mentions went the opposite direction and fell from 76 to 61 quarter over quarter. Alphabet (GOOGL) mentions also dipped a bit but remained high at 75, ranking it second behind only NVIDIA for the most number of “AI” mentions in Q3.
The bull market for stocks this year has coincided with a pullback in inflation, but it has also been driven in large part by mega-cap Tech stocks, that, except for AAPL, are now fully on board the AI wave. We’ve asked this question rhetorically several times this year, but once again, where would this market be without ChatGPT?


Bespoke’s Morning Lineup – 11/30/23 – Foiled Again
See what’s driving market performance around the world in today’s Morning Lineup. Bespoke’s Morning Lineup is the best way to start your trading day. Read it now by starting a two-week trial to Bespoke Premium. CLICK HERE to learn more and start your trial.
“It usually takes me two or three days to prepare an impromptu speech.” – Mark Twain
Below is some introductory commentary of today’s Morning Lineup. Start a two-week trial to Bespoke Premium to get full access.
Lower-than-expected inflation data in Europe has stocks around the world in rally mode this morning. Stocks on the other side of the Atlantic are trading higher across the board with the STOXX 600 up 0.5% and just about every country in the region trading higher by about the same amount. Besides the weaker inflation data, employment data out of Germany showed a slightly higher-than-expected level of joblessness.
Here in the US, futures are also higher following positive earnings results from Salesforce (CRM). Looking at the economic calendar, it’s a busy day with jobless claims, Personal Income and Spending, and Core PCE just coming out at 8:30 Eastern. Initial jobless claims were right in line with expectations, but continuing claims were significantly higher than expected. Personal Income and Spending both rose 0.2% which was right in line with forecasts while Core PCE was right inline with expectations. The only other reports left for today are Chicago PMI at 9:45 and Pending Home Sales at 10 AM.
Small-cap stocks outperformed the S&P 500 and other major US averages yesterday, but by the end of the session, investors long waiting for the rally to take hold, left the table with their stomachs still growling. While other major averages have all managed to reclaim both their 50 and 200-day moving averages, the Russell 2000 remains sandwiched between the two above the
50-DMA and below the 200-DMA.
The most frustrating aspect of the last two weeks, though, is that on two separate occasions, the Russell 2000 traded sharply higher early in the session and in the process, broke above its 200-DMA. Both times, though, they sold off more than 1% from their intraday high ending the session back below the 200-DMA. Maybe the third time will be the charm, but for now, there isn’t a US index that has been more frustrating to investors than the Russell 2000. At some point, small caps will break out, and pundits will be out telling everyone that the ‘easy’ money has already been made. But when you hear that, remember that like an impromptu speech by Mark Twain, or anything that looks easy at the surface, a lot of work behind the scenes usually goes into it.

At this point, maybe we’re just delirious, but are those two intraday spikes and subsequent pullbacks starting to look a little like the horns from the old Merrill Lynch bull?

Sign up for a two-week trial to Bespoke Premium to continue reading more of today’s macro analysis.
Chart of the Day: December Seasonals
Bespoke’s Morning Lineup – 11/29/23 – Legend
See what’s driving market performance around the world in today’s Morning Lineup. Bespoke’s Morning Lineup is the best way to start your trading day. Read it now by starting a two-week trial to Bespoke Premium. CLICK HERE to learn more and start your trial.
“Berkshire Hathaway could not have been built to its present status without Charlie’s inspiration, wisdom and participation,” – Warren Buffett
Below is some introductory commentary of today’s Morning Lineup. Start a two-week trial to Bespoke Premium to get full access.
Futures are firmly higher this morning with the S&P 500 indicated to open higher by 50 basis points (bps) as treasury yields continue to decline. It was barely more than a month ago that the yield on the 10-year peaked above 5%, but this morning it’s back below 4.30%. The catalyst for this morning’s rally appears to be positive inflation data out of Europe which has continued the optimism following some dovish Fedspeak yesterday. Economic data this morning has been generally positive as GDP was revised higher and Core PCE was lower than expected.
Whenever a company announces the death of a high-level executive within the organization, the statement always includes some form of boilerplate about how “so and so” was an integral part of the organization, and it wouldn’t be the same without them. In yesterday’s statement from Berkshire Hathaway announcing the death of Charlie Munger, Buffett’s statement that “Berkshire Hathaway could not have been built to its present status without Charlie’s inspiration, wisdom and participation,” may have sounded a lot like those typical platitudes, but in this case it couldn’t have been truer.
In 31 of the 46 years that Munger was at the company, Berkshire Hathaway outperformed the S&P 500. More importantly, though, in the fifteen years that Berkshire underperformed the S&P 500, the average underperformance was 13.2 percentage points whereas in the 31 years that Berkshire outperformed the S&P 500, the average margin of outperformance was 20.9 percentage points. So, not only did Berkshire outperform the S&P 500 more than twice as often as it underperformed, but when it did outperform, the gap was much wider than when it underperformed. The chart below compares the growth of $100 invested in Berkshire Hathaway when Charlie Munger officially joined the firm in 1978 to the growth of $100 invested in the S&P 500 on a total return basis. While $100 invested in the S&P 500 in 1978 is worth $16,527 today, that same $100 invested in Berkshire Hathaway is worth nearly $400,000 today! Not bad for two guys who started out in an Omaha grocery store.

Sign up for a two-week trial to Bespoke Premium to continue reading more of today’s macro analysis.