Bespoke Brunch Reads: 5/3/20
Welcome to Bespoke Brunch Reads — a linkfest of the favorite things we read over the past week. The links are mostly market related, but there are some other interesting subjects covered as well. We hope you enjoy the food for thought as a supplement to the research we provide you during the week.
While you’re here, join Bespoke Premium for 3 months for just $95 with our 2020 Annual Outlook special offer.
Policy Failures
Unemployment filing failures by Ben Zipperer and Elise Gould (EPI)
An analysis of jobless claims data suggests that the extreme volume of new filings is under-reported by as much as 60% thanks to millions of workers who were unable to file or didn’t try to file because of difficulty navigating the system. [Link]
The perils of Hooverism by Ryan Cooper (The Week)
As millions lose their jobs and the unemployment rate soars into the double digits, rhetoric is rapidly shifting from emergency support to brutal austerity, risking the livelihoods and basic security of millions in an incredibly depressing re-run of the initial policy response to the Great Depression almost a century ago. [Link]
Why the US shouldn’t let states go bankrupt by Emily Stewart (Vox)
Many states face very little discretion over budgets when receipts plunge, exacerbating economic downturns with layoffs just when demand is already in its worst shape. [Link]
Thomas Piketty: Willing EU countries should spearhead fiscal union by Jakob Hanke Vela, Marion Solletty and Florian Eder (Politico)
French economist Thomas Piketty argues that joint debt is a necessary evolution of the European Union in response to the COVID-19 crisis. [Link]
Politics
We spent the lockdown sorting American voters into 380,000 distinct groups (The Economist)
Using a national data set, The Economist used demographic buckets to more accurately model state-level outcomes than polls which focus on individual states. [Link; registration required]
The unlikely alliance trying to rescue workplace health insurance by Susannah Luthi (Politico)
As millions of workers are removed from company health insurance plans, Democrats are planning to bail out health care insurers who are losing billions in premiums to the labor market collapse. [Link]
Weird Disruptions
Trucks Are Filling a 6,000 Mile Beijing-to-Berlin Supply Gap by Brian Parkin and William Wilkes (Bloomberg)
With airlines not flying, the cargo space which usually serves for just-in-time delivery capacity between China and Europe is being replaced by a massive cobbled together truck daisy chain stretching across Asia. [Link; soft paywall]
Dirty money piling up in L.A. as coronavirus cripples international money laundering by Matthew Ormseth (LAT)
Cash-based businesses are shuttered thanks to coronavirus, and that’s leading to a major pileup of money that typically gets laundered in the city. [Link; soft paywall]
Liquidity
This is how bad things are for museums: They now have a green light to sell off their art by Sebastian Smee (WaPo)
The powerful cartel which dominates norms in the world of art museums is advising members that selling actually makes sense in the current environment. [Link; soft paywall]
Covid-19 and corporate sector liquidity by Ryan Banerjee, Anamaria Illes, Enisse Kharroubi and José-Maria Serena (BIS)
A BIS analysis of 2019 corporate filings suggests the corporate sector does not have cash on hand adequate to cover interest costs, meaning operating losses thanks to COVID in 2020 require new debt issuance to cover, driving up total leverage from already high levels. [Link; 9 page PDF]
Blowback
U.S. response to virus splinters into acrimony and uncertainty (Thomson Reuters Foundation)
Confusion at the top and a wide range of state-level impacts have turned the national response to COVID-19 into an partisan blame-game that does all but ignore public health best practice. [Link]
The Anti-Mask League: lockdown protests draw parallels to 1918 pandemic by Peter Lawrence Kane (The Guardian)
During the 1918 flu pandemic, strict mask-wearing requirements were met with huge hostility and even outright rebellion in San Francisco, even though they sharply curtailed spread of the disease. [Link]
Viral Effects
People Were Leaving New York City Before the Coronavirus. Now What? by Kate King (WSJ)
High costs and little space as well as plentiful jobs elsewhere were pulling residents out of New York City even before the COVID-19 crisis hit; that slow trickle may become a flood. [Link]
How the Coronavirus Pandemic Has Affected Local Businesses Around the Country by Carl Bialik (Yelp)
Yelp data illustrates the shifting interest of the company’s users over the course of the last six weeks, with some huge new interest to go with plunging activity in a range of sectors. [Link; paywall]
‘It Was Just Too Much’: How Remote Learning Is Breaking Parents by Elizabeth A. Harris (NYT)
Parents used to having their children out of the picture during the work day are having to juggle teaching as well as their jobs and the results are painful. [Link; soft paywall]
Solutions
‘Canine surveillance’: How Labrador retrievers are being trained to sniff out coronavirus cases by Karin Bruilliard (The National Post)
While not all of the potential fixes for the COVID-19 crisis are appealing, it’s hard to come up with a more appealing scenario than an army of friendly canine investigators being used for detection. [Link; auto-playing video]
The Secret Group of Scientists and Billionaires Pushing a Manhattan Project for Covid-19 by Rob Copeland (WSJ)
A secretive group of scientists has come together to argue for unorthodox solutions to the COVID-19 outbreak, including experimental large dose treatments of drugs designed for other diseases, COVID-specific antibody therapies, and vaccines. [Link; paywall]
Schnepf Farms in Queen Creek starts drive-in movies by Brittni Thomason (AZFamily)
An Arizona farm has thrown up a screen and started hosting drive-in movies as a way to make up for missing revenue from weddings and other events. [Link]
Tesla
Tesla Cybertruck’s engineering and design might be genius — here’s why by Sean Szymkowski (Road Show)
By combining panels and frame, Tesla’s pickup design may be able to save massively on costs relative to the traditional approach to auto manufacturing. [Link]
Labor Markets
Amazon, Whole Foods, Instacart Workers Organize a Historic Mass Strike by Lauren Kaori Gurley (Vice)
Gig economy and retail workers are attempting a mass strike and urging customers to boycott companies like Amazon, Instacart, and Target in protest of their handling of the COVID crisis. [Link]
Tech
Virtual rate cut forces Nintendo gamers into riskier assets by Leo Lewis and Robin Wigglesworth (FT)
Popular Nintendo game Animal Crossing has in-game currency and interest rates, and the most recent update slashed the rates paid in order to prevent a hack that allowed abuse of the interest system. [Link]
Wi-Fi is getting its biggest upgrade in 20 years by Jacob Kastrenakes (The Verge)
For the first time since 1989, the FCC is allowing unlicensed use of spectrum that opens up more possibilities for ubiquitous WiFi tech. [Link]
Read Bespoke’s most actionable market research by joining Bespoke Premium today! Get started here.
Have a great weekend!
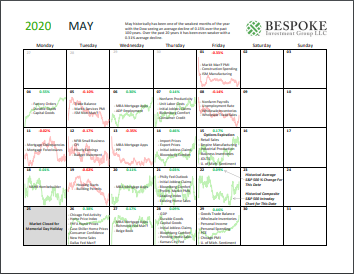
Bespoke Market Calendar — May 2020
Please click the image below to view our May 2020 market calendar. This calendar includes the S&P 500’s average percentage change and average intraday chart pattern for each trading day during the upcoming month. It also includes market holidays and options expiration dates plus the dates of key economic indicator releases. Start a two-week free trial to one of Bespoke’s three research levels.
Bespoke Matrix of Market Indicators
Our Matrix of Economic Indicators is the perfect summary analysis of the US economy. We combine trends across the dozens and dozens of economic indicators in various categories like manufacturing, employment, housing, the consumer, and inflation to provide a directional overview of the economy.
To access our newest Matrix of Economic Indicators, start a two-week free trial to either Bespoke Premium or Bespoke Institutional now!

Post-Covid Earnings Triple Plays
Earnings season continues to chug along, and so far this season there have been a total of 18 triple plays. Triple plays are essentially the cream of the crop on earnings in which a company beats EPS and revenue estimates in addition to raising guidance. Below is a list of the 18 triple plays so far this season along with how their share prices performed on the day they reported the triple play. On average, triple plays have gained 3.7% on their earnings reaction days this season, which is still strong, but it’s slightly less than they’ve normally gained throughout history.
Given the massive changes to the economy due to the coronavirus, one might not expect more cyclical names to report strong quarters but that has not necessarily been the case. The biggest representation has come from the Technology space. Half of the triple plays so far this earnings season have been technology companies. Five of these—Teradyne (TER), Silicon Motion (SIMO), Monolithic Power (MPWR), M/A Com Tech (MTSI), and NeoPhotonics (NPTN)—are semiconductor names. Additionally, Prologis (PLD) who was the first triple play of earnings season, reported a solid quarter despite the REIT’s business primarily being exposed to logistics and supply chain facilities. Aegion (AEG) and S&P Global (SPGI) from the cyclical Industrial and Financial sectors also reported strong quarters in spite of COVID-19. Other triple plays come from areas of the economy that are more unsurprisingly holding up in the COVID economy including a couple Health Care names—USANA (USNA) and Anthem (ANTM)—and Consumer Staples stocks like Keurig Dr Pepper (KDP). Perhaps the most expected triple play so far this season has come from the cleaning product manufacturer Clorox (CLX). Members can track all of these names using this custom portfolio. Start a two-week free trial to Bespoke Institutional to access our custom portfolios, Earnings Explorer, and much more.

FAANG & MSFT Lead The Charge, But Their Contribution Is Smaller Than You’d Think
With just five companies (Facebook, Amazon, Apple, Alphabet, and Microsoft) accounting for one-fifth of the S&P 500, stocks are pretty top-heavy. The famed FAANGs (FB, AMZN, AAPL, NFLX, GOOGL) plus MSFT account for 22% of the S&P’s market cap and are up an average of 12% YTD.
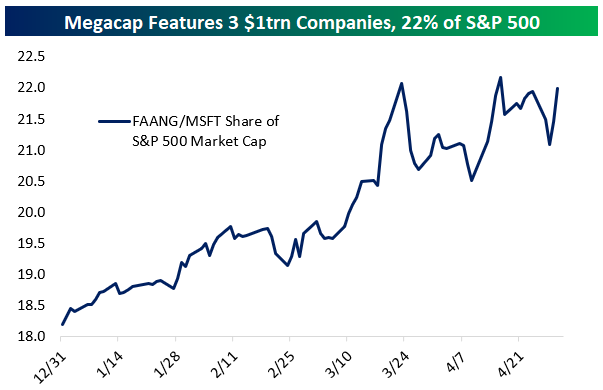
However, that doesn’t mean they’ve actually moved the markets that much. Year-to-date, FAANG+MSFT has added only 1.2% to the total market gain, meaning excluding those names the market would be down 11.2% YTD versus down 10% actuals.

Despite the fact that these names have outperformed the S&P 500 since the 2/19 market highs, their performance has had a positive impact of 1.2 percentage points on the S&P 500. That’s basically just one third of the impact they would have had if they performed inline with the rest of the market. Finally, since March 23rd when equity markets bottomed, these stocks have only added about exactly what you would expect them to based on their market caps: 6.7 percentage points (22%) of the 29.88% leap for the market over that period. In short, the S&P 500 is a very big ship to turn with outperformance, even when 20% of it is concentrated in a few names. Start a two-week free trial to Bespoke Institutional to access our Chart Scanner, custom screens, and much more.

A Look at Big Moves Lower on Earnings for Amazon (AMZN)
Amazon (AMZN) is currently trading down 6% after reporting earnings yesterday evening. While it may seem like a rare move lower for Amazon (AMZN), the fact is that big moves lower on earnings are nothing new for this mega-cap online retail/Tech company. From our Earnings Explorer tool, below is a snapshot of all instances in which AMZN shares opened lower by 5% or more following a quarterly earnings report. Today was the 27th time the stock has experienced a big selloff like this on earnings out of 75 quarterly reports since 2001. That’s 36% of AMZN’s quarterly reports! For some perspective, even though the stock has opened down 5%+ on more than a third of its quarterly releases since 2001, it’s up 25,000% over this entire time period. Start a two-week free trial to Bespoke Institutional to access our Earnings Explorer tool and all of our equity market research.

Since its IPO in 1997, Amazon (AMZN) shares are up 180,000%. Thinking back to its early days as a public company during the Dot Com bubble, AMZN was one of those high-flying Internet stocks of the late 90s that experienced remarkable moves higher on a daily basis. Below is a chart of AMZN during the Dot Com bubble and burst showing a 7,000% rally at its peak in 1999 before giving up nearly all of those gains in a couple of years by 2001.

Amazingly, the Dot Com bubble that was so frothy at the time now barely registers on the chart of Amazon’s performance since its IPO in 1997. What a remarkable run it has been.

Fund Flow Rebound Continues
This week the Investment Company Institute reported fund flows across ETFs and mutual funds for the week ending April 22nd. Below, we summarize flows across a range of periods as well as how those numbers stack up to historical ranges since 2013. The most recent week saw massive flows into commodity ETFs as vehicles like USO saw massive interest from retail investors. Total inflows to commodity ETFs totaled $14bn in the four weeks ended April 22. The current week is a record result. For equities, the week was mostly weak with $9.5bn in overall outflows mostly thanks to $7.9bn in global equity outflows. Bond funds continued to reverse their extreme outflows from March with $9.8bn in inflows across ETF and mutual funds.
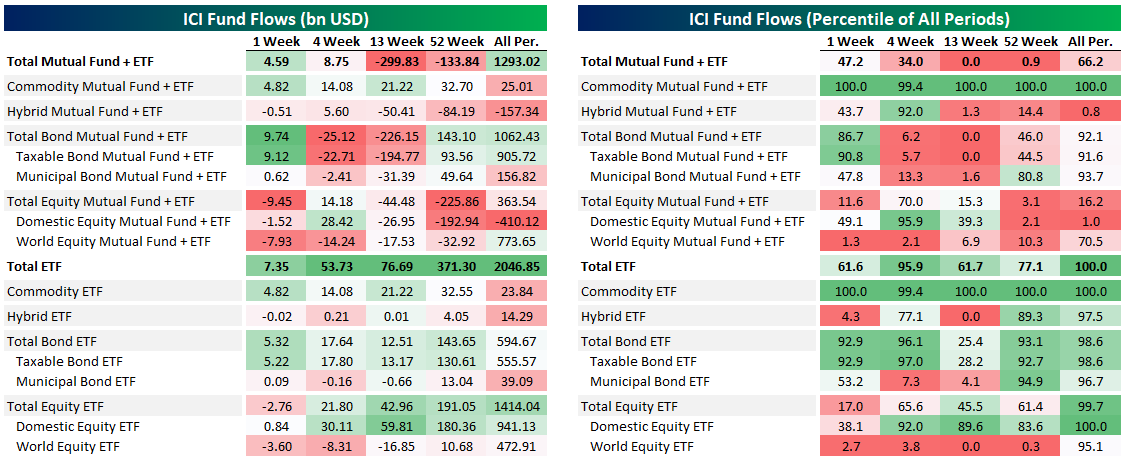
Mid-April saw the aggregate fund universe draw inflows for two straight weeks after massive outflows in March. As we discussed above, the biggest cause for outflows was bond markets, with $306bn leaving the combined ETF and mutual fund universe in six weeks from March 4th to March 8th. Equity flows have been much more muted, as shown in the second chart below. Gain access to Bespoke’s most actionable investment research with a two-week free trial to Bespoke Premium.

10-Day Advance/Decline Lines Running Hot
The gains in the first half of the week lifted every sector but two—Utilities and Financials—above their 50-DMAs. Meanwhile, Health Care had even touched overbought territory (over 1 standard deviation above its 50-day) earlier in the week, making it the first sector to be overbought since late February.
When it comes to another measure we monitor, the 10-day advance/decline line, conditions are more broadly appearing overbought. The 10-day advance/decline line measures the average number of daily advancers minus decliners in an index or sector over the last 10 trading days. Very high readings suggest that things have gotten extended in the very near term and downside mean reversion can be expected. Very low reading suggest the opposite.
The 10-day A/D lines for sectors have been pretty strong recently indicating broad participation in the rally, but this has led these readings to become elevated indicating conditions may be running a bit too hot in the near term. Outside of the defensive sectors like Consumer Staples, Utilities, and Real Estate, every sector’s 10-day A/D line has been in overbought territory at some point over the past week. The same can also be said for the 10-day A/D line for the S&P 500. We’d note, though, that while A/D lines are extended, they’re not at extreme levels seen at other points over the past year. Start a two-week free trial to Bespoke Institutional to access our Sector Snapshot report and much more.

Over 30 Million Initial Jobless Claims Filed
Initial jobless claims fell this week for the fourth week in a row since the record high print of 6.867 million back in the final week of March. Claims came in at 3.839 million which was 588K less than last week but also above estimates of 3.5 million. That brings the total number of initial jobless claims filed over the past six weeks (when there was the first print over 1 million) to over 30 million which is over 9% of the entire US population.

On a non-seasonally adjusted basis, this week was only the third consecutive decline off of the peak of 6.211 million which came one week later than the seasonally adjusted data’s peak. This week’s decline brought jobless claims down to 3.489 million.

Since the huge spike in jobless claims began in late March, the 4-week moving average has risen every single week, except for today. This week, the four week average fell 753.25K down to 5.033 million. As with the other readings, while that is still lower, the moving average remains extremely high compared to the rest of history. Start a two-week free trial to Bespoke Institutional to access our interactive economic indicators monitor and much more.

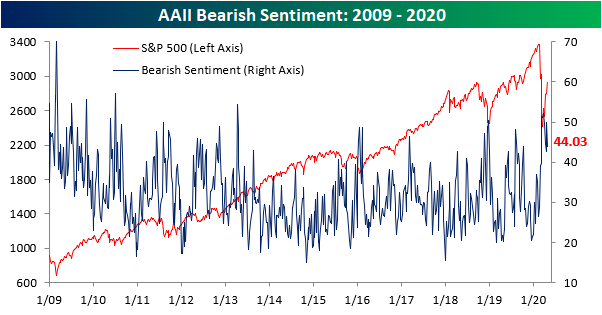
Bulls Crawling Back
The volatile swings in crude oil last week sent investor sentiment sharply lower with only 24.86% of investors reporting as bullish which was the lowest level of bullish sentiment since the COVID-19 outbreak began.. With things calming down in the days since and with equities continuing to grind higher, sentiment has improved as the percentage of investors reporting as bullish rose to 30.6%. While an improvement, that is still less than where bullish sentiment has been over the past several weeks. Since the sell-off began on 2/19, bullish sentiment has averaged 33.44%, around 3 percentage points above current levels.
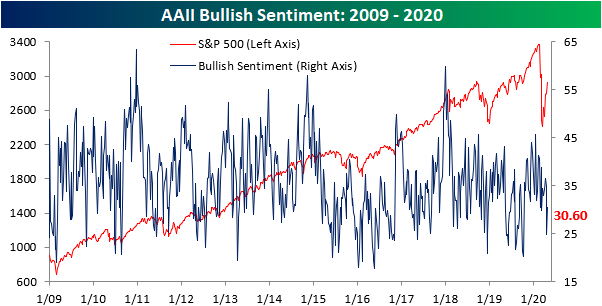
Last week, we noted a strong bearish bias in which the percentage of bearish investors doubled those reporting as bullish. That has subsided this week as bearish sentiment pulled back from 50% to 44.03%. With less than half of investors now negative, bearish sentiment is within one percentage point of its average since the 2/19 peak, 44.83%.
Most of the gains and losses to bulls and bears took from each other as neutral sentiment went little changed. 25.37% of investors reported as neutral which was only 0.23 percentage points more than last week’s reading of 25.14% Start a two-week free trial to Bespoke Institutional to access our interactive economic indicators monitor and much more.
