Empire Strikes Back
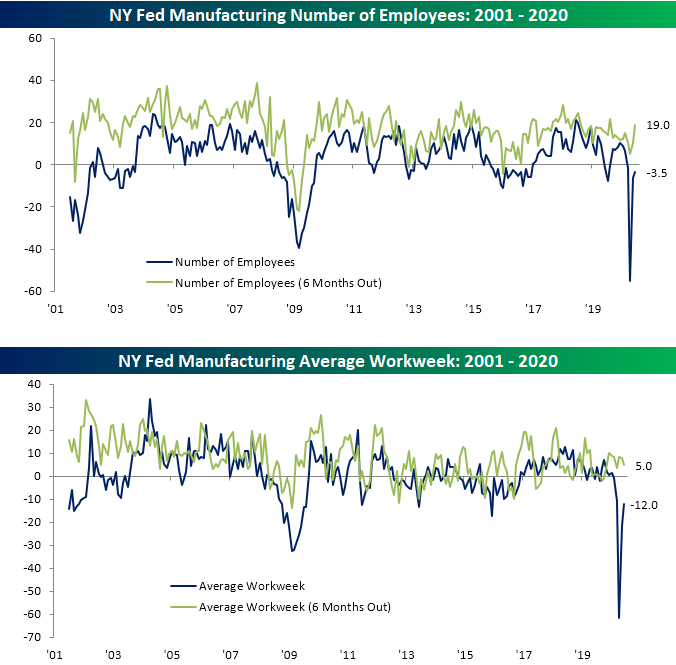
Only a couple of months after the lowest (April) and second-lowest (May) readings ever, the New York Fed’s index on manufacturing activity was expected to improve with forecasts calling for a reading of -29.6. While that would have been a sizeable increase, it still would have resulted in the fifth-lowest reading on record. Instead, the headline number improved by much more coming in at -0.2 this morning. Of the survey’s respondents, 36.1% reported better general business conditions while another 36.3% reported worse conditions. That near-zero reading in the index indicates that activity on net in the region was essentially unchanged compared to last month rather than experience large contractions like the prior two months. That massive rebound likely has reopenings to thank as the survey results were collected between June 2nd and June 9th which coincided with every region in the state including New York City entering at least Phase One of the reopening cycle (allowing manufacturers, construction, and supply chain businesses to resume business). By the collection period, many regions, but not NYC had actually entered Phase Two which allows for an even wider array of activity.
As current conditions are no longer showing extremely weak activity and reopenings give hope of a return to normal, firms turned much more optimistic with the index for conditions six months out ripping higher to 56.5. As recently as March, the index was only at 1.2 which was the weakest reading since February of 2009. Just three months later, the 56.5 reading is the highest since October 2009 when the index was just 0.3 points higher.

With future expectations now elevated and current conditions still somewhat muted, albeit improved, there remains a massive disconnect between how businesses view their present and future situations. As shown below, that spread was at a record high of 85.2 back in April as the index for current conditions was at a record low. It has since fallen down to 56.7 which is still higher than all but six other months in the history of the survey excluding April and May. Prior to the past few months, the last time the spread was at these levels was back in November of 2010.

As shown in the table below, for the individual categories of the report, more than half for current conditions still remain in contraction though they are greatly improved from last month. On the other hand, of the indices for expectations, the only one in contraction in June was the one for inventories. For General Business Conditions, New Orders, and Shipments, the month over month increase in June was the largest on record. While not the biggest ever one-month increases, the indices for the expectations of those same categories, as well as Number of Employees, Capital Expenditure, and Technology spending in addition to current Prices Paid and Average Workweek all saw one-month gains in the 90th percentile or better. Broadly speaking, the readings for this month’s survey seem to indicate that activity has begun to find a footing in June, even if that is at weaker levels, as firms hold a rosier outlook for the future.

Again, one of the stronger aspects of this month’s report was businesses’ reporting optimism for the future. The indices for future plans for Cap-Ex and Technology spending embody this. Although they remain at the low end of their historic ranges even after historically large one-month gains, both indices showed more firms plan to invest rather than disinvest in their businesses.

As previously mentioned, the indices (both current conditions and future expectations) for New Orders and Shipments saw massive moves this month. That indicates demand has firmed (though is perhaps not rising) and is no longer declining at the dramatic rate of the past few months. As with the headline number, the current new orders showed a very slight contraction in June while the index for expectations was at its highest level since August of 2005.
Meanwhile, there was actually a slight pickup in Shipments as the index rose to a positive 3.3. Similar to New Orders, firms’ optimism about the future was one of the bright spots with the index for Shipments six months out rising to 53.1. That is the highest reading since August of 2014.


Employment indicators were actually a bit of a soft spot in this month’s survey. The current indices for Number of Employees and Average Workweek were some of the weakest readings across the various categories albeit they too improved from May. 21.9% of respondents reported a lower level of workers compared to 18.4% that reported an increase in their workforce. Meanwhile, 24.1% reported a shorter workweek while about half of that (12.1%) reported a longer workweek. Click here to view Bespoke’s premium membership options for our best research available.
Bespoke’s Morning Lineup – 6/15/20 – Neutral All Around
See what’s driving market performance around the world in today’s Morning Lineup. Bespoke’s Morning Lineup is the best way to start your trading day. Read it now by starting a two-week free trial to Bespoke Premium. CLICK HERE to learn more and start your free trial.
Ahe week isn’t starting off on a positive note for bulls as the S&P 500 is on pace to open the day with a decline of over 2%. After a 40% rally off the lows, investors are reassessing where the markets stand relative to the pace of economic growth and the potential of a wider outbreak across the country. While equities have come a long way and may have gotten ahead of themselves in terms of short-term fundamentals, trends in the coronavirus outbreak haven’t materially changed in the last few weeks. The only difference is that they have attracted more headlines.
Be sure to check out today’s Morning Lineup for a rundown of the latest stock-specific news of note, moves in overseas markets, economic data out of China, global and national trends related to the COVID-19 outbreak, and much more.

Last week was a nasty one for the major US equity indices. With declines in the range of 8% or more in the small-cap space to a drop of 1.59% for the Nasdaq 100, all of the major index ETFs we track in our Trend Analyzer were down on the week. While the week started out with every index at either overbought or ‘extreme’ overbought levels, by the end, every single one of them besides QQQ finished the week in neutral territory relative to their trading range and neutral in terms of their short-term timing scores. Concerns over an acceleration in the virus outbreak have clearly weighed on sentiment as of late, and how this week plays out will go a long way in determining how the summer is going to play out.

Bespoke Brunch Reads: 6/14/20
Welcome to Bespoke Brunch Reads — a linkfest of the favorite things we read over the past week. The links are mostly market related, but there are some other interesting subjects covered as well. We hope you enjoy the food for thought as a supplement to the research we provide you during the week.
While you’re here, join Bespoke Premium for 3 months for just $95 with our 2020 Annual Outlook special offer.
Policing
Police, Social Order, and Exemplary Violence by Patrick Wyman (Substack)
Historian Patrick Wyman analogizes the current moment of mass protest and social uprising, as well as the police response, to medieval peasant revolts, which featured desires for reform rather than revolution and brutal violent response from the existing power structure. [Link; paywall]
The City That Remade Its Police Department by Sarah Holder (Bloomberg)
Camden, NJ dissolved its police department in 2013 and shifted to a community policing model that increased interactions between police and citizens but made sure they happened more frequently in peaceful and amicable circumstances. [Link; soft paywall]
History
Alfred Winslow Jones by Abraham Thomas (Thread Reader)
The inventor of the modern hedge fund started his career working on a tramp steamer, worked in the diplomatic corps and saw the rise of the Nazis, and sipped whiskey with Hemmingway during the Spanish Civil War before coming up with the basic strategy which predominates today. [Link]
Ground-Penetrating Radar Reveals Entire Ancient Roman City by George Dvorsky (Gizmodo)
New radar technology has allowed archaeologists to explore the ruins of an ancient Roman settlement north of Rome without any actual digging. [Link]
COVID
Identifying airborne transmission as the dominant route for the spread of COVID-19 by Renyi Zhang, Yixin Li, Annie L. Zhang, Yuan Wang, and Mario J. Molina (PNAS)
Using event studies, the authors posit that airborne transmission is by far the most dominant means by which COVID is transmitted, and that mask-wearing is highly effective at reducing transmission both for those who are symptomatic and those who have not yet been infected. [Link]
Exclusive: Bottlenecks? Glass vial makers prepare for COVID-19 vaccine by Ludwig Burger and Matthias Blamount (Reuters)
The German company that is the leading manufacturer of glass vials which store vaccines is reporting huge interest in obtaining product, which may be needed in the billions. [Link]
New Jersey Businesses Defy Lockdown After Murphy Violates Own Order by Elise Young (Bloomberg)
Political opponents of the New Jersey governor and small business owners are mad that he attended a Black Lives Matter protest while the state has not allowed full reopening of businesses. [Link; soft paywall]
China
Two-husband strategy may be a remedy for China’s one-child policy, professor posits by Ann Fifield (WaPo)
The one child policy both crushed birth rates in China and created a huge imbalance between the number of men and women; one possible solution is polyandry, with multiple husbands per bride. [Link; paywall]
Grants & Loans
Structuring Federal Aid To States As An Automatic (and Autonomous) Stabilizer by Author Williams (Employ America)
An argument that the federal government needs an independent agency to stabilize state government tax receipt declines during recessions, using rules-based grants to prevent large retrenchments in state government employment which extends and exacerbates recessions. [Link]
Is There Really A “Looming Bank Collapse?” by Nathan Tankus (Substack)
A thorough debunking of the silly notion that collateralized loan obligations (CLOs) are about to destroy the financial system. [Link]
Treasure
97-year-old New Jersey man leaves behind treasure trove of signed baseball cards by Yaron Steinbuch (NYP)
A New Jersey man had collected baseball cards for most of a century before passing recently with millions worth of memorabilia including six different cards signed by Babe Ruth himself. [Link]
Forrest Fenn confirms his treasure has been found by Danielle Prokop (Santa Fe New Mexican)
After hundreds of thousands of seekers failed (including at least five deaths), hidden treasure stashed with a public set of clues by a Santa Fe artifacts dealer has finally been found. Naturally, the result of the hunt are already the subject of multiple pieces of litigation. [Link]
Investing
Playing the Market Has a Whole New Meaning by Jason Zweig (WSJ)
With casinos closed and no sports to gamble on, tens of thousands of risk-seekers have turned to the stock market, with some pretty incredible results. [Link]
Booze
Budget beer and spiked seltzer dominated during the pandemic by Jordan Valinsky (CNN)
Consumers unable to quaff their thirst at the bar or game turned to hard seltzer and cheaper domestic brand beers during the COVID crisis. [Link]
Copywrites
US Military Could Lose Space Force Trademark to Netflix Series by Jim Johnson (CBR)
The new branch of the military didn’t check for copywrites before rolling out their name, which had already been snagged by a Netflix comedy. [Link]
Read Bespoke’s most actionable market research by joining Bespoke Premium today! Get started here.
Have a great weekend!
Decile Analysis of 6/11 Declines
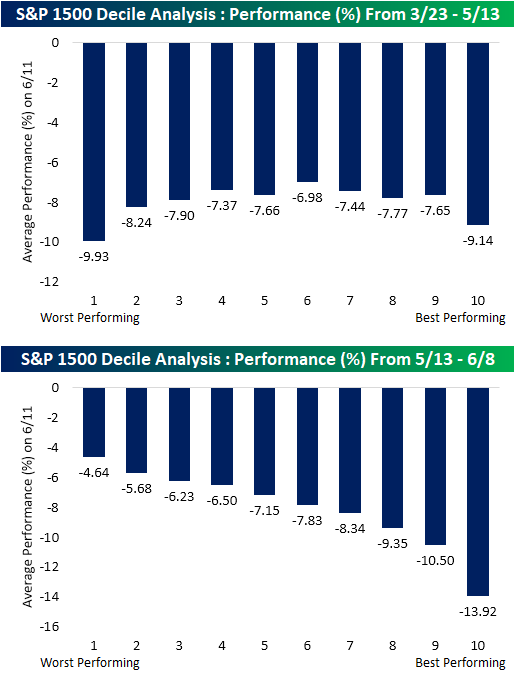
Yesterday was a flat out terrible day for equities. Breadth was extremely weak as the S&P 1500 had its worst day since March 16th falling over 6%. Most of the individual stocks within the index had fallen by even more with 23% down double digits. As shown below, one of the key driving factors of yesterday’s move was performance since the bear market low on March 23rd up through the start of this week. More specifically, the was clear profit-taking of the best-performing stocks of the new bull market. The decile of stocks that had risen the most from the March 23rd low through Monday fell 12.45% on average yesterday. No other decile fell double digits. Meanwhile, the stocks that have lagged on the way up actually outperformed yesterday, though that is not to say they were saved from sharp single-day declines.

As shown in the first chart below, performance in the initial rally off the March lows was not a very clear factor in yesterday’s selling though the best and worst performers in that period did see outsized declines yesterday. Alternatively, more recent performance was a more pronounced factor yesterday. Beginning in mid-May there began to be some rotation into names that had lagged in the first leg of the bull market rally. Over the past several weeks since then, things have reversed and these have been some of the best-performing stocks. As a result, there was major profit-taking of these recent winners yesterday. The best performing decile from 5/13 through the start of this week averaged a decline of 13.92% yesterday while the worst performers only fell 4.64% on average.
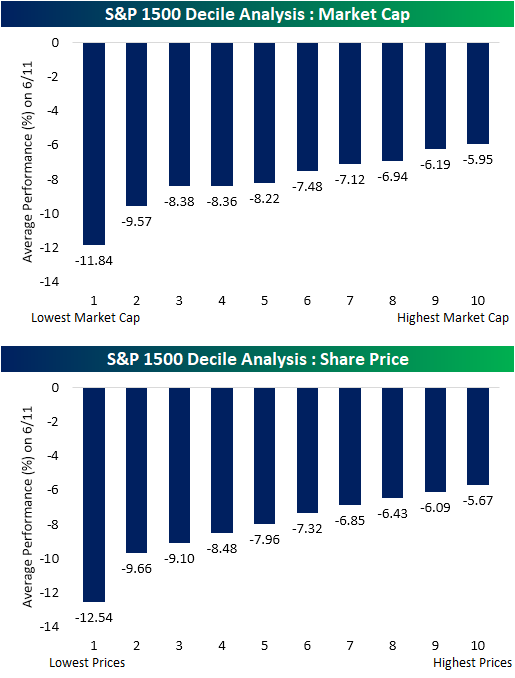
Another trend recently that has received a lot of headline attention has been the retail investor’s roll in the rally, especially in regards to the run-up in some less attractive and more beaten-down names. Given that lower-priced shares are typically seen as easier to stomach to retail investors, that also seemed to play a role yesterday. Both low market cap and low priced shares faced the worst declines yesterday. Alternatively, high priced and high market cap names saw much smaller declines. Click here to view Bespoke’s premium membership options for our best research available.
Bespoke’s Morning Lineup – 6/12/20 – “A” For Effort
See what’s driving market performance around the world in today’s Morning Lineup. Bespoke’s Morning Lineup is the best way to start your trading day. Read it now by starting a two-week free trial to Bespoke Premium. CLICK HERE to learn more and start your free trial.
After a downright horrible day for risk assets on Thursday, bulls are trying to close out the week on a high note with the S&P 500 indicated to open up by nearly 2%. The only economic data of note is Import Prices and Michigan Sentiment. Other than that, it looks like investors will be paying close attention to the latest COVID trends heading into the weekend.
Be sure to check out today’s Morning Lineup for a rundown of the latest stock-specific news of note, moves in overseas markets, an audacious move from Hertz to try and issue more equity to fund its bankruptcy, the latest Industrial Production numbers from the Eurozone, global and national trends related to the COVID-19 outbreak, and much more.
One result of yesterday’s rout in the equity market is that not a single major US index is up over the last five trading days, and every single one of them has moved out of overbought territory. Even the Nasdaq 100, is down fractionally!

Electric Dominating Global Auto Maker Market Cap
In today’s Chart of the Day, we detailed Tesla’s (TSLA) rise above $1,000 and what other stocks like Google (GOOGL) and Amazon (AMZN) have looked like when they first crossed $1,000. With TSLA reaching these kinds of levels, it also now has a record share of the total market cap of global automobile makers. Including the electric car company with the other 20 companies in the S&P Global 1200 Automobile Index, TSLA accounts for just over 22% of the total market cap. That is the second-largest of any company behind only Toyota whose $210.69 bn (USD-adjusted) accounts for 24.43%. As we have detailed in the past, TSLA’s market cap is now significantly larger than other US automobile producers like Ford (F), General Motors (GM), and Harley Davidson (HOG). In fact, it is now more than double the market caps of those companies combined! The rest of the world’s automobile companies including Japanese names like Honda and German names like BMW and Daimler (Mercedes) account for 69.58% of the total market cap.
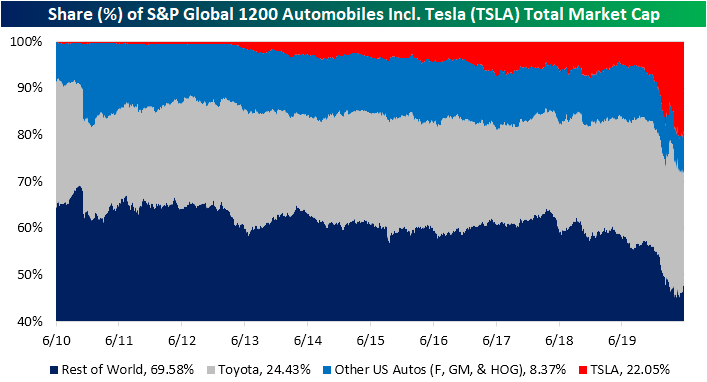
Although TSLA accounts for a massive share of world automaker’s market cap, it still makes up for a very small share of these companies’ total revenues. In fact, its $24.58 bn in sales in 2019 only accounted for 1.29% of all these companies’ total revenues. Albeit it is a high growth name, that leaves it with one of the higher valuations on a P/S and P/B basis. A similar dynamic can be seen for other high-end brands like Italian brand Ferrari and German brand Porsche. The same can be said for another electric vehicle stock that has received a large amount of headline attention recently, Nikola (NKLA). NKLA likewise is another name with a fairly large disparity between its sales and share of market cap. Another high growth name and recent IPO, Nikola actually had no revenues in 2019 but is valued at $23.46 bn or 2.56% of total market cap. That is more than some other major global brands like Hyundai, Suzuki, and Subaru to name a few. Click here to view Bespoke’s premium membership options for our best research available.

Bulls Coming Back in Favor
Although the weekly sentiment survey would not have captured equities’ sharp decline today, bullish sentiment through AAII’s weekly survey was lower by 0.27 percentage points to 34.28% this week despite the S&P 500’s general move higher in the past week. That was the smallest absolute weekly change for bullish sentiment since the final week of June of last year when it had risen by just 0.08 percentage points.

Bearish sentiment likewise was headed lower this week falling by 0.82 percentage points. That left bearish sentiment at 38.05% which is the lowest reading since February 20th.

That means most of the move this week went to neutral sentiment which was up from 26.58% last week to 27.67% this week. After being extremely muted for most of the COVID collapse, it is now at its highest level since the last week of February.

The bull-bear spread rose again this week and is now at -3.77. The spread overall still favors bears as it has for nearly four months now but is the closest to favoring bulls since early March when it stood at -0.9. This week also marked a fifth consecutive week in which the spread has risen. That is one of the longer streaks on record as shown in the second chart below and the longest since July of last year. If that streak continues through next week, it would be tied with three other streaks from 2007, 2014, and 2019 for the second-longest such streak on record.


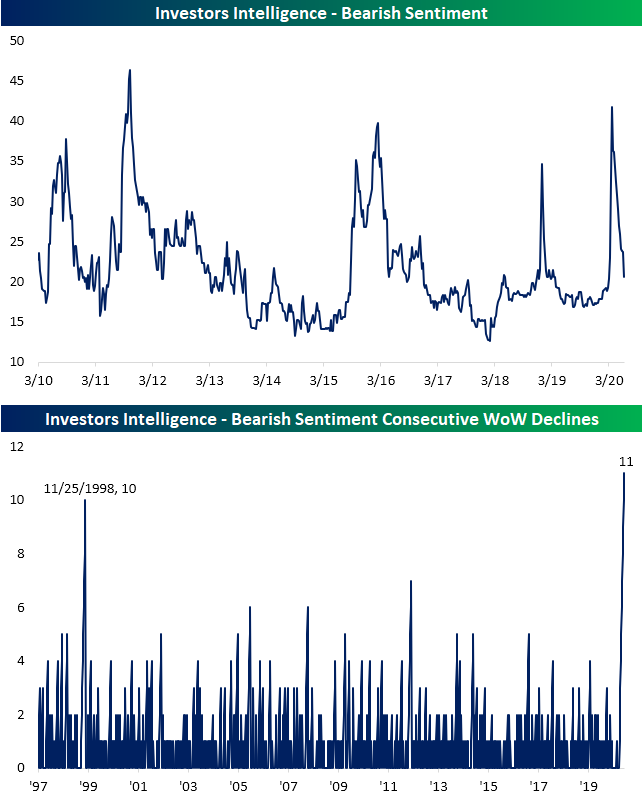
The Investors Intelligence survey is echoing the increasing bullish tones. Both bullish and bearish sentiment in this survey experienced the largest increase and decline, respectively, since the middle of April. Bullish sentiment is now 56.9% which is the highest level since January 22nd and in the 85th percentile of all readings of the past decade. This week was also a fourth consecutive and tenth of the last eleven weeks that bullish sentiment was higher week over week.

Bearish sentiment on the other hand is down to 20.6% which is the lowest level since the beginning of March. Although that only brings it to the middle of the past decade’s range, this week was the eleventh straight week with a WoW decline. As shown in the second chart below, that is the longest streak since at least 1997. Click here to view Bespoke’s premium membership options for our best research available.
Claims Finally Beat Estimates
Weekly jobless claims have been a mixed bag over the past several weeks. Though they have been consistently declining to their lowest levels since the start of the pandemic, they still are well over a million and that is excluding other claims like Pandemic Unemployment Assistance (PUA). Additionally, continuing claims remain elevated at over 20 million this week. This week was more of the same for initial jobless claims as they fell to 1.542 million; a tenth consecutive decline WoW which is the longest such streak on record. This week’s 355K decline was the largest WoW decline since 5/8 when they fell 489K. That brings the total number of initial jobless claims filed since the first over 1 million print in late March to over 44 million.

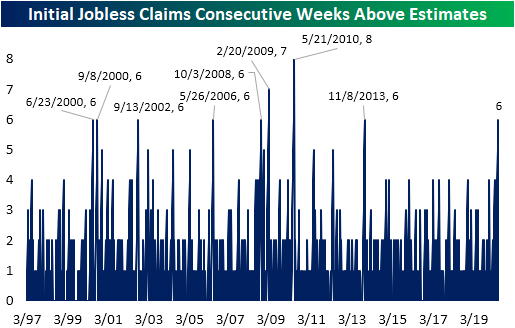
On top of being the lowest reading since late March and one of the larger WoW declines of the past couple of months, another positive of this week’s data was that it beat estimates. That was the first time this has happened in six weeks. As shown below, there have been several other streaks that initial jobless claims missed expectations for at least six straight weeks since the early 1990s. Only two of those streaks, one in 2009 and anther in 2010, came to an end at more than six weeks (seven and eight, respectively). This most recent streak was the first time claims missed that often since 2013.
As for the non-seasonally adjusted number, this week’s decline to 1.54 million was much more muted at only 82.9K. That still leaves claims at their lowest levels since the first print over 1 million and a ninth consecutive week with NSA claims lower. But this was also the smallest improvement for any week since claims began to work off their peak. Click here to view Bespoke’s premium membership options for our best research available.

Bespoke’s Morning Lineup – 6/11/20 – A Dose of Reality
See what’s driving market performance around the world in today’s Morning Lineup. Bespoke’s Morning Lineup is the best way to start your trading day. Read it now by starting a two-week free trial to Bespoke Premium. CLICK HERE to learn more and start your free trial.
Markets have seemingly been moving in one direction for the last several weeks, but today are getting a dose of reality on concerns over the pace of the economic rebound and whether it will be derailed by a new surge in cases around the country. No one said the recovery would be a smooth one.
If the current pace of declines holds, today will be the first 1% decline at the open for SPY since May 1st, and the 7th since the March 23rd low. If those prior periods are any indication, don’t look for much in the way of a rebound. In the six prior occurrences, the S&P 500 continued lower from the open to close four out of six times.
Be sure to check out today’s Morning Lineup for a rundown of the latest stock-specific news of note, moves in overseas markets, global and national trends related to the COVID-19 outbreak, and much more. In today’s report, we have also started to include data on state by state trends in hospitalizations.
In yesterday’s Chart of the Day, we highlighted the strong performance of large-cap tech as measured by the FANG+ Index over the four weeks. This morning we wanted to highlight the recent strength in another way by noting that yesterday’s rally was the fourth straight day where the FANG+ Index rallied 1% or more. As indicated by the red dots in the chart below, that’s only happened four other times in the index’s history dating back to 2014.

Are Retail Investors Driving Price Action?
We’ve seen a lot of media coverage focused on the idea that small investors are piling into the market and driving lots of the aggressive price action in recent months. This phenomenon was around before the March plunge in the market, but with bankrupt rental car companies (HTZ), flailing airlines (AAL), and Chapter 11 energy names (CHK) showing up in lists of stocks most widely-held by retail investors along with hyper-speculative plays on hot new products like electric truck manufacturer NKLA, it’s easy to see why people might get the idea that small retail investors flush with commission-free trading confidence might be having an outsized impact.
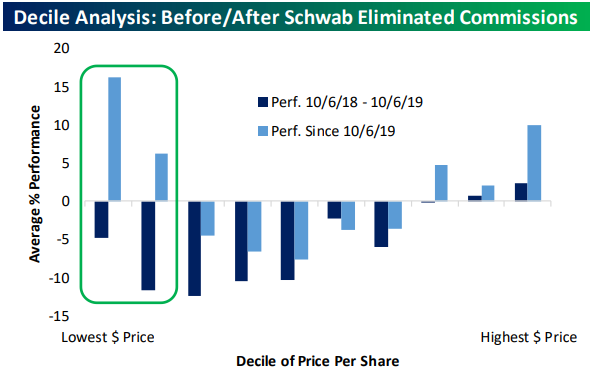
To test this theory, we started with the theory that relatively small traders are more likely to buy lower dollar price stocks. It’s easier to dip your toe into a $1 stock than a $150 stock, even if the division of the company’s value is arbitrary. For small-dollar accounts, that truism is the most important. Starting on October 7th of last year, Charles Schwab (SCHW) started offering commission-free trading to brokerage clients, competing with popular zero-commission product Robinhood. Fidelity and other brokers followed shortly after. In the year before October 7th, stocks with low dollar prices were notable underperformers relative to the rest of the market. The chart below uses the Russell 3000 as its sample and breaks the index into deciles (10 groups of 300 stocks each) based on share price. Since Schwab went to $0 commissions, the lowest priced stocks have been huge outperformers, and in fact the decile of stocks with the lowest per share prices are up 15%, substantially more than the rest of the market. To us, this looks like plausible evidence that smaller traders are playing at least some role in the performance of the market. We discussed this chart and other retail enthusiasm indicators in last night’s Closer report, which is available to Bespoke Institutional members. Click here to start a two-week free trial.
We’d note that the decile of the highest priced stocks has also outperformed over the same time period. Since $0 commissions began, we’ve also seen the introduction of fractional share trading on many online brokerage platforms, which allows investors to buy stocks by dollar amount instead of share amount. This now lets a small-dollar investor easily invest in high-priced stocks above $1,000/share like AMZN and GOOGL. Instead of having to buy a share of AMZN at $1,400, an investor can now simply buy $100 worth of AMZN and own a fraction of a share.