
November 2020 Asset Class Performance
The S&P 500 had its best November since 1928 with a gain of 10.75%. Below is a snapshot of our asset class performance matrix showing total returns across US-listed ETFs. Of the major US index ETFs, SPY was actually up the least in November with a gain of 10.88%. The S&P Smallcap 600 (IJR) and the Russell 2,000 (IWM) were up nearly twice that with gains of more than 18%.
Of the major sectors, Energy (XLE) was up by far the most in November but you’ll notice that it’s still down 35% year-to-date. The Financial sector (XLF) was up the second most in November with a gain of 16.85%, but like Energy, it too is still in the red on the year. Utilities (XLU) had the worst month with a gain of just 0.74%.
Outside of the US, four countries gained more than 20% — Brazil (EWZ), France (EWQ), Italy (EWI), and Spain (EWP). All four of these countries still finished November in the red for the year. India (PIN) and China (ASHR) were up the least of the countries listed with gains of 8% and 6.95%, respectively.
Looking at commodity ETFs, oil (USO) had a banner month with a gain of 22.65% while natural gas (UNG), gold (GLD), and silver (SLV) were all solidly in the red. For the year, though, USO remains down 69.8%. Finally, the various fixed income ETFs in our matrix were all up slightly on the month. The long-term Treasury ETF — TLT — remains up nearly 20% on the year, which easily beats the S&P 500 by more than five percentage points. Click here to see Bespoke’s premium membership options and start a free trial for instant access to our research and interactive tools.

Headcounts Hurting
Today’s ISM report pointed to broad improvements in the manufacturing sector in November, albeit there were some slowdowns in areas like New Orders, Production, and worst of all Employment. The index for Employment saw the sharpest decline falling 4.8 points from an expansionary reading of 53.2 in October to a contractionary 48.4 in November. That decline was in the bottom 5% of all month over month changes. Taking a more granular look, 18.9% of companies reported a lower number of workers (compared to 17.7% last month) whereas 14.8% reported a higher number (23.1% in October). 66.4% reported no change in the number of employees, up from 59.3% last month.
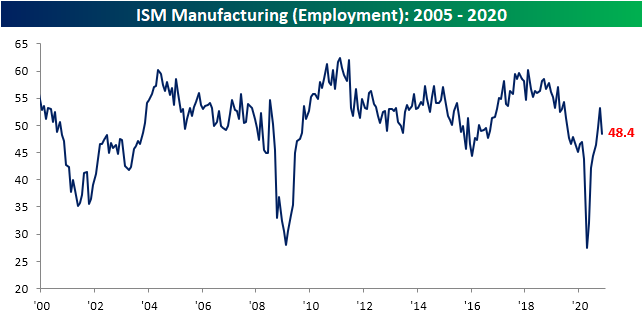
That reading at face value may be a bit of a worrying sign as it points to more companies reporting lower rather than higher headcounts. That also goes counter to other parts of the ISM report which pointed to further growth in demand and production. Some explanation can be found at least anecdotally through the comments section though. As shown below, rather than firms mentioning that they are laying off workers, the verbiage more often points to troubles in hiring. For example, there are mentions of “labor shortages” as “finding new people is an issue”. Put differently, there is anecdotal evidence that the manufacturing labor market is facing a supply instead of a demand issue. As a result of these shortages, firms report that there have been production constraints while demand has been strong. Click here to view Bespoke’s premium membership options for our best research available.

Manufacturer Recovery Continues
This morning, the Institute for Supply Management (ISM) released a less positive outlook for the US manufacturing sector. The headline number for ISM’s Manufacturing index fell from 59.3 last month down to 57.5. A drop was expected, but the actual results were worse than the drop to 58.0 that had been forecasted. That reading indicates that the manufacturing sector continued to grow in November but at a slower rate than October.

Similar to the various Federal Reserve bank surveys from around the country, breadth in the November report was more negative than in recent months. Of the ten indices excluding the headline number, only three were higher in November: Backlog Orders, Supplier Deliveries, and Export Orders. Additionally, two indices—Customer Inventories and Employment—showed contractionary readings.

One theme of the report was that orders remain very healthy. New Orders fell from 67.9 to 65.1, but that is a sixth consecutive month of expansionary readings. Although the index was lower this month, meaning new order growth decelerated, it remains in the top decile of historical readings. As new orders have continued to grow, so too have backlogs. The index for Backlog Orders has continued to press higher, rising to 56.9 from 55.7. That is in the 88th percentile of all months and is now at the highest level since August of 2018. Demand continues to improve with new orders coming in at a historically strong pace, even though it is slower than last month, and order backlogs have once again risen as a result.

As new order growth decelerated, so too did production. The index fell from 63.0 in October to 60.8 last month. That is still consistent with growth (readings above 50) in production but at the slowest rate since June. One factor that potentially had an impact on the slowdown in production is issues with suppliers. The index for Supplier Deliveries rose for the fourth month in a row in November and reached the highest level since May. Higher readings in the Supplier Deliveries index indicates longer lead times and vice versa. In other words, products from suppliers have been taking longer to reach manufacturers, in turn, impacting productivity.

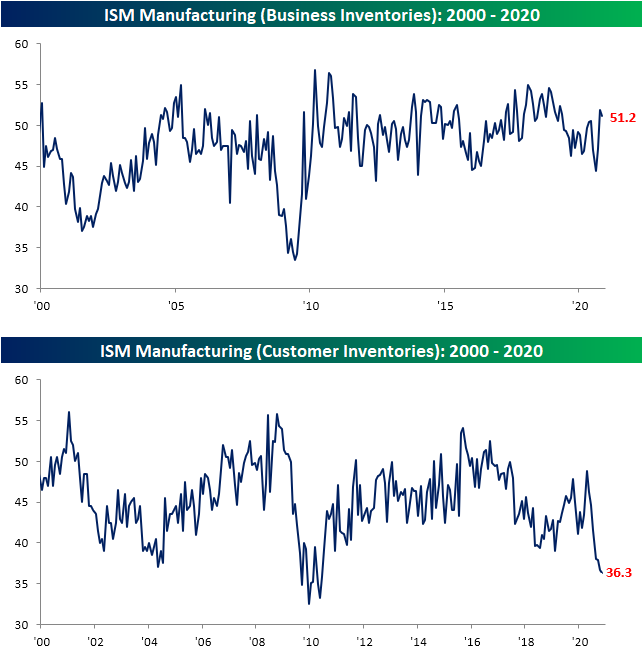
Although suppliers appear to have some constraints and production has slowed slightly, business inventories rose for the second month in a row even as more and more firms report that customer inventories are too low. The index for Customer Inventories now sits in the bottom 2% of historical readings after dropping another 0.4 points in November. At 36.3, the index is at the lowest level since June of 2010. That low reading can be considered positive for future production. Click here to view Bespoke’s premium membership options for our best research available.
Bespoke Market Calendar — December 2020
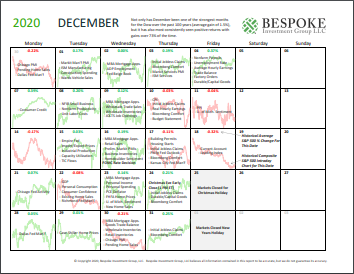
Please click the image below to view our December 2020 market calendar. This calendar includes the S&P 500’s average percentage change and average intraday chart pattern for each trading day during the upcoming month. It also includes market holidays and options expiration dates plus the dates of key economic indicator releases. Start a two-week free trial to one of Bespoke’s three research levels.
Stocks and Bonds Both in Rally Mode
When it comes to equity market performance in a given month, it doesn’t get much better than November. While the S&P 500’s total return of 10.95% in the month was only the second-best monthly performance of the year, it was still enough to rank as the third-best month for the S&P 500 in the last thirty years and just the ninth month since 1980 that it was up 10%+.
The chart below shows the S&P 500’s annualized total return over the last one, two, five, ten, and twenty years and compares the current returns to the historical average. For the last year, the S&P 500’s total return has been 17.5% which is nearly six full percentage points higher than the historical average. For the last two years, the annualized return has been nearly as strong at 16.8%, and it is actually even stronger relative to the historical average of 10.5%. Moving further out the time horizon, the S&P 500’s annualized returns drift lower, and while the five and ten-year annualized returns are greater than average, the S&P 500’s annualized gain of 7.3% in the last 20 years is more than 3.5 percentage points below the historical average of 10.9%.

The last couple of years haven’t just been strong for equities. Over the last year, long-term US Treasuries, as measured by the Merrill Lynch 10+ Year US Treasury Index, have rallied 15.7%, which is more than six full percentage points greater than the historical average of 9.5%. Over the last two years, returns have been even stronger with an annualized gain of nearly 20%, or more than double the historical average of 9.1%! While the last two years have been strong for US Treasuries, the last five, ten, and twenty years have all seen returns of between one and two percentage points below their historical average.

Lately, when you see rallies in the equity market, it tends to be accompanied by a decline in treasuries as yields rise. In November, though, that wasn’t the case. Even with the S&P 500 up 10.95%, long-term US Treasuries rallied just over 1%. So how uncommon is it for stocks to rally like they did in November while bonds also rally. Actually, it is not very uncommon at all. The table below shows the nine months since 1980 where the S&P 500’s total return in a given month was 10% or more, and of those months, long-term treasuies also rallied in every month but one (October 2011). Click here to view Bespoke’s premium membership options for our best research available.

Bespoke’s Morning Lineup – 12/1/20 – Stronger Data Boosts Futures
See what’s driving market performance around the world in today’s Morning Lineup. Bespoke’s Morning Lineup is the best way to start your trading day. Read it now by starting a two-week free trial to Bespoke Premium. CLICK HERE to learn more and start your free trial.
“I believe you have to be willing to be misunderstood if you’re going to innovate.“ – Jeff Bezos
Futures are picking up in December right where they left off November as the S&P 500 is indicated to open up just about 1%. Besides just the near-constant bid to the market these days, other factors behind today’s move include a rally in European equities and generally positive economic data out of Asia and Europe.
Be sure to check out today’s Morning Lineup for updates on the latest market news and events, economic data out of Asia and Europe, an update on the latest national and international COVID trends, and much more.

With a gain of 10.75%, the S&P 500 just had its best November since 1928 when the index rose 11.99%. But while it was the best November in more than 90 years, it wasn’t even the best month of 2020 as April’s 12.68% gain still holds that lead.
As we noted at the start of the month, November has historically been a good month from a seasonal perspective. The same is true for December as shown in our monthly seasonality snapshot below. Over the last 100 years, the Dow has averaged a gain of 1.43% with positive returns 73% of the time. Over the last 50 years, the Dow has averaged a gain of 1.51% with positive returns 70% of the time. And over the last 20 years, the Dow has averaged a gain of 0.84% with positive returns 65% of the time.

Lone Star Slowing
The fifth and final regional Fed index for November came out of the Lone Star State today. The index was expected to show expansionary, but decelerating activity in the month of November. The results were just that as the headline number fell from 19.8 in October down to 12 which was a bit weaker than the expected decline to 14.3. Although a slower rate of growth, activity has continued to expand and the index still at some of the highest levels of the past two years.

Similar to the other manufacturing reports from the other districts released this month, under the hood things were pretty mixed. All but one index (Finished Good Inventories) has continued to be consistent with further growth, but more than half of those indices declined this month, That means activity has generally continued to expand, but at a slower pace than last month. For some components like New Orders and Production, the deceleration was significant while employment metrics held up better.
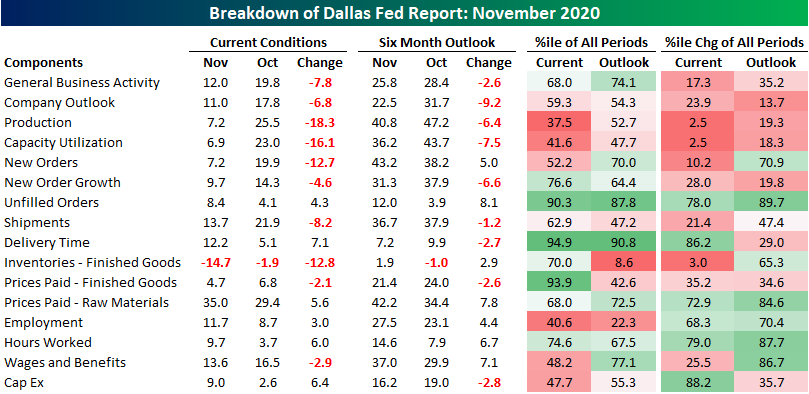
In November, New Orders continued to grow as the index remained positive at 7.2. While that is still indicative of overall growth in new orders, it also marks a significant deceleration from October when the reading was 19.9. Given this, the index for New Orders Growth Rate likewise fell to 9.7 from 14.3.

The indices for Capacity Utilization and Production saw even more dramatic declines. The month over month declines for both indices were in the respective bottom 2.5% of all monthly changes. With Capacity Utilization at 6.9 and Production at 7.2, this month’s readings were still indicative of the district’s firms increasing output for six months in a row.
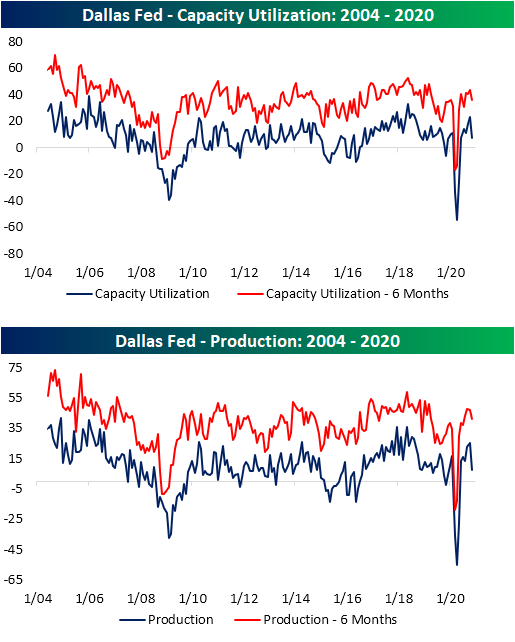
Even though production overall has continued to pick up, inventories continue to decline at a rapid pace. The index for Finished Good Inventories fell sharply this month, dropping from -1.9 to -14.7. Outside of August’s low of -17.3, that is the lowest level since January of 2010.

As inventories drawdown at one of the most rapid paces of the past decade, lead times have risen. The index for Delivery Time bounced back in November after a decline in October. At 12.2, the index is now at the highest level since the summer of 2018. That is also nearly in the top 5% of all readings in the survey’s history. Click here to view Bespoke’s premium membership options for our best research available.

Bespoke Matrix of Economic Indicators – 11/30/20
Our Matrix of Economic Indicators is the perfect summary analysis of the US economy’s momentum. We combine trends across the dozens and dozens of economic indicators in various categories like manufacturing, employment, housing, the consumer, and inflation to provide a directional overview of the economy.
To access our newest Matrix of Economic Indicators, start a two-week free trial to either Bespoke Premium or Bespoke Institutional now!
Megas Not Pulling Their Weight
We’ve become conditioned over the last couple of years to look to the mega-cap stocks of Apple (AAPL), Microsoft (MSFT), Amazon.com (AMZN), Alphabet (GOOGL), and Facebook (FB) to not only top the list of largest stocks, but also the best performers. The month of November has been a different story, though. Through Friday, the S&P 500 was up an impressive 11.3% on the month, but the equal-weight index (which weights each stock the same) was up a much more impressive 15.4%. Going back to 1990, this November’s performance of the S&P 500 Equal-Weight Index ranks as the second-best of the last thirty years only trailing the 18.6% gain in April 2009.
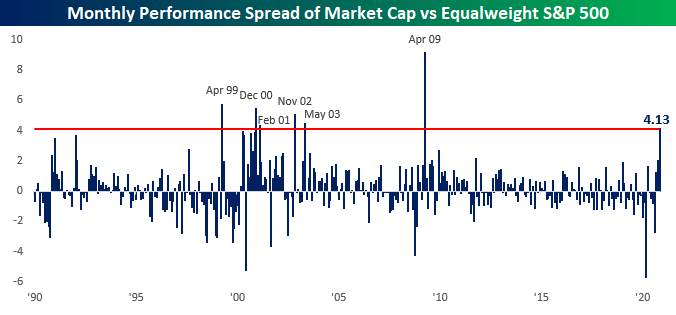
In addition to being one of the best months for the S&P 500 Equal Weight Index in terms of absolute performance, this month is also on pace to be one of the best months for the index relative to the market-cap weighted index as well. At the current level of 4.13 percentage points (chart below), this November will be the best performance for the Equal Weight Index relative to the Market Cap Weighted index since April 2009. Besides April 2009, which was just after the lows of the Financial Crisis, the only other months where the performance gap was wider were in five months spanning April 1999 through May 2003.
In terms of top-performing S&P 500 stocks this month, there have been a lot of winners. In the entire index, only 40 stocks are down month to date, and only nine of those are down more than 5%. The table below lists the 27 stocks in the S&P 500 that have rallied more than 40% so far this month. The top six stocks listed, as well as a number of others, come from the Energy sectors. Besides beaten-down stocks from the Energy sector, most of the stocks listed come from other sectors, like cruises, air travel, and lodging that have been battered by the pandemic. Five stocks you won’t find on the list, though, are the FAAMG stocks mentioned above. While all five stocks are in the black for the month, none of them are even up 10%. Slackers.
One last observation is that even after gaining at least 40% in November, 25 of the 27 stocks listed below are all still down YTD, and most of them by a lot. The only two stocks that are now positive YTD are Albermarle (ALB) and DISH Network (DISH). Even after taking into account this month’s gains, the average YTD change of the 27 stocks listed is a decline of 32.1%. Click here to view Bespoke’s premium membership options for our best research available.

Bespoke Brunch Reads: 11/29/20
Welcome to Bespoke Brunch Reads — a linkfest of the favorite things we read over the past week. The links are mostly market related, but there are some other interesting subjects covered as well. We hope you enjoy the food for thought as a supplement to the research we provide you during the week.
While you’re here, join Bespoke Premium with a 30-day free trial!
Regulation
Coinbase Will Suspend All Margin Trading Tomorrow, Citing CFTC Guidance by Nikhilesh De (Coindesk)
Thanks to new CFTC guidance that limits the ability of exchanges to liquidate crypto holdings on margin calls, one of the largest exchanges is shutting down margin trading. [Link]
Illegal Tampering by Diesel Pickup Owners Is Worsening Pollution, E.P.A. Says by Coral Davenport (NYT)
Off-the-shelf devices marketed as improving performance in pick-up trucks have been creating massive amounts of pollution by altering settings on truck engines to bring them out of compliance with EPA regulations. [Link; soft paywall]
COVID Changes
People are working longer hours during the pandemic (The Economist)
Evidence is mounting that all the time saved by working from home instead of commuting during the pandemic has been eaten up by more time working. [Link]
The extra mile: how Covid-19 transformed exercise by Laura Noonan (FT)
People seeking any possible escape from the drudgery of the pandemic – and being locked into repetitive routines – have led to a revolution in the way they engage in fitness. [Link; paywall]
Innovation
Microsoft’s Creepy New ‘Productivity Score’ Gamifies Workplace Surveillance by Alyse Stanley (Gizmodo)
Microsoft has built a dense suite of surveillance and reporting tools into newer versions of its ubiquitous workplace software, prompting concerns that the company will be directing how workplaces evolve in addition to attacking employees’ privacy. [Link]
From Culinary Dud To Stud: How Dutch Plant Breeders Built Our Brussels Sprouts Boom by Dan Charles (NPR)
It’s not just your imagination: brussels sprouts used to be much worse. Selective breeding efforts in the 1990s led to the modern delectable crunch of greenery. [Link]
Citations
CDC director cites this website to back in-school learning. Its designer calls that ‘bananas’ by Maggie Fox (CNN)
An unofficial tracker for COVID infections in schools is being cited by policymakers. The only problem? It creator has backpedaled sharply, suggesting that the data is not meant for the sort of analysis it is being used for. [Link]
Development
Pushed by Pandemic, Amazon Goes on a Hiring Spree Without Equal by Karen Weise (NYT)
Amazon has added almost half a million workers in less than a year, roughly 50% of the company’s total global workforce. [Link; soft paywall]
10 new skyscrapers about to transform the Toronto skyline by Tanya Mok (blogTO)
Don’t look now, but Canada’s largest city is getting a lot taller. A series of extremely high buildings are starting to take shape, and will fundamentally alter the huge city’s skyline. [Link]
Read Bespoke’s most actionable market research by joining Bespoke Premium today! Get started here.
Have a great weekend!