
Neutral Sentiment Back on the Rise
The S&P 500 has been edging its way higher back towards all time highs in the past week, and in spite of that move, sentiment has continued to moderate. The AAII weekly reading on bullish sentiment fell for a second week in a row coming in at 43.43%. That is the lowest level of bullish sentiment since the first week of November, though, that is also still elevated relative to where sentiment has frequently been over the past several years.
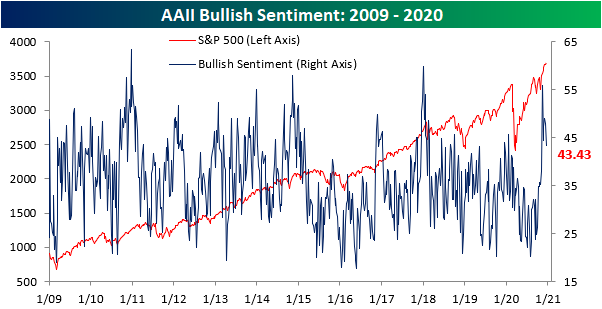
Despite the move lower in bullish sentiment, bearish sentiment also took as small turn lower. Just over a quarter of respondents to this week’s survey reported as bearish, down slightly from 26.86% last week. Inverse to bullish sentiment, without much of a large change, bearish sentiment remains at the low end of its range.

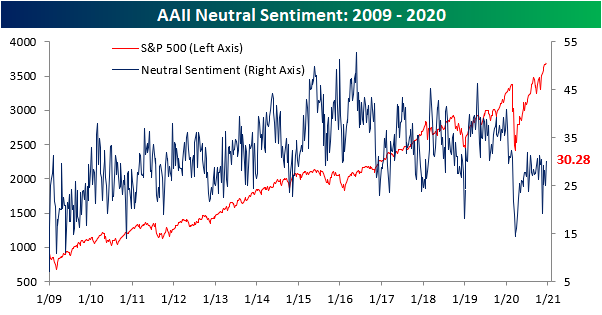
Given both bearish and bullish sentiment fell, neutral sentiment picked up the difference. Over 30% of respondents reported as neutral this week which was the most since the first week of November. While that is not a high reading relative to where neutral sentiment has normally come in over the past few years, it is at the upper end of the lower range since the pandemic began.
Even though neutral sentiment picked up, bulls continue to heavily outweigh bears. Given this, the bull-bear spread remains elevated. This week it fell down to 17.14% from 21.2%. That is the lowest level of the spread since the first week of November and is the seventh week in a row that more respondents reported as bullish than bearish. That is the longest streak of consecutive positive readings in the bull bear spread since one lasting 15 weeks ended in late January of this year. Click here to view Bespoke’s premium membership options for our best research available.

Philadelphia Manufacturing Hitting the Breaks
This morning, the Philadelphia Fed released its monthly reading on the region’s manufacturing sector. The headline index fell to 11.1, which was the second monthly decline in a row and larger than consensus expectations for a drop to 20. While the still positive number indicates further growth in the region’s manufacturing sector, it is also the slowest pace of growth in the last six months.

On Tuesday, the New York Fed’s monthly manufacturing report showed some slowing down in the manufacturing sector as the headline number dropped, though under the hood not all was lost as most sub-indices managed to rise month over month. The same cannot be said for the neighboring Philadelphia Fed region. Breadth in the report was very weak as only two indices (Delivery Times and Inventories) managed to move higher in December. The moves higher for those indices are also not necessarily good developments as they indicate higher inventories with longer lead times. Most other indices fell double digits with the declines of some in the bottom 1% of all monthly moves. On the bright side, every index did remain in expansionary territory (readings above zero) meaning growth has continued, but there was a significant slowdown.
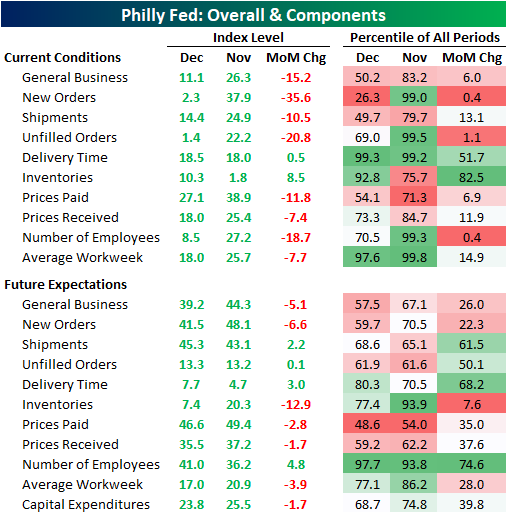
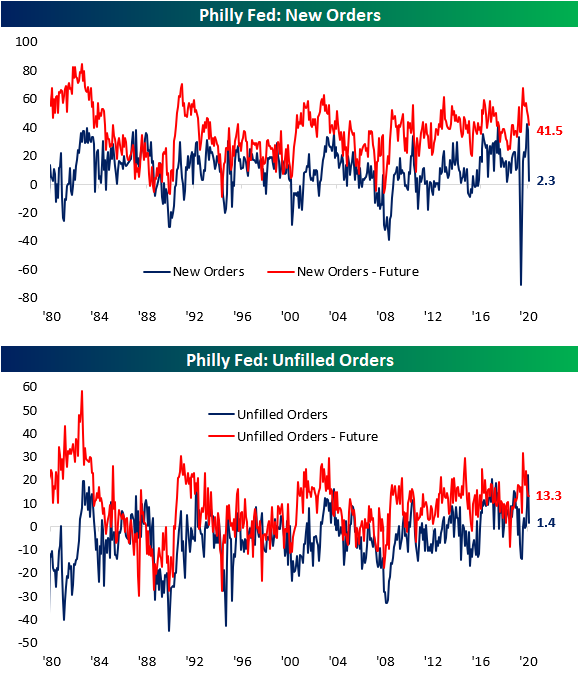
One of the areas to have seen the sharpest drop was New Orders. Whereas last month the index for New Orders came in at a near-record 37.9, December saw a huge drop down to a barely expansionary reading of 2.3. That 35.6 point drop was the largest decline since the 49.1 point and 55.4 point declines in March and April, respectively. It also ranks in the bottom 1% of all monthly moves going back to the start of the index in 1980. The same applies to the index of Unfilled Orders. Last month’s reading was the strongest since March of 1973, but the over 20 point decline in December resulted in a reading that points to much less rapid growth in unfilled orders than the previous month. That decline also ranks around the bottom 1% of all monthly moves.
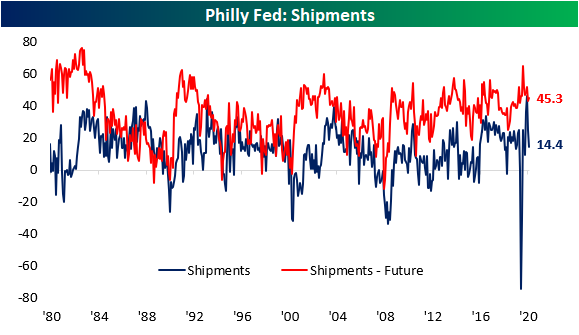
Given that slowdown in demand, Shipment growth also slowed in December although not to anywhere near the same degree as New and Unfilled Orders. The index for Shipments peaked back in October at 42.6. The past two months now have seen the number nearly cut in half falling to 24.9 last month and 14.4 this month. Again, the reading is still indicative of growth, but at a much more modest pace. In fact, December’s reading of 14.4 is essentially in the dead middle of the historical range.
Again, the only two indices that managed to move higher in December were those for Delivery Times and Inventories. Lead times remain historically high as the index for Delivery Times rose slightly to 18.5. That is in the top 1% of all readings. Elsewhere in the supply chain, inventories rose at a faster pace in December as that index rose from 1.8 to 10.3. That is the second month in a row of inventory expansion.


Finally, the employment metrics this month saw similar moves to those of orders. The index for number of employees was in the top 1% of all readings last month, but a historically large decline resulted in a much lower reading of 8.3 this month. That still indicates net hiring, but at a slowed pace. Additionally, the average workweek grew more slowly as that index fell from 25.7 to 18. Click here to view Bespoke’s premium membership options for our best research available.

Bitcoin Goes Bonkers
Whether you want to call it a textbook breakout or a blow-off top, the move in bitcoin over the last two days has been something to behold. Think about it this way. In the last two days, bitcoin’s price has risen by $3,926 or roughly 20%. That’s a pretty incredible move even for bitcoin, but it’s even crazier when you consider the fact that at its intraday low in March, bitcoin’s price ($3,914.7) was lower than the gain in the last two trading days!

With bitcoin’s surge in the last two days, the ratio between bitcoin and gold is also making a run for its record high back in late 2017. At current prices, one bitcoin will buy you 12.3 ounces of gold. That’s still 2.5 ounces below the record high, but as recently as last Friday (12/11), the ratio was less than 10. Click here to view Bespoke’s premium membership options for our best research available.

Another Disappointment From Jobless Claims
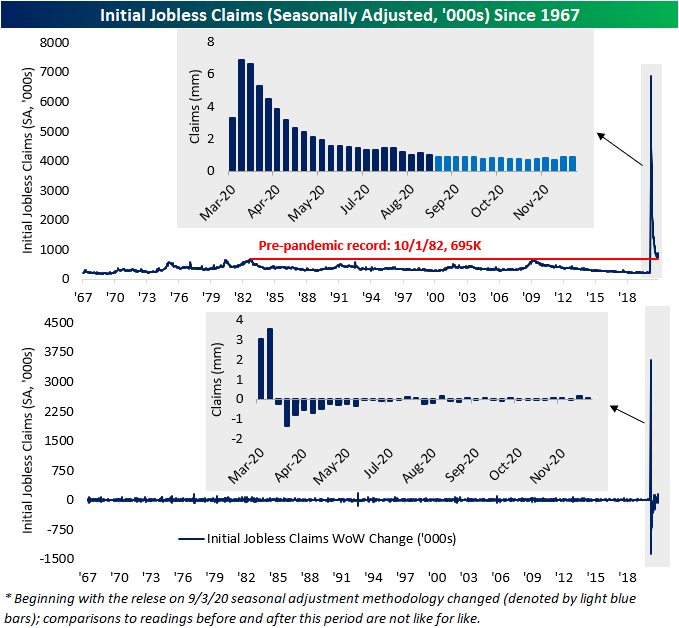
After last week’s larger than expected 146K increase in jobless claims, economists were expecting to see an improvement this week with claims falling back down to 818K. Instead, claims unexpectedly moved even higher rising to 885K. That is the highest print for initial claims since the first week of September’s reading of 893K. Claims are now up around 169K in the past two weeks, the largest increase since the start of the pandemic.
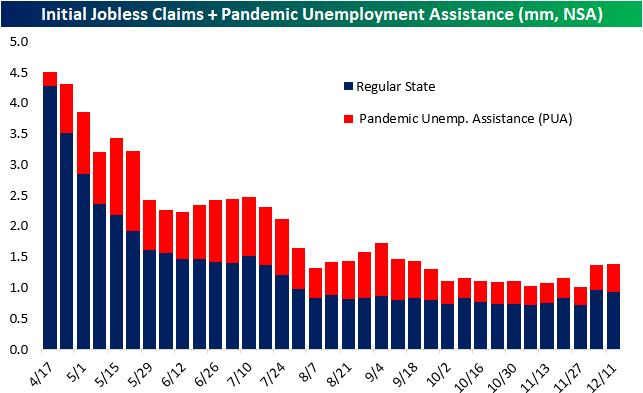
On a non-seasonally adjusted basis, the picture was slightly better. Unadjusted claims were actually slightly lower week over week falling down to 935.1K from 956.5K. Granted, that reading is still elevated at one of the highest levels since late July. Additionally, the current week of the year has typically seen a move lower; in all years since 1967, the 50th week of the year has seen a week over week decline 89% of the time averaging a 40K drop. That means the improvement in the unadjusted number could, to a degree, be chalked up to seasonality.

While unadjusted regular state claims fell, the inclusion of other programs like Pandemic Unemployment Assistance (PUA) worsens the overall picture. Total claims between the two programs rose to 1.390 million from 1.371 million last week which is the highest level of claims since the week of September 18th. Obviously, PUA claims drove that increase as they rose to 40K WoW to 455K. Like total claims, that is the highest print for PUA claims since September.
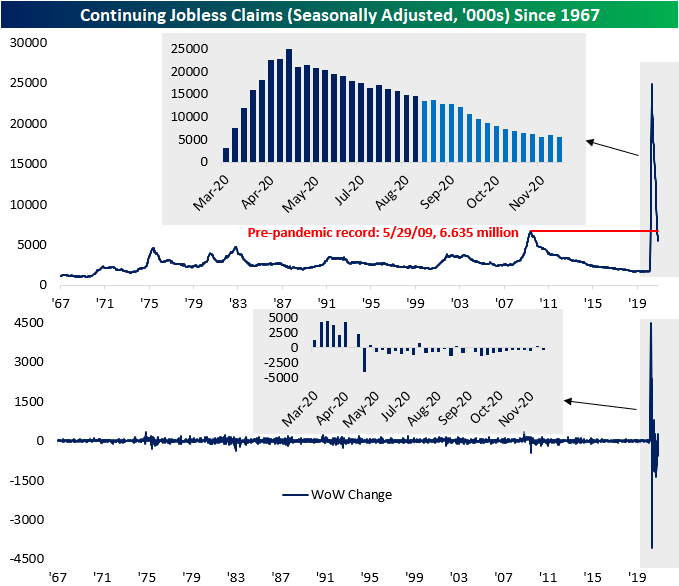
Despite last week’s massive increase in initial claims, continuing claims for the week of December 4th (lagged one week to the initial claims data) resumed its move lower falling to 5.508 million. That reversed the prior week’s (November 27th) uptick to 5.781 million, surpassing the pandemic low of 5.527 million from the week of November 20th in the process.
Including all programs adds yet another week of lag meaning the most recent data for all programs is for the last week of November; the same week as the previously mentioned uptick. During that week, not only did regular state programs see a significant increase, but so too did PUA claims which rose back above 9 million. That was as extension programs like Pandemic Emergency Compensation (PEUC) and Extended Benefits also rose to new respective pandemic highs. These programs also continue to account for more than a quarter of total claims. In other words, the uptick in the final week of November was broad across programs resulting in the sum of all programs to rise back above 20 million after just a week below that level. Click here to view Bespoke’s premium membership options for our best research available.

Bespoke’s Morning Lineup – 12/17/20 – Let the Countdown Begin
See what’s driving market performance around the world in today’s Morning Lineup. Bespoke’s Morning Lineup is the best way to start your trading day. Read it now by starting a two-week free trial to Bespoke Premium. CLICK HERE to learn more and start your free trial.
“An end is only a beginning in disguise.” – Craig D. Lounsbrough
Futures are indicated higher this morning as European equities rally on a plan for a rollout of the COVID vaccine in that region. French President Macron announced that he will be self-isolating due to a positive test for COVID, and as a result, several other EU leaders announced plans to self-isolate after coming into contact with Macron in recent days.
Just-released economic data was mixed with Housing Starts and Building Permits topping expectations, Philly Fed missing forecasts, Initial Jobless Claims higher than expected while Continuing Claims were lower than expected.
Be sure to check out today’s Morning Lineup for updates on the latest market news and events, a recap of economic data out of Asia and Europe, an update on the latest national and international COVID trends, and much more.

In what to many seems like the year that would never end, just ten trading days remain in 2020. We’ve mentioned in the past how the month of December has typically been back-end loaded, and that is also evident in a look at the S&P 500’s performance during the last ten trading days of the year. Going back to 1945, the last ten trading days have experienced a median gain of 0.93% with positive returns 73% of the time. Performance in the last ten years has been similar with a median gain of 1.04% and gains 70% of the time.

Homebuilder Sentiment Unfazed
In every month from August through November, NAHB’s reading on homebuilder sentiment came in at record highs. That streak was bound to come to an end eventually, and it happened this month. The December reading released today was expected to decline from a record of 90 down to 88. Instead, the drop was even larger as the index fell to 86. Although lower, that is still the second-highest reading on record dating back to 1985.

Each of the sub-indices were also lower this month with the declines in the bottom decile of all monthly moves, though again, the indices remain at historically strong levels in the top 1% of all readings. For the sub-index that tracks present sales, just like the headline number, the four-point decline in December hasn’t done much damage as it was also still the second-highest reading on record. The indices for future sales and traffic likewise fell an identical four points. For future sales, the decline only brings it back to where it stood in September and the index for Traffic is at the lowest level since August. Those are the third and fourth highest readings on record, respectively.

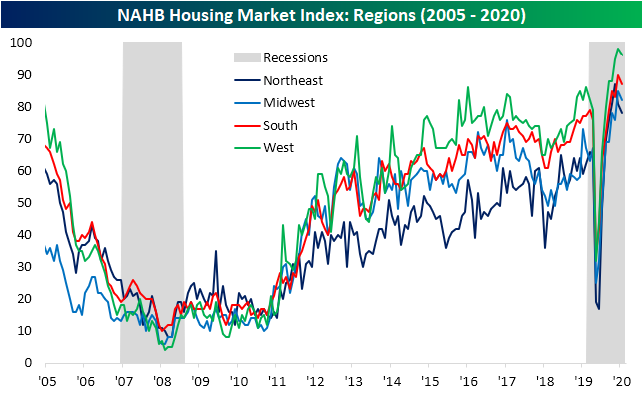
The picture also remains strong based on regions in spite of broad declines. While every region experienced a decline, the West’s was the smallest. Additionally, the index for the West is the highest of the four regions. The Northeast, on the other hand, has the lowest reading for sentiment, though, it too is in the top 2% of all readings.
Elsewhere in housing data today, the MBA’s weekly mortgage application data showed another uptick in purchase applications. Purchase apps rose 1.8% week over week, and while still off the highs from the last week of November, purchases are running at the strongest level in over a decade.

Even though this data remains broadly strong, homebuilder stocks have not been reflecting it. As shown below, the S&P 1500 Homebuilders group has yet to take out its October 15th high, currently trading 11.51% below that level. Since that high, the index has also fallen below its 50-DMA with multiple failed attempts to move back above. In fact, of the 43 trading days since that high, the group has closed below its 50-DMA on all but 10 days. While that paints a somewhat negative technical picture, on the bright side, the group has yet to make a lower low. Click here to view Bespoke’s premium membership options for our best research available.

Bespoke CNBC Appearance (12/14)
Bespoke co-founder Paul Hickey appeared on CNBC’s Closing Bell yesterday on Monday to discuss the market outlook in a post-vaccine world. To view the segment, click on the image below.
Bespoke’s Morning Lineup – 12/16/20 – Big-Coin
See what’s driving market performance around the world in today’s Morning Lineup. Bespoke’s Morning Lineup is the best way to start your trading day. Read it now by starting a two-week free trial to Bespoke Premium. CLICK HERE to learn more and start your free trial.
“Buying’s easier, selling’s hard – [it’s] hard to know when to get out.” – Seth Klarman
On a day when the FOMC is scheduled to announce a decision on interest rate policy and Congress is attempting to hammer out a stimulus bill, the latest data on Retail Sales is providing ammunition on the part of policymakers to go big. Retail Sales for the month of November were weak on all counts both relative to expectations and on an absolute basis. The headline index, for example, was expected to decline by 0.3% but actually saw a much larger decline, falling 1.1%. Later today, we’ll also get updates to Markit’s Manufacturing and Services Indices, Business Inventories, and Homebuilder Sentiment for the month of December.
Be sure to check out today’s Morning Lineup for updates on the latest market news and events, a recap of economic data out of Europe, an update on the latest national and international COVID trends, and much more.
Along with just about every other asset priced in dollars, the price of bitcoin has been on the rebound in recent days, and in early trading today, prices are back above $20,000 to record highs. Again, as we discussed a couple of weeks ago when bitcoin was taking out its highs from late 2017, the latest run to $20,000 hasn’t been accompanied by nearly the amount of hype as there was back in 2017. All those people must be too busy focusing on SPACs.

VIX Run Above 20 Tops 200 Days
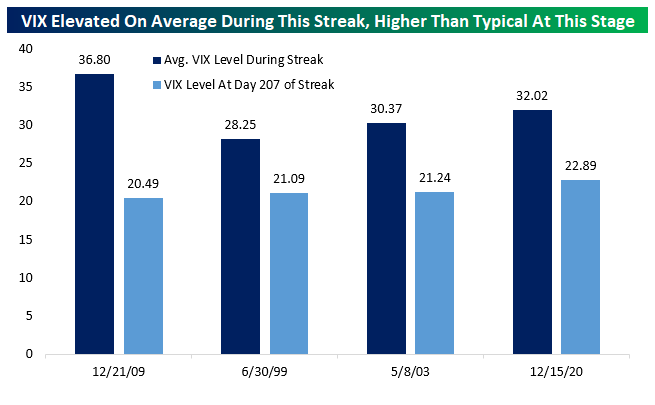
With today’s close, the VIX has now stuck above 20 for 207 trading days and counting. That marks the fourth-longest streak since the inception of the volatility index, and is approaching the late-1990s and early-2000s record runs. The index was above 20 for 239 trading days through the end of June 1999, and 236 trading days through May 8th, 2003. Of course, from 2008 to December 21st of 2009, the VIX was over 20 for 331 trading days (more than a year).

Surprisingly, the current VIX streak has had an average reading higher than the two longer streaks in 1999 and 2003. The average 32.0 reading over its course so far is second only to the streak recorded over the global financial crisis. It’s also interesting to note that at this stage in the streak (207 trading days), the current run has a higher reading than the three streaks which actually lasted longer.
Not All Bad for the Empire Fed
The New York Fed kicked off the slate of December manufacturing data this morning with the release of the Empire State Manufacturing Survey. The release was expected to come in at the same level as last month (6.3), but instead, moved lower down to 4.9. The index remained positive meaning the survey’s results were again consistent with growth, just at a slightly lower rate than expected. Even though current conditions have not been improving rapidly, respondents generally remain optimistic for the future. The index for expectations six months out was slightly higher at 36.3. While higher, it is off the highs from just a few months ago still at more optimistic levels than were observed over the last couple of years.

Even though the headline index fell 1.4 points this month, breadth in the report was fairly strong. Most indices were higher relative to November with the only two indices declining being those of New Orders and Prices Received. Meanwhile, only two indices—those for Unfilled Orders and Inventories—showed contractionary readings in December which is no different from last month. Granted, both of these indices also showed less of a contractionary picture. Expectations readings for the same indices, on the other hand, were more mixed with around half lower month over month.

One of the two indices to decline in December was New Orders. The decline was small though as the index dropped just 0.3 points to 3.4. Outside of August’s contractionary reading, that is the lowest reading for New Orders in the past six months. Granted, the positive reading meant new orders have now risen for four straight months, albeit at a slower pace in November and December.
As New Orders continue to grow, Unfilled Orders are getting worked off. The index for Unfilled Orders has remained in contraction for every month since April now. This month’s reading of -3.6 was the second-highest reading of that period behind July’s reading of -0.6. The expectations index, though, remains much more optimistic. 25.7% of respondents reported that they expect unfilled orders to be higher in six months compared to 11.4% reporting they expect orders to be lower. That resulted in the index rising to 14.3, the highest since February of 2018. The 9.7 point increase was also the largest one month move in expectations since November of last year.

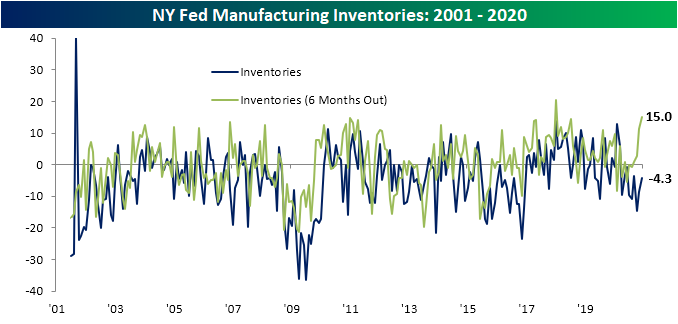
With businesses meeting demand, inventories have continued to decline. The index for Inventories has now been in contraction for nine consecutive months. Granted, this month saw the index move higher from -8.6 to -4.3. That means inventories have continued to decline but at a slower pace in December. Similar to unfilled orders, there is also quite a gap between current conditions and expectations. The index for future expectations rose to a reading of 15 in December. That is the second-highest reading on record behind January of 2018’s high of 20.3. In other words, even though inventories have declined for nine straight months, firms are not anticipating that to continue. Nearly 30% of responding firms reported that they expect inventories to rise in six months’ time.
While there were more improvements in demand and inventories were lower, prices for inputs have been on the rise. The index for Prices Paid rose 8 points to 37.1 in December. Expectations for Prices Paid likewise moved higher reaching the highest level in two years. Prices Received are not experiencing the same degree of upward pressure though. The index for Prices Received fell in December from 11.3 to 10 which is a much more modest reading overall. That is not to say it will continue to be that way. Expectations for Prices Received rose to a reading of 30, the highest level since February of 2018.

In spite of the rise in COVID cases, the report’s readings on employment were pretty strong. The index for the Number of Employees rose to 14.2 which was a two-year high while the index for the Average Workweek was unchanged at 4.8. So New York area manufacturers are not only hiring at their fastest rate since the end of 2018, but they are also increasing working hours. Click here to view Bespoke’s premium membership options for our best research available..
