Bespoke Brunch Reads: 1/17/21
Welcome to Bespoke Brunch Reads — a linkfest of the favorite things we read over the past week. The links are mostly market related, but there are some other interesting subjects covered as well. We hope you enjoy the food for thought as a supplement to the research we provide you during the week.
While you’re here, join Bespoke Premium with a 30-day free trial!
Retail Rippers
Penny-Stock Peddlers Piling Into Reddit Forum Prompt Rule Change by Sarah Ponczek (Bloomberg)
After an influx of schemes and promotions, moderators of a subreddit focused on low-price shares have moved to ban discussion of cryptocurrencies and any services, newsletters, or other social media accounts. [Link; soft paywall]
TikTok and Discord Are the New Wall Street Trading Desks by Caitlin McCabe, Gunjan Banerji and Mischa Frankl-Duval (WSJ)
There has been rabid interest in hot stocks promoted on social media, driving stampedes of small buyers in to obscure stocks which suddenly go parabolic thanks to the promotion on a range of social platforms. [Link; paywall]
Food & Drink
In Search of Ragu by Matt Goulding (Roads & Kingdoms)
The author goes searching for the plate that best captures the platonic ideal of pasta: rich, complex, and loaded with flavor buried in the depths of Bologna. [Link]
The Seven Essential Southern Dishes by Sheri Castle (Bitter Southerner)
While it’s impossible to completely distill a cuisine as varied and diverse as the South’s into a few dishes, the author gives it a shot. The results may surprise you, but don’t fret: each comes with a recipe to try. [Link]
This artificial ‘nose on a chip’ can sniff out wine, coffee, and noxious gas by Luke Dormehl (DigitalTrends)
A German company has developed a chip that can detect the chemicals that make scents smell to us the way they do. [Link]
Crypto
Lost Passwords Lock Millionaires Out of Their Bitcoin Fortunes by Nathaniel Popper (NYT)
Early adopters that stored bitcoin wallets on hard drives or other external media have millions of dollars at their finger tips but just out of reach. [Link; soft paywall]
Exclusive: Large bitcoin payments to right-wing activists a month before Capitol riot linked to foreign account by Jenna McLaughlin (Yahoo!)
A French programmer sent millions of dollars worth of bitcoin payments to far right activists in the month before the riot which sacked the US Capitol earlier in January. [Link; auto-playing video]
Real Estate
Manhattan Bargain-Hunters Drive a 94% Jump in Apartment Leases by Alex Wittenberg (Bloomberg)
With rents dropping sharply, the number of lease signings for Manhattan apartments has doubled versus a year ago, putting a bid under a bedraggled Manhattan market. [Link; soft paywall]
U.S. banks cast wary eye at mortgage borrowers as forbearance periods end by Imani Moise (Reuters)
With millions of borrowers receiving forbearance on their mortgages, banks are having a hard time trying to figure out whether non-payers are actually financially struggling or are just taking the opportunity to save some payments. [Link]
Tech
Why Joe Biden Can’t Bring His Peloton to the White House by Courtney Linder (Popular Mechanics)
Not averse to an occasional spin class, the President-Elect will have to leave his Peloton bike in Delaware because its Android tablet, internet link, microphone, and camera pose security risks in the West Wing. [Link]
Every Deleted Parler Post, Many With Users’ Location Data, Has Been Archived by Dell Cameron (Gizmodo)
After right-wing social network Parler was kicked off a number of services that were part of its core architecture, hackers exploited a number of vulnerabilities and managed to capture almost the entirety of the social network. [Link]
Medical Breakthroughs
Bupropion and Naltrexone in Methamphetamine Use Disorder by Madhukar H. Trivedi, M.D., Robrina Walker, Ph.D., Walter Ling, M.D., Adriane dela Cruz, M.D., Ph.D., Gaurav Sharma, Ph.D., Thomas Carmody, Ph.D., Udi E. Ghitza, Ph.D., Aimee Wahle, M.S., Mora Kim, M.P.H., Kathy Shores-Wilson, Ph.D., Steven Sparenborg, Ph.D., Phillip Coffin, M.D., M.I.A., et al. (NEJM)
A new study compared the effects of two drugs designed to reduce addiction to methamphetamines and found that while imperfect, there was a significant effect versus placebo. [Link]
Cancer Death Rate in U.S. Falls by Largest Yearly Amount on Record by Brianna Abbott (WSJ)
Thanks mostly to novel treatments for long cancer, recent data shows another huge drop in the cancer death rate to the lowest on record for women and near the lowest on record for men. [Link; soft paywall]
Baseball
He Just Wanted to Play Catch. They Got Relief From Troubled Times. by Mike Wilson (NYT)
A quest for a partner to play catch with led to a full pickup game that allowed all participants to escape the stresses of 2020 and just play ball. [Link; soft paywall]
Mickey Mantle card crushes record after selling for $5.2 million by Dan Martin (NYP)
A 70-year-old baseball card topped the previous record price by more than 20%; it’s one of only about three left in good shape according to experts. [Link; auto-playing video]
Personnel Change
James Simons Steps Down as Chairman of Renaissance Technologies by Gregory Zuckerman (WSJ)
After a huge year for the internally-managed funds at Renaissance Capital but a very bad one for clients, one of the firm’s founders is stepping down. [Link; paywall]
Hippos
Invasion of the hippos: Colombia is running out of time to tackle Pablo Escobar’s wildest legacy by Sarah Kaplan (WaPo)
Hippos that escaped the mansion of Pablo Escobar after his fall have become an invasive species in Colombia, and one that is very close to making a permanent mark on the region’s biosphere. [Link; soft paywall]
PPP
‘It Was a Joke’: Some Small Businesses Got $1 Relief Loans by Stacy Cowley (NYT)
A small number of the five million companies that got loans through the Paycheck Protection Program got loans of less than $99, which comes across as something like a cruel joke. [Link; soft paywall]
Read Bespoke’s most actionable market research by joining Bespoke Premium today! Get started here.
Have a great weekend!
Prices on the Rise in New York
The New York Fed’s reading on the manufacturing sector released this morning showed the region’s manufacturing sector still grew in January but at a slower pace. Rather than the expected uptick to a reading of 6.0, the index fell to 3.5 from 4.9. That is the lowest reading since the last contractionary reading (those below 0) in June.

While the headline number is still consistent with growth it stands at the low end of the historic range. Similarly, demand related readings like New Orders and Shipments remain historically low, albeit still indicative of growth. Of each component in the report, only the indices for Unfilled Orders and Inventories remain in contraction. Meanwhile, in addition to the headline index, the indices for Shipments, Unfilled Orders, and Number of Employees all showed deterioration in January.
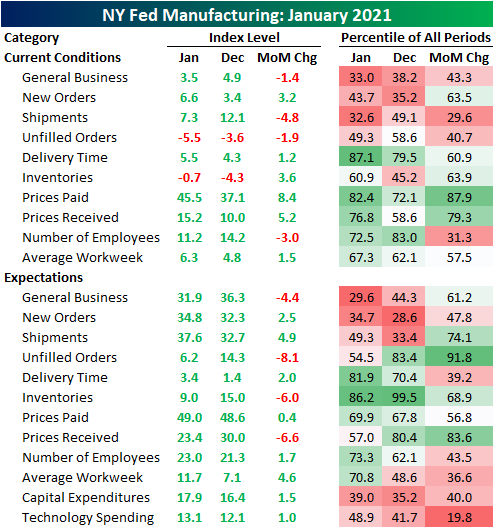
Whereas indices like New Orders and Shipments sit at lower ends of their historical ranges, those concerning employment are stronger. The index for Number of Employees showed slowing in hiring in January, though, firms were in fact continuing to take on more workers. Additionally, Average Workweek saw a bit of a bounce after declining in the final months of 2020.

The only indices to see dramatic moves higher in January concern prices. Prices Paid rose from 37.1 up to 45.5 which is the highest level since September of 2018. That 8.4 point increase was in the 87th percentile of all monthly moves for the index. Higher prices are also being passed on to customers as Prices Received was higher rising to 15.2. For that index, the level and move higher were not as dramatic. though. as it is only at the highest level since February of last year. That acceleration in rising prices is consistent with what we saw in the ISM report on the manufacturing sector last week. Click here to view Bespoke’s premium membership options for our best research available.

Bespoke’s Morning Lineup – 1/15/21 – Big Banks Beat, But…
See what’s driving market performance around the world in today’s Morning Lineup. Bespoke’s Morning Lineup is the best way to start your trading day. Read it now by starting a two-week free trial to Bespoke Premium. CLICK HERE to learn more and start your free trial.
We may have all come on different ships, but we’re in the same boat now.” – Martin Luther King Jr.
Even after an ambitious $1.9 trillion stimulus plan unveiled by President-Elect Biden last night and promises for more in the future, US futures are lower this morning while US treasury yields are lower. There’s a ton of economic data coming up this morning beginning with producer prices, Empire Manufacturing, and retail sales at 8:30. Later, we’ll get reports on industrial production, and University of Michigan consumer sentiment.
It’s a three-day weekend as US financial markets will be closed on Monday in observance of the birthday of Martin Luther King Jr (his actual birthday would have been today). Enjoy the three-day weekend, because earnings season will kick into a higher gear starting next week.
Be sure to check out today’s Morning Lineup for updates on the latest market news and events, a discussion of Biden’s stimulus plan, an update on the latest national and international COVID trends (which were all positive), and much more.

Between this morning and Tuesday morning, seven of the largest US banks and brokerage firms will be reporting results. As of this writing, the four reports to cross the wires have been Citigroup (C), JPMorgan (JPM), PNC, and Wells Fargo (WFC). Of these four, all of them beat EPS forecasts while both C and WFC missed revenue estimates. In reaction, all four stocks are currently trading lower with declines of up to 3%. On Tuesday (Monday is a holiday), we’ll get reports from Bank of America (BAC), Charles Schwab (SCHW), and Goldman Sachs (GS).
Below we have provided a snapshot from our Trend Analyzer of each of the large banks reporting today and Tuesday morning showing where they are trading relative to their trading ranges. While we’re just barely halfway into the first month of the year, all seven of these stocks have posted gains that many would have been happy with for an entire year. With the exception of PNC, every other stock in the snapshot is already up over 10% YTD with GS and WFC both up over 15%!
With these strong gains in such a short period of time, though, all of these stocks are trading at short-term overbought levels, while BAC, GS, and JPM are all more than two standard deviations above their 50-day moving average heading into today’s trading. This could be one reason all four of the banks reporting this morning are trading lower even though they all topped EPS forecasts. With high stock prices also comes high expectations, so that’s something to watch in these companies as they report.

Heavily Shorted Stocks Stand Tall in 2021
By far one of the biggest movers of the past few days has been video game retailer GameStop (GME). Since last Friday, GME has risen over 96% with a 57.4% rally in Wednesday’s session alone. Today, the stock is up another 30.61% as of this writing and has reached one of the highest levels since November 2015. One likely factor behind the stock’s move has been a short squeeze of the company’s massive short base. For more than a year now, short interest as a percent of equity float has been around or well above 100%. The most recent reading as of the end of 2020 was 144.33%. In other words, there have been far more shares sold short than are available to trade. In a screen of all active stocks trading on US exchanges, we found only 18 that have more than 100% of their freely floating shares sold short, and they are all penny stocks with very small market caps.

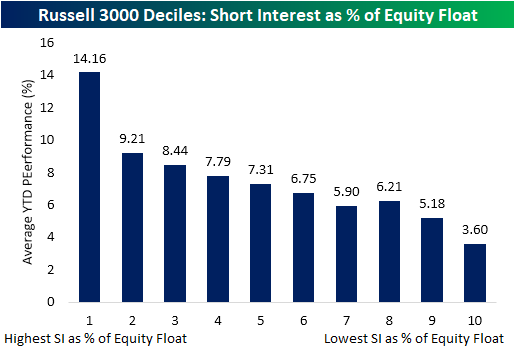
While you would be hard-pressed to find a stock with as high of short interest as a percentage of the float as GameStop, generally speaking, stocks with high short interest have been some of the top performers this year. In the chart below, we show the average YTD performance of Russell 3000 stocks broken into deciles based on their short interest. The decile of stocks with the highest short interest as a percentage of float have by far been the best performers YTD, up for an average of 14.16%. Even excluding GME, the decile’s average YTD performance is a 13.93% gain. As you move across the deciles with lower short interest levels, performance gets worse. The tenth decile of stocks which consists of stocks with average short interest levels below 1% of float has only risen 3.6% on average.
In the table below, we show the 30 Russell 3000 stocks with the highest short interest as a percentage of equity float. Across these names, they are up for an average of 15.76% in 2021, with only three not in the green: National Beverage (FIZZ), Acutus Medical (AFIB), and B&G Foods (BGS). Including GME, the largest number (7) of these most heavily shorted stocks are retailers. In fact, Dillards (DDS) and Bed, Bath, & Beyond (BBBY) both find themselves in the top 5 alongside GME. The former has over 90% of its float shorted while nearly two-thirds of BBBY’s float is sold short. Click here to view Bespoke’s premium membership options for our best research available.

Claims Make A Big Swing Higher
Overall, it was a bad week for jobless claims with both initial and continuing claims missing expectations. Initial jobless claims came in at the worst level since the week of August 21st rising to 965K versus forecasts for a jump to just 789K. That 183K increase versus last week was the largest move higher since April when claims were rising in the millions per week. Additionally, of the states that offered comments on the changes in jobless claims, many noted layoffs in industries like retail, accommodations and food services, and transportation. Despite the acceleration in the vaccine rollout, due to the fact that case counts remain near record highs and COVID restrictions remain in place, businesses and workers in the customer-facing services sectors are still feeling the pain.

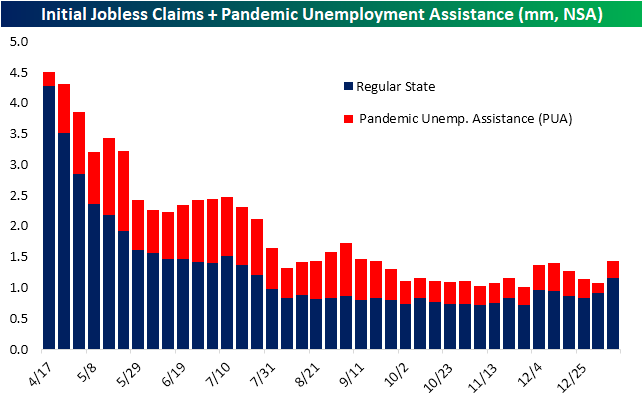
While the seasonally adjusted number managed to stay below a million, before seasonal adjustments that wasn’t the case. Initial claims by this measure came in at 1.151 million this week, the highest reading and first time above 1 million since July 30th.
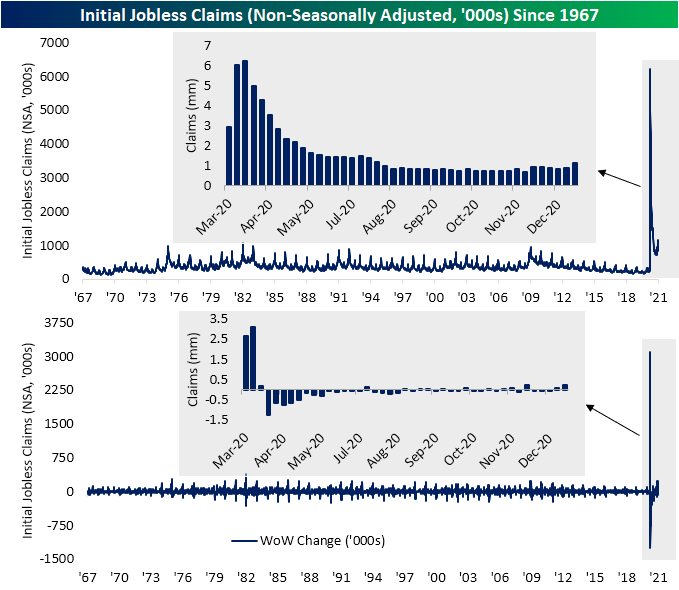
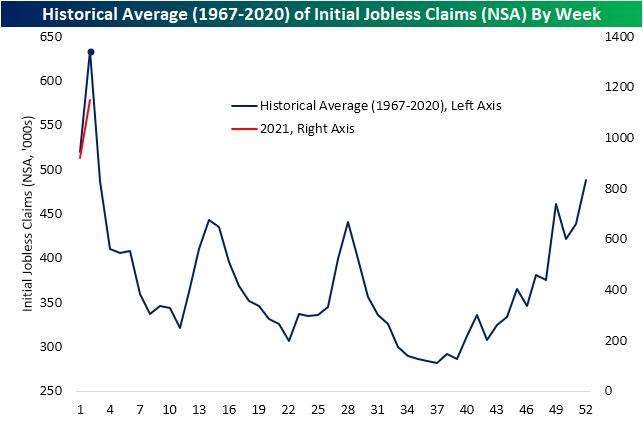
While the most recent week’s uptick is likely not all due to seasonality, as shown in the second chart below, the second week of the year usually does see a fairly large uptick in claims.
Last week we noted how PUA claims experienced a significant drop potentially due to the timing of the signing of the spending bill and the holidays. While there were yet again a handful of states unusually reporting zero PUA claims this week, total PUA claims across the nation were higher by 123.3K up to 284.47K this week. In other words, both regular state claims and auxiliary programs contributed to this week’s uptick.
Continuing claims are lagged one week to initial claims meaning this week’s increase in the initial number was not factored into the continuing claims number, but nonetheless, it was also higher rising to 5.271 million from 5.072 million. That brings claims back to around where they were in mid-December.

Adding in all other programs to regular state claims adds another week’s lag. As of the last week of 2020, total continuing claims across all programs fell to 18.422 million from 19.183 million the prior week. That number is likely to move higher given the significant uptick in initial claims this week, but another problematic aspect of total claims is the growing number of unemployed who have been out of work for a long period of time. The share of claims from extension programs like PEUC and Extended Benefits accounted for nearly 30% of the most recent week’s total claims. Click here to view Bespoke’s premium membership options for our best research available.


Bespoke’s Morning Lineup – 1/14/21 – Earnings Season Begins
See what’s driving market performance around the world in today’s Morning Lineup. Bespoke’s Morning Lineup is the best way to start your trading day. Read it now by starting a two-week free trial to Bespoke Premium. CLICK HERE to learn more and start your free trial.
“The ability to recognize that the winds have shifted and to take appropriate action before you wreck your boat is crucial to the future of an enterprise” – Andrew Grove
The President was impeached by the House for the second time in just over a year yesterday, and like the first time, financial markets were unfazed. While the President’s first impeachment in the House in December 2019 was completely on a partisan basis and dead on arrival in the Senate, this time around, the fate of the impeachment in the Senate is more uncertain. What seems certain at this point, though, is that the completion (or maybe even the start of a trial) would not take place until after the inauguration, so from a market perspective, it really doesn’t matter much.
The only economic data of note today was Jobless Claims, and both initial and continuing claims came in much higher than expected. Initial Claims spiked up to 965K versus forecasts of 786K, and Continuing Claims rose to 5.271 million compared to forecasts for 5.0 million. In terms of the market reaction to these much weaker than expected reports, there really hasn’t been any.
In terms of individual companies, although earnings season kicks off today with reports from BlackRock (BLK) and Delta (DAL), the pace of reports will remain slow today and tomorrow. Regarding today’s reports, both BLK and DAL are trading modestly higher in reaction to their reports. Also notable, although not a US company, Taiwan Semi (TSM) also reported strong results and is trading up over 2.5%.
Be sure to check out today’s Morning Lineup for updates on the latest market news and events, a discussion of the latest import and export orders from China, an update on the latest national and international COVID trends, and much more.
With yesterday’s big move in Intel (INTC), the stock is now over three standard deviations above its 50-DMA. In the last nearly 40 years, there have only been 22 other days in which the stock was as overbought or more overbought than it is today.

Swan Song Bodes Well for Intel (INTC) But for How Long?
After two years at the helm, news broke this morning that Bob Swan will be stepping down from his position of CEO of Intel (INTC). He will be replaced by VMware (VMW) CEO Pat Gelsinger on February 15th. While INTC has been a significant underperformer over the past year—it is the only semiconductor stock in the S&P 500 that is lower than it was one year ago—the immediate response from the market to today’s news has been overwhelmingly positive. As of this writing, the stock is up 8.55% which would be its best day since March of last year around the time of the bear market lows.

Though there is plenty of time left in the day for those gains to be built upon or eaten into, the opening gap was substantial. Opening at $59.50, the gap up of 11.76% was one of the largest for INTC on record. The only times since 2000 that there were larger gaps to the upside were in April of 2001 when the stock gapped up 12.64% on the 11th and 12.21% on the 18th. Going back before 2000, the only upside gap that was even larger was a 29.92% move in October of 1987, not long after Black Monday and when Intel’s stock was trading under $1 on a split-adjusted basis.

Today’s gap up on the news of a CEO change was also even larger than any move on earnings of the past nearly two decades. As shown in the snapshot from our Earnings Explorer below, the best gap up on earnings news that INTC has experienced since late 2001 was a 7.27% gap following the Q1 results of 2008.
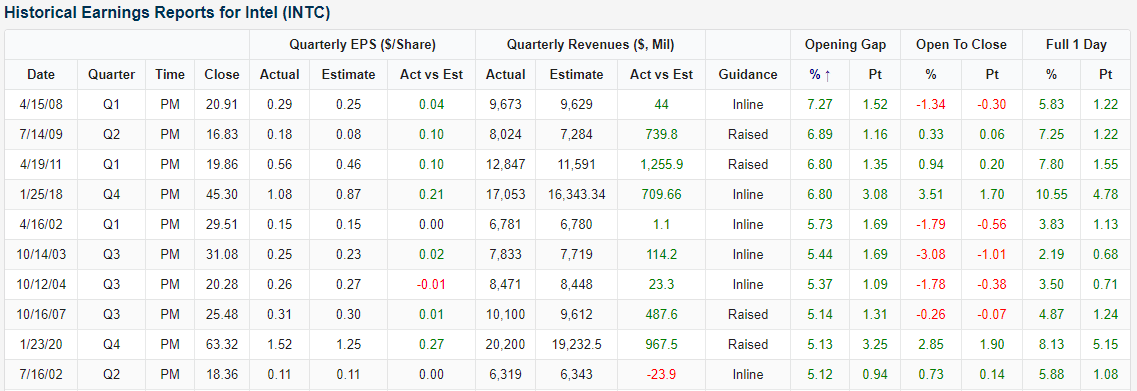
As previously mentioned, there is not much historical precedent for INTC from gaps up as large as today, but of the past four times that INTC gapped up at least 10%, performance in the weeks and months after have generally been pretty negative. The next week has usually seen some further moves higher with the only decline being the second gap up over 10% in April 2001. As for returns throughout the next year, the stock has consistently declined. Like what you see? Click here for a trial to any of Bespoke’s premium membership options.

Impeachment Indicators
The President’s first impeachment proved to be a non-event from both a political perspective and for markets. The possibility of a second impeachment is likely irrelevant to the equity market but could have significant political implications into 2024 and beyond as the Republican Party manages the post-Trump landscape.
Last night, the House passed a request for the Vice President to activate the 25th Amendment and remove the President from office. The Vice President officially declined to do so, which makes impeachment by the House likely either today or tomorrow. The House vote will largely be on party lines, but not entirely. Third-ranking Republican in the House Liz Cheney of Wyoming (daughter of former Vice President Dick Cheney) said yesterday she will vote “yes” on impeachment, and at least four others have joined her as-of this writing. We don’t have a firm estimate on the number of Republicans who will vote “yes” in the House, but we also note that Trump ally and Minority Leader McCarthy (CA) has said he will not formally whip votes against impeachment, raising the possibility that a material chunk of the Republican caucus could side with Democrats.
Of course, the real action will be in the Senate, where the state of play is quite different. While Democrat Joe Manchin of West Virginia has waffled, we think it’s reasonable to expect Democrats to vote as a bloc, delivering 50 of the 67 votes required for conviction should all Senators participate in the final vote.
A number of Republicans have expressed views that support impeachment. Romney (UT), Toomey (PA), and Murkowski (AK) are firm “yes” votes, with Romney already supporting the prior effort and the other two publicly on the record saying they would his time. Other senators including Blunt (MO), Collins (ME), Portman (OH), and Sasse (NE) have expressed openness to the idea of impeachment. Based on assessments of their public stances, we see 24 GOP Senators as “no” votes, and 18 as insufficiently committed either way.
The 7 potential “yes” votes listed above do not include Mitch McConnell, the Republican Senate’s leader. Reports yesterday from a variety of sources reported that he is ‘pleased’ with impeachment efforts, and supports the removal of the President, but at this point, McConnell hasn’t said anything publicly to support this. McConnell is a superlative parliamentary strategist and extremely effective politician. If he does in fact support removal and is willing to whip votes for it, then the 7 other potential “yes” votes will increase given the sheer number of uncommitted Senators and the potential for flips among the 24 “no” Senators. In other words, Mitch McConnell will likely decide the President’s fate, and if yesterday’s reporting is accurate, he is leaning towards impeachment. Below we summarize all 50 GOP Senators into three categories: likely yes, likely no, and no way to tell on the question of conviction.

Conviction of the President in the Senate would functionally remove him from the political scene because he would no longer be able to run for office; if convicted, only a simple majority vote would be required to prevent him from ever again seeking federal office. Therefore for 2024 hopefuls, a “yes” vote could be a simple political calculation that the damage to their primary chances is outweighed by the benefit of not being forced to face the President on the ballot. Regardless of motivations, there are enough potential “yes” votes (especially McConnell and those he would bring with him) that a conviction can’t be ruled out at this stage Also, keep in mind that If a material number of the GOP caucus members abstain from the vote in protest or for other reasons, the number of required votes for conviction drops.
As mentioned above, the possibility of a second impeachment is likely irrelevant to the equity market, especially in the short-term. Regardless of what happens in the House this week, McConnell has already noted that the earliest the Senate would start a trial would be after the inauguration when President Trump will be out of office already and raises questions of whether it is even possible to hold a trial for a President who is out of office. All these are no doubt questions that will be debated in the following days, weeks, and months. Like what you see? Click here for a trial to any of Bespoke’s premium membership options.
Bespoke’s Morning Lineup – 1/13/21 – Easy Going
See what’s driving market performance around the world in today’s Morning Lineup. Bespoke’s Morning Lineup is the best way to start your trading day. Read it now by starting a two-week free trial to Bespoke Premium. CLICK HERE to learn more and start your free trial.
“The intelligent investor is a realist who sells to optimists and buys from pessimists.” – Benjamin Graham
We’ve had a flurry of central bank officials on both sides of the Atlantic reiterate their stances that they are in no rush to start removing accommodation from the system. In Europe, ECB President Lagarde and council member Villeroy de Galhau both doubled down on their commitment to a 2% inflation target and that they will keep monetary policy loose for as long as needed in order to get the economy back into gear. These comments today follow comments from Fed Presidents Bullard and Rosengren who both also reiterated their commitments to get the economy back to its full potential.
Despite the dovish commentary, futures are modestly lower this morning ahead of the December CPI report. Outside of that report, though, the only other report of note is the monthly Budget Statement later this afternoon. On the political front, the House is expected to vote on impeachment again and at least some Republican members are expected to vote in favor.
Be sure to check out today’s Morning Lineup for updates on the latest market news and events, a discussion of the latest report on Machinery Tool Orders in Japan, an update on the latest national and international COVID trends, and much more.
Small-cap stocks have been on roll so far in 2021, but the real action now has been in micro-cap stocks. Through the first seven trading days of 2021, the Russell Micro Cap Index is up 9.4% which is the best start for the index since its inception in 2007. The only other year that was even close was in 2019 when the Micro Cap index was up 8.1% in the first seven trading days of 2021.

The chart below shows the performance of the Russell Micro Cap Index from the close on the seventh trading day of the year through year-end. For all years since 2007, the Russell Micro Cap index has seen a median gain of 11.62% for the remainder of the year with gains 64% of the time. While it’s a very small sample size, in the three prior years where the Micro Cap Index was up over 3% to start the year, the index continued higher for the remainder of the year with gains all three times ranging from 11.9% up to 38.5%.

November JOLTS: Questions & Answers
Today the Bureau of Labor Statistics updated its monthly Job Openings & Labor Turnover Survey (JOLTS). November’s data showed an uptick in layoffs and firings from a record low rate earlier in the fall. While that was some bad news, hiring has been accelerating. Private sector gross hiring was 4.5% of the labor force in August, and it’s now up to 4.7% in November. That’s a record pace of new hires for any period in the history of the series other than the immediate bounce-back from the initial COVID shock this spring. As for job openings, openings have stabilized a ways below their peak from the last cycle. So while there are lots of layoffs, the story is less negative than it might sound. Like what you see? Click here for a free trial to any of Bespoke’s premium membership options, including our nightly Closer note that regularly features economic analysis of this kind.

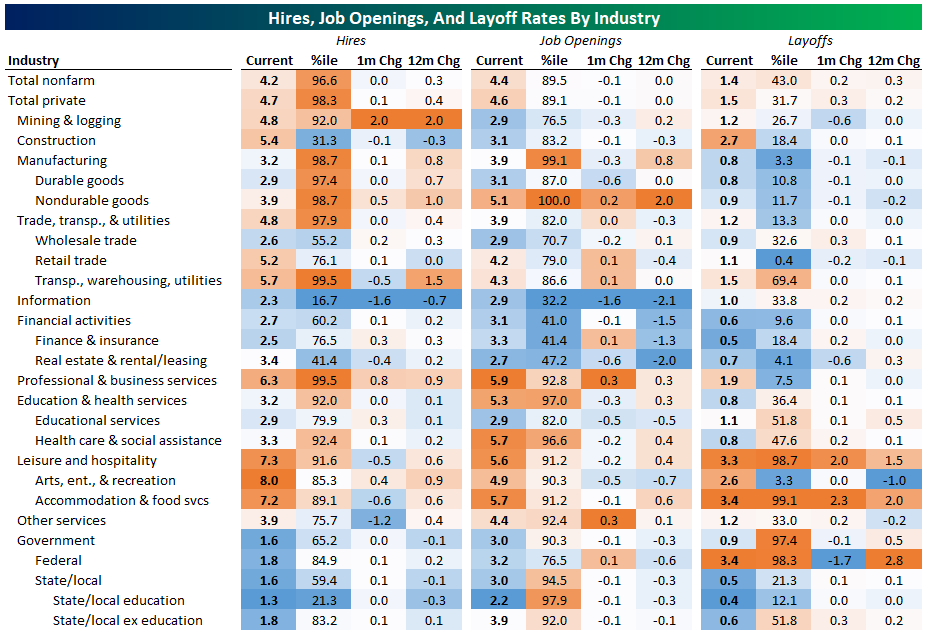
Another interesting dynamic in the JOLTS data is the industry-level results. Hires are strongest versus history in areas that you might expect given the impact of COVID: manufacturing, transportation/warehousing/utilities. Some surprising areas are very weak though: construction and information stand out. As for COVID impacts, you wouldn’t expect strong hires in accommodation and food services, but there they are. Job openings are the highest relative to history in manufacturing but are also extremely high in accommodation & food services as well as state and local education. Finally, we note that layoffs are basically consistent with COVID-driven weakness, plus the effects of Census hiring rolling off for the Federal government.