Disappointment Out of Dallas
Following very strong readings from the Philly Fed and preliminary Markit PMIs last week, the Dallas Fed’s Manufacturing report released this morning disappointed. The headline index came in at 7 compared to forecasts of a reading of 12 and last month’s adjusted reading of 10.5. That reading is still consistent with overall growth in the region’s manufacturing sector, but at a slower pace as the index fell to the lowest level since August.

The index for General Business Activity was far from being the only one to fall month over month. As shown below, breadth in this month’s report was terrible. Of the 17 different indices for current conditions, 13 fell month over month. That brought several of these readings from the top decile of historical readings down to the middle of their historical ranges. While the pullbacks were significant, only inventories remain in contraction. Meanwhile, breadth was a little bit better for the indices for future expectations.
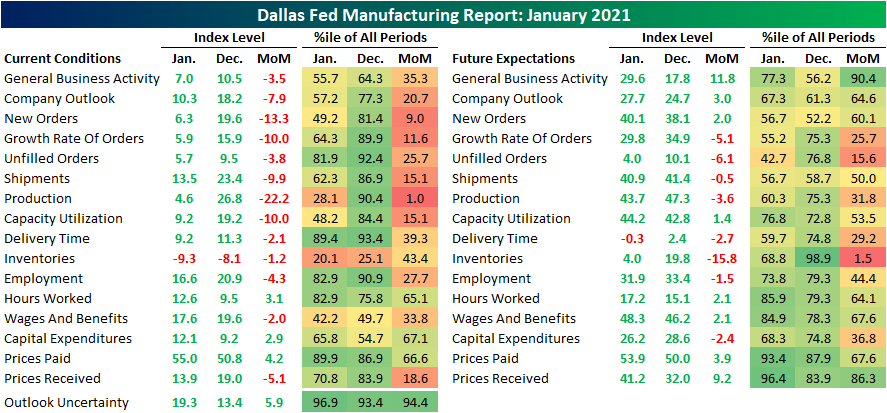
One area that saw declines across the board were the indices concerning demand. As shown below, the indices for New Orders, New Order Growth Rate, Unfilled Orders, and Shipments were all lower in January. All of these are now at the lowest levels since June, or July in the case of order growth rate. These lower readings are still indicative of growth, but at a slower rate.

Just as we have seen in other recent manufacturing reports, survey respondents are reporting price increases. The index for prices paid rose to a reading of 55 from 50.8 in December. That is nearly in the top decile of all readings as the index sits at the highest level since April of 2011. The index for future expectations similarly ticked higher reaching its highest level since March of 2012.
While prices paid were higher, the same sort of acceleration in prices was not observed for prices received. The index for prices received fell from 19 down to 13.9. Although lower month over month, that is still around some of the highest levels of the past couple of years. Additionally, expectations are calling for prices received to follow the path of prices paid. The index for future prices received rose to the highest level since 2017 which was also in the top 5% of all readings.

Similar to prices received, the current conditions index for wages and benefits fell this month, but the index for future expectations rose much more sharply and to one of the highest readings of the past couple of years. In other words, although price hikes were not observed, they are foreseen on the horizon. For wages and benefits, that expected uptick comes as hiring continues with the index of employment remaining in expansionary territory. Additionally, hours worked rose this month from 9.5 to 12.6; the highest in September of 2018. Click here to view Bespoke’s premium membership options for our best research available.

Bespoke’s Morning Lineup – 1/25/21 – More Crazy Moves Beneath the Surface
See what’s driving market performance around the world in today’s Morning Lineup. Bespoke’s Morning Lineup is the best way to start your trading day. Read it now by starting a two-week free trial to Bespoke Premium. CLICK HERE to learn more and start your free trial.
“It’s not how much money you make, but how much money you keep, how hard it works for you, and how many generations you keep it for.” – Robert Kiyosaki
It’s a mixed picture in futures markets this morning as the S&P 500 is set to open marginally higher while the Nasdaq is indicated up about 1%. At the individual stock level, the crazy moves of last week are continuing today as GameStop (GME) is up over 50% again, and a number of other high short interest and story stocks are trading up sharply in the pre-market. Economic data is on the light side this morning with just the Chicago Fed National Activity Index and the Dallas Fed Manufacturing Index.
Be sure to check out today’s Morning Lineup for updates on the latest market news and events, German sentiment data, an update on the latest national and international COVID trends, and much more.

The year is just three weeks old, but already we’ve seen some big moves in individual sectors. With its gain of 11%, the Energy sector has stolen the show, but the 5% gain in the Consumer Discretionary sector is nothing to sneeze at either. On the other end of the spectrum, Consumer Staples has already given up 3.8% this year while Industrials is down just marginally (-0.2%). The broader S&P 500 as a whole is up a respectable 2.3% on the year, and four other sectors – Materials, Financials, Technology, and Telecom Services – all have YTD gains within half of one percent of the overall market.

The gap of nearly 15 percentage points between the best and worst-performing sectors so far this year is one of the larger ones we have seen through the first 14 trading days of a year dating back to 1990. As shown in the chart below, just three years (2009, 2001, and 2000) have seen larger disparities to start the year while a number of other years have seen disparities nearly but not quite as wide as the one this year (1992, 1999, and 2006).

Bespoke Brunch Reads: 1/24/21
Welcome to Bespoke Brunch Reads — a linkfest of the favorite things we read over the past week. The links are mostly market related, but there are some other interesting subjects covered as well. We hope you enjoy the food for thought as a supplement to the research we provide you during the week.
While you’re here, join Bespoke Premium with a 30-day free trial!
Alternative Energy
Batteries Hidden Across New York Give the City a Backup Boost by Dimitra Kessenides (Bloomberg)
With disruptive natural disasters on the rise and battery prices on the fall, “microgrid” battery power facilities can be shoehorned in to cities like NYC to provide a backup to the traditional power grid. [Link; soft paywall]
Money Managers Look to Blue Seas for Green Investments by Julie Steinberg and Joe Wallace (WSJ)
As green energy capex scales up, investors are diving into all corners of production to try and make a buck, including owning and financing the ships which build and service offshore windfarms. [Link; paywall]
Chilly This Winter? Cozy Up to the Computer That’s Mining Bitcoin by Sarah E. Needlemen (WSJ)
Bitcoin mining operations are extremely power intensive and as a result of their massive processing activity send off huge amounts of heat. That byproduct is being repurposed to keep pets, vegetables, or even whole houses warm. [Link; paywall]
Housing
The Housing Market Boom Gets Another Boost From Biden by Conor Sen (Bloomberg)
Fiscal stimulus gives households who might not have the chance at owning a home a shot at cobbling together a down payment, with the possibility of reducing student loan burdens another tailwind for home buyers. [Link]
Scholarly Pursuits
The evolution of the Offshore US-Dollar System: past, present and four possible futures by Steffen Murau, Joe Rini, and Armin Haas (Journal of Institutional Economics)
A helpful review and primer of the mechanical foundations of the global financial system, focused on the role of the offshore US dollar market. [Link]
Platform Civics: Facebook in the Local Information Infrastructure by Kjerstin Thorson, Mel Medeiros, Kelley Cotter, Yingying Chen, Kourtnie Rodgers, Arram Bae, and Sevgi Baykaldi (Digital Journalism)
This paper uses quantitative and qualitative methods to identify what happens when Facebook replaces local media, with unsurprisingly toxic results. [Link]
History
What We Found in Robert Caro’s Yellowed Files by Dan Barry (NYT)
An amazing trip through the office of legendary biographer of Robert Moses and LBJ, including a fascinating anecdote about the desk that cured his bad back. [Link]
Investing
Up Is Good. Down Is Bad. by Jason Zweig (CreateSend)
Making the case that much-derided (in professional circles, anyways) traders are in fact pursuing the same sort of strategies that “fancy” quantitative investors do. [Link]
Data Security
Intel says hacker obtained financially sensitive information by Richard Waters (FT)
Hackers were able to access an infographic that was part of Intel’s earning release, forcing the company to publish the whole kit and kaboodle before the market closed. [Link; paywall]
COVID Vaccination
Israel COVID-19 ‘R’ reproduction number dips below 1 in first since vaccine drive (Reuters)
With more than one-quarter of the country vaccinated, the fastest vaccine effort in the world has helped push the previously raging COVID pandemic down in Israel. [Link]
Career Changes
Neuberger Berman’s Segal Is Retiring to Teach High School by Miles Weiss (Bloomberg)
A Neuberger fund manager that has held his seat since 1999 is retiring to pursue a masters in teaching and eventually working as a math teacher in New York. [Link]
Pay Your Lawyers
German online retailer Mytheresa valued at $3bn after US listing by David Carnevali and Sujeet Indap (FT)
Neiman Marcus acquired German online retailer Mytheresa for $200mm back in 2014, and now sits on a an impressive gain after the investment was kept remote from creditors during the company’s bankruptcy. [Link; paywall]
Read Bespoke’s most actionable market research by joining Bespoke Premium today! Get started here.
Have a great weekend!
Impressive Reading From The Philly Fed
Of the several strong economic data points to have been released today, perhaps the strongest relative to expectations was the Philadelphia Fed’s monthly survey on the region’s manufacturing sector. The headline index was expected to rise from 11.1 to 11.8. Instead, it more than doubled expectations rising to 26.5. That is the highest reading since last February just before the pandemic’s full impact was felt. Overall, the report showed the region’s manufacturing sector experienced strong growth in January with accelerating growth in demand, prices, and employment.

In the table below, we break down the various sub-indices of the report. Nearly every component experienced a month over month increase that ranks in the top few percentiles of their respective histories. That also left most indices in the top decile of their historic ranges. That compares to last month in which most readings were far more moderate. Although most indices for current conditions saw impressive readings, the indices for expectations were much more mixed with a larger number falling than rising MoM. Given every one of these indices remains positive, though, the region’s manufacturers still have an overall optimistic outlook.
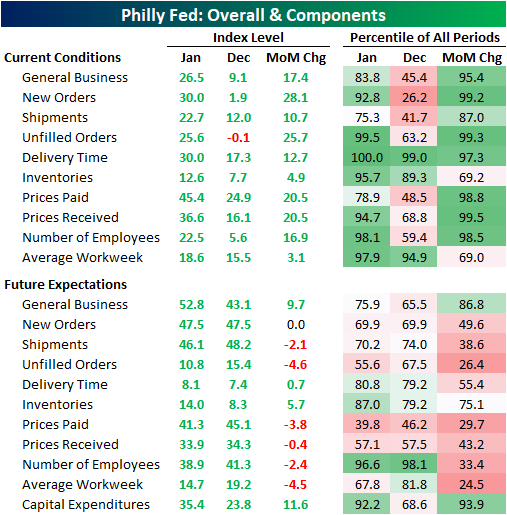
Of all the sub-indices, the New Orders index saw one of the most significant increases in January rising 28.1 percentage points from a barely expansionary reading of 1.9 to a much stronger reading of 30. Going back over the past couple of years, the only times this index was higher was in October (32.9) and February (30.7) of last year. That indicates very strong new order growth after a slowdown in December.
Similarly, the index for unfilled orders was the only index in contractionary territory (those below zero) last month, but there was a massive improvement this month as the index surged to a reading of 25.6. Both the level of the index and the monthly change stand in the top 1% of all readings going back through the history of the survey which began in 1968. The only times the index has been higher was in August of 1972 (26) and January (29.6) and March (45.1) of 1973. In other words, New Orders remain strong while Unfilled Orders are bouncing back at a historic rate,

While the unfilled orders index reached one of the highest readings on record, the index for Delivery Times actually hit a new record. The index rose 12.7 points to a record high of 30; surpassing the previous record of 21.3 from October of 2017. Higher readings in this index indicate that supplier lead times are longer and vice versa for lower readings. That means a historic number of respondents are seeing delays in their supply chains.

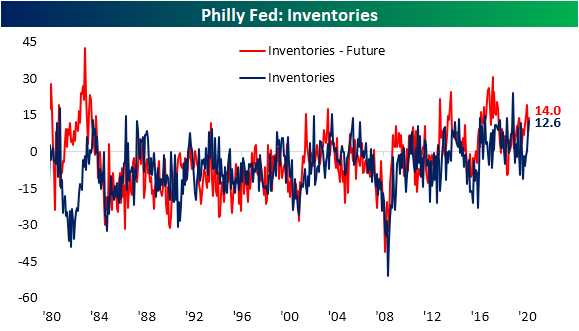
Perhaps to get ahead of the growing demand and longer lead times, businesses are also reporting higher inventories. That index rose to the highest level since September of 2019 which also stands in the top 5% of all readings in the history of the data.
Given the stronger demand and tighter supply lines, prices have also been accelerating. Both Prices Paid and Prices Received experienced some of their largest monthly increases on record after rising 20.5 points in January. At 45.4, the index for Prices Paid is at its highest level since August of 2018. Those price increases are also getting passed along to customers as the index for Prices Received is at the highest level since February of 1989. These results echo some other hints of more inflationary conditions like the New York Fed’s readings last week and the ISM services and manufacturing report earlier this month. Click here to view Bespoke’s premium membership options for our best research available.

Housing Closes Out 2020 on a Positive Note
Housing closed out 2020 on an extremely positive note as both Housing Starts and Building Permits topped forecasts by more than 100K. Since 2002, there have only been ten other months where both reports topped forecasts by more than 100K, and today’s report was the third time it happened in the last 12 months!
The table below breaks down the details of the December report in terms of both single and multi-family units and regions. One of the clear areas of strength was in single-family starts and permits. On a y/y basis, both were up over 25%, and relative to November, starts were up 12% while permits rose 7.8%. Multi-family units, meanwhile, both saw declines with notable weakness in multi-family starts. On a regional basis, most areas of the country saw strength although starts and permits were down m/m and y/y in the Northeast.

Given its overall size, you can easily make the case that as goes the housing market, so goes the economy, and history tends to bear this out. The top chart shows the 12-month average of Housing Starts going back to 1967 with recessions overlaid in gray. With the exception of the latest downturn, every prior recession was preceded by a rollover in Housing Starts. Given the sudden onset of the pandemic, housing played no role in the current recession, but once the lockdowns started, the residential housing market wasn’t immune to the weakness. Whatever weakness there was didn’t last long. As shown in the second chart below, less than a year after the recession started, both the 12-month average of Housing Starts and Building Permits have now moved back above their pre-pandemic highs.


While Housing Starts and Building Permits are both at new multi-year highs, on a population-adjusted basis, they’re still closer to levels typically associated with recessions than expansions. After adjusting for population growth, Housing Starts would need to come in above 1.9 million just to keep up with population growth.

As for the stocks of homebuilders, the performance of the iShares Home Construction ETF (ITB) tends to track trends in Housing Starts and Building Permits pretty closely, so it’s no surprise that it also traded to a new all-time high on Thursday for the first time in three months. As long as interest rates don’t see a sudden spike higher, trends in place for the residential housing market remain positive. Click here to view Bespoke’s premium membership options for our best research available.


Moderating Sentiment
Last week, there was a reporting error in weekly sentiment from the AAII. To account for this, the previous week’s readings (week of January 7th) have been adjusted. This week, reporting is back to normal with bullish sentiment coming in at 42.5%. That is down from the prior adjusted reading of 45.2%. Bullish sentiment has now fallen twice in a row and is at the lowest level since the first week of November. Granted, that is still elevated at 4.5 percentage points above the historical average.

While bullish sentiment has declined, bearish sentiment has been on the rise. Bearish sentiment rose to 34.5% from 31.7% in the most recent week. That is the highest level of bearish sentiment since the end of October. Just like bullish sentiment, it is also slightly above the historical average reading in the bearish sentiment of 30.6%.

With the inverse moves in bullish and bearish sentiment, the bull-bear spread has continued to moderate. This week it sits at 8 which is the lowest reading since the first week of November. Even though it has moved lower, this week was the eleventh consecutive week in which the spread was positive meaning bullish sentiment has outweighed bearish sentiment. This week’s reading is slightly higher than the historical average reading of 7.35 indicating that overall sentiment continues to favor optimists but not to as historically extreme of a degree as the past couple of months.

With bullish and bearish sentiment experiencing nearly identical sized moves, neutral sentiment went little changed this week falling 0.1 percentage points. At 23%, neutral sentiment has declined in back to back to back weeks and is now at the lowest level since the week of November 12th when it dipped below 20%. Click here to view Bespoke’s premium membership options for our best research available.

Claims Breathe A Sigh of Relief
Initial jobless claims have been on the rise over the past couple of months with last week’s original reading of 965K marking the highest level in claims since August. While claims remain well above where they have been over the past several months, there was a significant improvement this week. Not only was last week’s number revised down to 926K, but claims for the current week also dropped down to 900K instead of the forecasted reading of 935K.
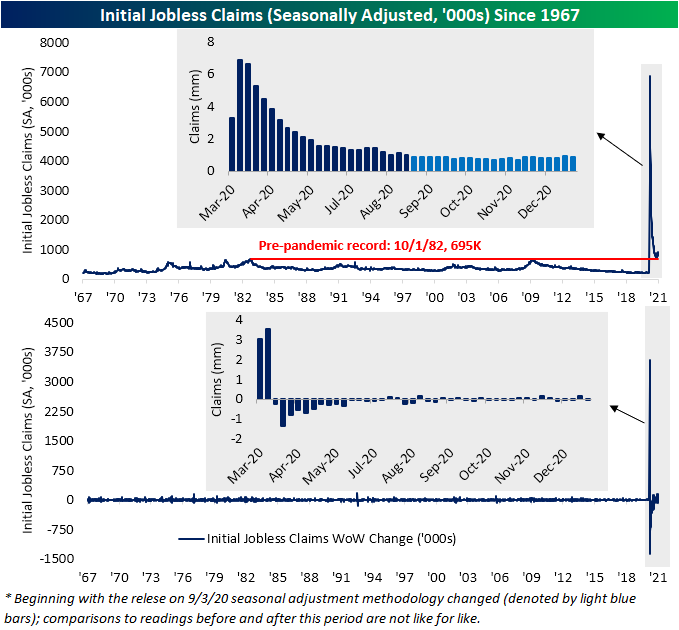
That improvement was echoed in the non-seasonally adjusted number which fell to 960.7K after rising back above 1 million last week. Again, although that is an improvement, the level of claims still remains at an elevated level relative to the past several months.
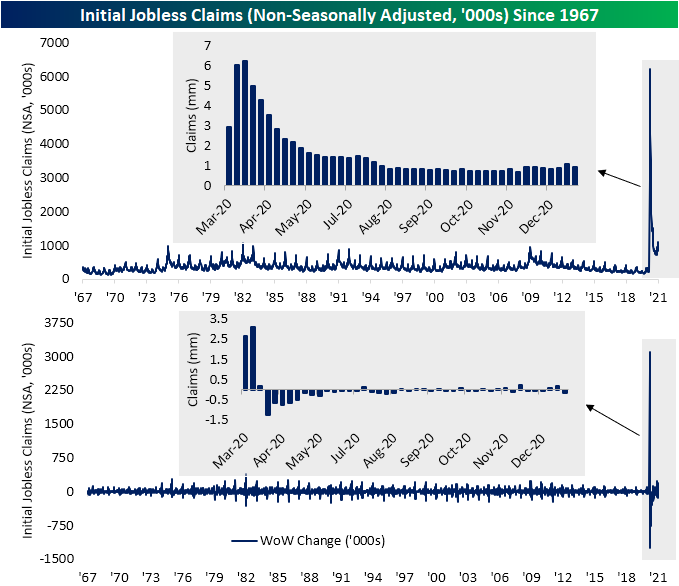
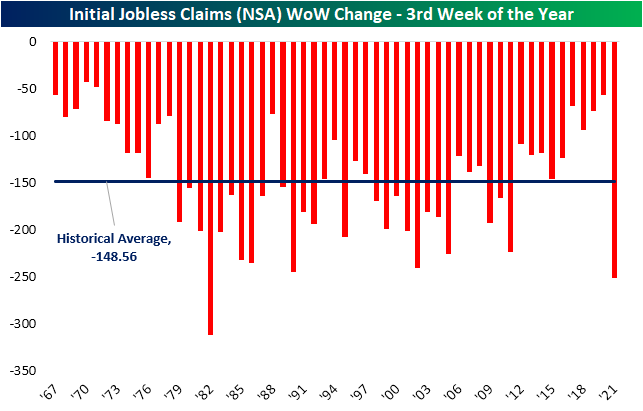
Additionally, looking at seasonality it should come as absolutely no surprise that unadjusted claims were lower week over week. As shown in the chart below, since the data begins in 1967 there has not been a single year in which the current week of the year (3rd) did not see claims move lower.
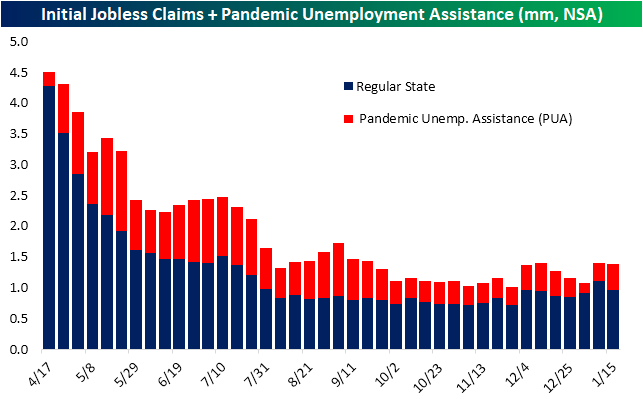
Factoring in other programs, namely Pandemic Unemployment Assistance (PUA), the improvement was much less impressive. Total claims did fall but only from 1.397 million down to 1.384 million. That means a large uptick in PUA claims made up the difference for the drop in regular state claims. PUA claims rose from 284.9K last week to 423.73K this week. That was the highest reading in PUA claims since the week of December 11th. As we have noted in recent weeks, there have been some irregularities in the reporting of PUA claims on a state-by-state basis likely as a result of the timing of the signing of the recent spending bill. That larger uptick this week could be some catchup from lapses in the past few weeks.
Lagged one week to initial jobless claims, continuing claims likewise made a move lower that exceeded expectations in the most recent week. The previous week’s number was revised down to 5.181 million from 5.271 million. This week, claims were expected to tick higher up to 5.3 million. Instead, claims dropped down to 5.054 million; a new low for the pandemic.

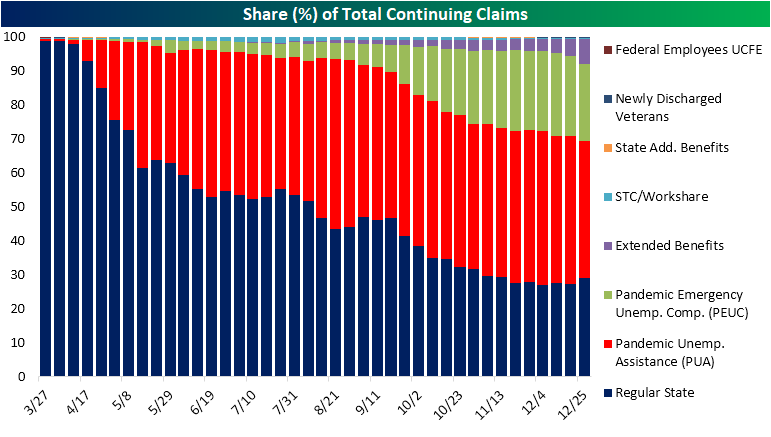
The most recent week’s data available for continuing claims across all programs is for the first week of 2021. To start off 2021, total claims across all programs dropped sharply from 18.442 million down to 16.028 million. Taking a closer look at that week, regular state claims had risen 384.7K which was offset by big declines in PUA and PEUC programs, each of which fell by well over 1 million. While at first glance that may seem like a major improvement, we would note that there likely is a bit more nuance in the decline. More likely, that decline had to do with a mix of issues with reporting around the holidays and the timing of the spending bill which had extended these programs originally slated to expire at the end of 2020. Click here to view Bespoke’s premium membership options for our best research available.

Homebuilder Sentiment Disappoints
The NAHB’s reading on homebuilder confidence was expected to go unchanged at a very strong reading of 86 in January. Instead, the NAHB’s headline index fell down to a reading of 83. Although that is lower, it remains well above any pre-pandemic reading. In other words, homebuilders are less confident than they have been in the past couple of months but sentiment remains overwhelmingly positive.

Even after falling two months in a row, the overall market index and most of its sub-indices remain near record highs. As for the regional indices, there is a bit more variation. The index for the Northeast has seen the sharpest decline falling 10 points in January. That is tied with August of 2018 for the seventh-largest month over month decline on record. While still in the top decile of historical readings, it is far lower than the other regions. On the other hand, albeit lower, the Midwest and the West are the two regions that remain at the highest ends of their historical ranges.


With earnings season underway, the next month will see the vast majority of the S&P 1500 homebuilder stocks report earnings. The snapshot below is from our Custom Portolfios tool. This should give more color to the overall picture for homebuilders. As for the companies reporting, only one, MDC Holdings (MDC) has averaged a full day decline in response to earnings. Additionally, historic beat rates are generally pretty strong across the board. Click here to view Bespoke’s premium membership options for our best research available.

New Highs for Purchase Applications
One of the few economic data points released today was weekly mortgage applications from the Mortgage Bankers Association (MBA), and the data was positive. Seasonally adjusted purchases rose 2.7% week over week to the highest level since the last week of November of 2008. That eclipses the previous high of the cycle from late November of last year.
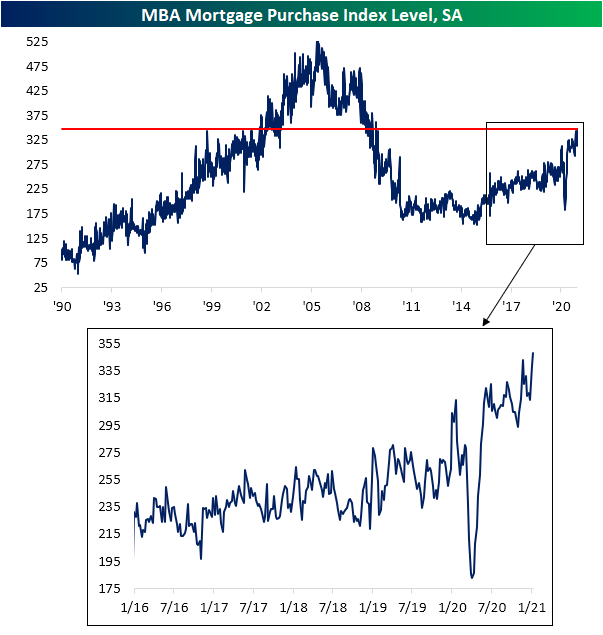
On an unadjusted basis, the average level of mortgage purchase applications is off to its strongest start to a year (through the first three weeks) since 2008. As shown in the second chart below, the seasonal bottom for purchase applications typically occurs at end of each year. With that now in the rearview, purchases have been following the seasonal trend higher. This increase typically lasts throughout the rest of winter and peaks in the spring (usually in late April/early May as indicated by the blue dots). So far in 2021, purchase applications are not only following that seasonal pattern but are also running at a stronger pace than other years of the past decade.


While purchase applications were stronger, refinance activity took a step back in the most recent week. The Refinance index dropped 4.72% week over week. Although that is lower, outside of last week it is still at some of the highest levels since last March’s spike higher. That is also around levels not seen since the spring of 2013.

In terms of related stocks’ reaction to this data, initially this morning, that stronger reading in mortgage purchases led mortgage REITS as proxied by the iShares Mortgage Real Estate ETF (REM) to nearly break out from the past couple of month’s range. but the rally was stopped in its tracks by the release of the weaker than expected homebuilder sentiment reading from the NAHB. Meanwhile, perhaps a bit ironically, the S&P Homebuilders (XHB) have continued to rally, rising 2.37% to a new 52-week high.Click here to view Bespoke’s premium membership options for our best research available.


Presidential First Days
It’s Inauguration Day, and so far equities are welcoming in the new administration with a gain of more than 1% for the S&P 500 (SPY). As to how that compares to the first day of past presidencies, in the chart below, we show intraday performance on Inauguration Day since the start of Reagan’s second term in the mid-1980s when our intraday data begins. Excluded are the inaugurations for George W. Bush’s first term and Obama’s second term considering these fell on days that the market was closed; a Saturday in the case of the former and MLK day for the latter.
The second inauguration for Ronald Reagan was met with the strongest performance for the S&P 500 as the index steadily drifted higher throughout the day to rise 2.28% by the close. With the S&P 500 up over 1% today, it is on pace for the best Inauguration Day performance since then. On average across all of these days, the S&P 500 has typically traded lower throughout the session with a leg lower in the early morning and another towards the end of the day (second chart). Breaking performance down by political party, inaugurations for Republican administrations have averaged a move higher with a bit of a dip midday while performance during inaugurations of Democrats has been weaker. Much of this weakness, however, is due to Obama’s first inauguration which came during the throes of the financial crisis.


As for the ushering in of a new administration or four more years of the same, performance has also tended to be quite different. As shown below, a president’s first inauguration over the past few decades has resulted in the S&P 500 dropping an average of 1.36% by the end of the day as the index steadily trades lower throughout the session. Again, much of this weakness can be attributed to the sharp decline on the day of Obama’s first inauguration. Conversely, the second inauguration of a president has seen the S&P 500 steadily trade higher. Click here to view Bespoke’s premium membership options for our best research available.
