March Housing Data Rebounds
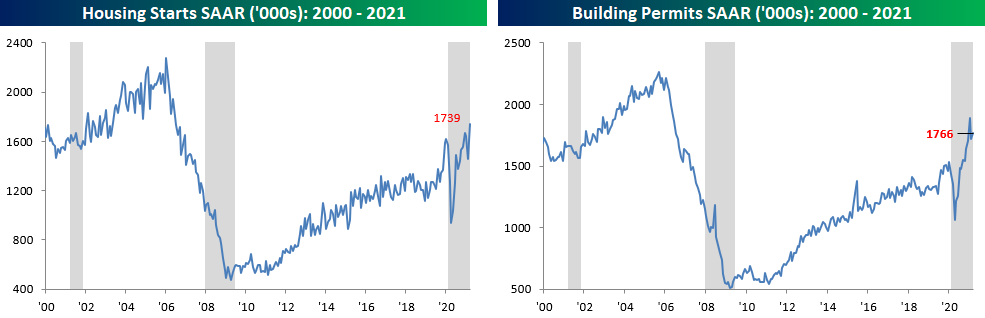
Data on Housing Starts and Building Permits for the month of March came in better than expected on Friday morning. That provided some relief to the concerns that surfaced from February’s weak and weather-impacted report. With March’s rebound, Housing Starts are now back at their highest levels since 2007. Building Permits still remain below January’s peak but also managed to rebound.
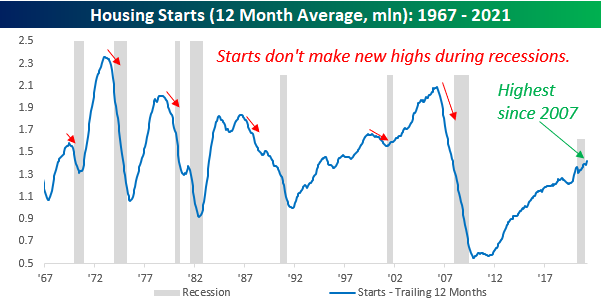
We pay a lot of attention to trends in residential real estate because it is such a large part of the US economy, and therefore has done a good job tracking trends in the overall economy. The chart below shows the 12-month average of Housing Starts relative to recessions going back to 1967. Looking at the chart, it’s easy to see how leading up to every prior recession, Housing Starts always started to roll over in advance of the recession. That didn’t happen leading up to the current recession, but given the suddenness of the contraction, there was really no way to anticipate it. Conversely, coming out of prior contractions, the recession was usually over before the 12-month average started to rebound. Here again, the current recession re-wrote the script. Not only did starts never meaningfully rollover, but they are also back at new post-financial crisis peaks. In the periods leading up to, during, and now after this current recession (even though the NBER hasn’t officially called, the COVID recession is over), the patterns of Housing Starts looks nothing like the trends we have seen in prior periods.
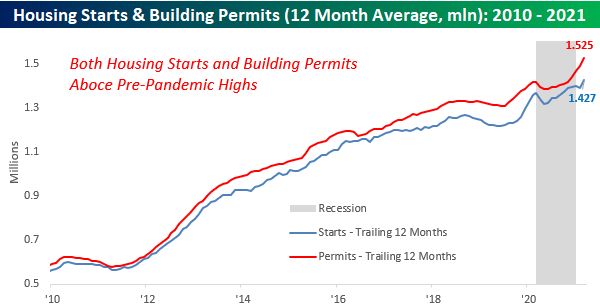
Taking a closer look at the current period, the chart below shows the 12-month average for Housing Starts and Building Permits going back to 2010. While Permits weren’t as strong as Starts in March, their 12-month average is actually considerably higher as both series climbed to new post-housing bubble highs.
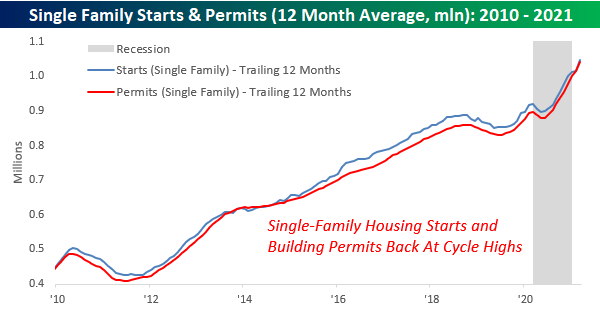
Within both the Housing Starts and Building Permits data, we have also broken out the trends in single-family units. In terms of their economic impact, single-family units are thought to have more of an economic impact than a multi-family unit. Here again, the current trend remains positive as both series reached their highest levels of the post-financial crisis period in March. Click here to view Bespoke’s premium membership options for our best research available.
Bespoke’s Morning Lineup – 4/16/21 – On the House
See what’s driving market performance around the world in today’s Morning Lineup. Bespoke’s Morning Lineup is the best way to start your trading day. Read it now by starting a two-week free trial to Bespoke Premium. CLICK HERE to learn more and start your free trial.
“It all comes down to interest rates. As an investor, all you’re doing is putting up a lump-sum payment for a future cash flow.” – Ray Dalio
The anti-gravitational pull higher in equities has continued this morning as some modest weakness in futures overnight has reversed with all of the major averages now looking to open in the green. Housing data has the spotlight this morning, and both Housing Starts and Building Permits topped consensus expectations. The latter saw only a small beat relative to expectations, while the former exceeded forecasts by more than 100K (1739K vs 1611K). The only other indicator on the calendar between now and the weekend is Michigan Confidence.
Read today’s Morning Lineup for a recap of all the major market news and events including a recap of the biggest overnight events including some key earnings reports, international economic data, as well as the latest US and international COVID trends including our vaccination trackers, and much more.

We’re already hard at work on this week’s Bespoke Report, but this morning we wanted to provide a quick update to a chart from last week’s report. The annotated chart below shows the yield on the 10-year US Treasury on an intraday basis over the last 15 trading days. Along with the move in yields, we’ve also annotated the chart with the releases of some key economic indicators over that time period. So, let’s recap them for you.
On 3/30, Consumer Confidence saw its biggest beat relative to expectations since at least 2000 and the third largest m/m gain on record. On 3/31, the Chicago PMI was the strongest since July 2018. The next day (4/1), the ISM Manufacturing report came in at the highest level in decades. The equity market was closed for Good Friday on 4/2, but Non-Farm Payrolls came in more than a quarter of a million above forecasts. The following Monday on 4/5, the ISM Services report, which goes back to the mid-1990s, came in at the highest level on record. After 4/5, there was a bit of a lull in the data, but last Friday (4/9), PPI saw its largest y/y increase since 2011 while this week’s CPI saw the largest m/m increase since 2009. Finally, in yesterday’s data dump, Jobless Claims dropped to their lowest level of the pandemic, Retail Sales came in at nearly twice consensus expectations with the second-largest m/m increase on record, and both the Philly and NY Fed Manufacturing indices surged.
With all of this great data following a period where the market was freaking out over interest rates, you could have expected to see a big jump in rates, but instead, we’ve seen the complete opposite with the yield on the 10-year at its lowest level since February. As Peter Lynch once said, “Nobody can predict interest rates”, or for that matter, “the future direction of the economy or the stock market.”

Homebuilder Sentiment In The Doldrums
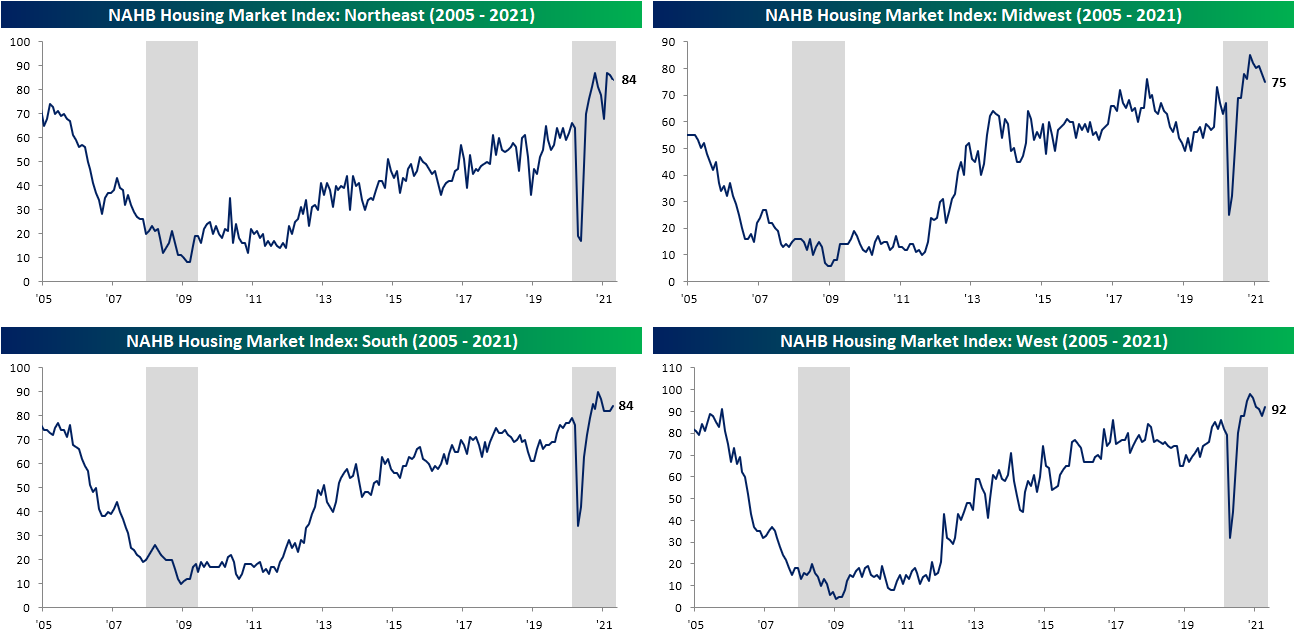
While housing data is still running hot, recently it has hit a bit of a rough patch as indicators like weekly purchase applications have shifted lower (we noted some of the reasons for this in last night’s Closer). This morning’s release of homebuilder confidence gave further pause. The NAHB’s Housing Market Index measuring homebuilder confidence rose by one point to 83 in April. Albeit higher month over month, the index has been in a couple of point range over the past few months and several points off the record high of 90 from November. While that range is still above any levels observed prior to the past year, it shows homebuilders are still optimistic but less so than last year.

Of the three indices contributing to the headline number, Present and Future sales have been a bit stagnant while Traffic has experienced a much more notable rise. That index has risen to 75 which is the highest level since the record of 77 in November. In other words, there still appears to be demand but it is not translating directly into sales.

Breaking down sentiment by geographic region shows varying levels of optimism. Starting with the bad news, sentiment in the Midwest is the worst having fallen without much respite over the past several months. Meanwhile, the Northeast has also continued to pull back but sits just off the record highs of 87 from November and February. The South and West, on the other hand, both rebounded in April but remain further off their prior highs. Click here to view Bespoke’s premium membership options for our best research available.
Explosive Empire
Manufacturing businesses in the New York area are roaring back to life this spring. After some readings showing only modest growth at the end of 2020 and at the start of this year, the New York Fed’s monthly manufacturing survey results released this morning showed the headline index rising to 26.3 which is the strongest level since October 2017. That indicates the region’s manufacturing sector is growing at a rapidly accelerated rate. In fact, only 12.2% of businesses reported worse overall business conditions in April which is the lowest level in nearly a decade (since May of 2011).
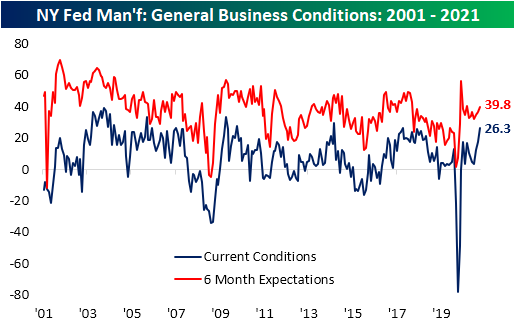
Given the strong reading in the index of General Business Conditions, every other area of the report also showed impressive readings. For the current conditions indices, every index is in expansionary territory with higher month-over-month moves. Some of these like those for Delivery Times, Prices Received, Prices Paid, and Unfilled Orders are also at or just off record highs after massive moves higher in the past month. Expectations generally remain positive although some indices are at less extreme places within their historical ranges while three of the indices were also lower versus March.

Beginning with a look at demand and production metrics, New and Unfilled Orders both surged in April rising 17.8 and 17.2 points, respectively. For New Orders, that month over month rise stands in the top 5% of all monthly moves and brings the index to its highest level since October 2009. That compares to last month when the index was essentially in the middle of its historical range. Meanwhile, Unfilled Orders had been elevated even before this report, but with the most recent surge in New Orders, Unfilled Orders are now at the second-highest level on record behind the reading of 36.5 from September 2001 when the fulfillment of existing orders was likely impacted by the September 11th attacks.
While demand has been very strong, firms have seen no lack of trying to fulfill those orders. Inventory levels were notably higher as that index rose to 11.6 which is in the top 2% of all readings and the highest since last February. The index for Shipments rose 3.9 points to 25 which is the highest level since August 2018. While that is a historically healthy reading, given the surge in unfilled orders and inventories it does indicate that the region’s manufacturers still have plenty of product to get out the door.

One likely reason for the weaker reading in shipments relative to orders and inventories is record length in delivery times. That index not only experienced the second-largest increase of any month on record (behind September 2001), but it also reached the highest level ever. At 28.1, the index surpassed the previous record by 11.9 points.

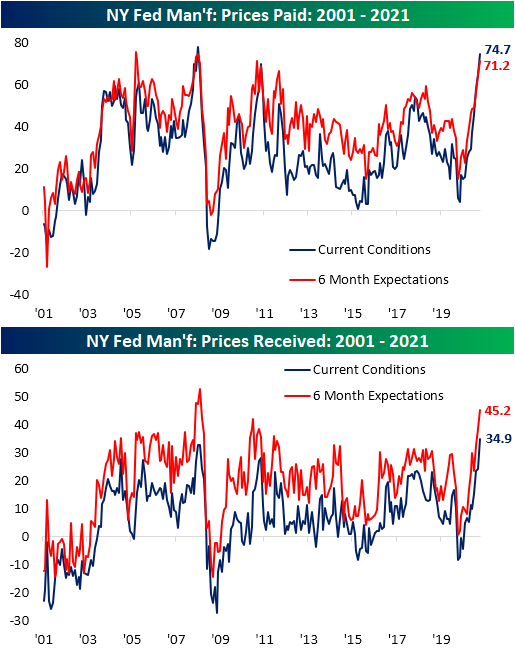
On top of—and likely because of—those supply chain disruptions, prices continue to rise at a record clip. Prices Paid came in at the second-highest level on record behind July 2008. Those price increases are also being passed onto customers as Prices Received rose to a record high. Additionally, businesses do not appear to see much of a chance for these trends to reverse as six-month expectations are also at very high levels.
After a very strong nonfarm payrolls report at the start of the month and on the same day that initial jobless claims came in at a new low for the pandemic, this report also gave a rosy outlook for the labor market. The index for the Number of Employees was higher alongside Average Workweek meaning businesses took on more employees and increased hours for existing workers, but the real move was in expectations. Expectations for Number of Employees ripped higher to a new record of 40.1. That willingness to hire paints a very optimistic picture for the region’s labor market.
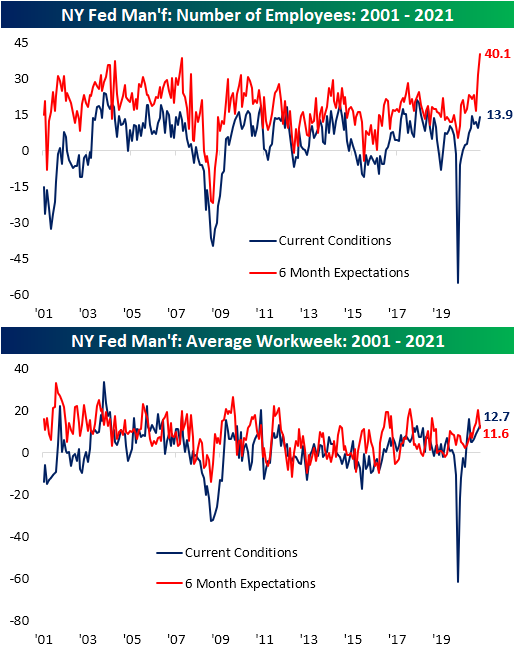
That sort of optimism extends beyond the workforce though. Six-month expectations for Capital Expenditures and Technology Spending were also higher, rising to the top 15% of all readings. Click here to view Bespoke’s premium membership options for our best research available.

Hard to Hate This Week’s Claims
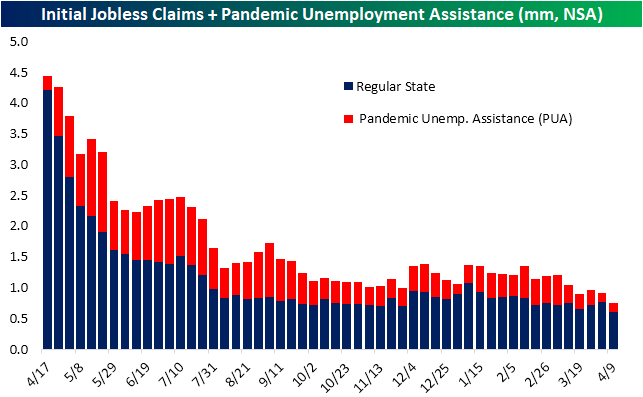
Among the many strong economic data points out this morning, jobless claims was one of the more impressive ones. Last week’s print was revised upwards to 769K from 744K. This week’s number was anticipated to fall back down to 700K, but the actual results were far better as seasonally adjusted initial claims fell by 193K to a pandemic low of 576K. That is the biggest one-week drop since a 219K decline at the end of July. Additionally, this week’s decline also brings claims back below the pre-COVID record high of 695K from October 1982.

On a non-seasonally adjusted basis, the picture was just as impressive. Regular state claims dropped 152.9K to 612.9K. Again this was the lowest level of the pandemic. The same can be said for Pandemic Unemployment Assistance (PUA) too. Although the 20K decline is on the smaller side for the past several weeks’ moves, claims from this program reached a new low of 131.98K. PUA claims are now down to around a quarter of where they stood just two months ago.
Over the past several months, continuing claims have consistently been making new lows for the pandemic. Since the high in claims last May, there have only been 8 weeks in which continuing claims did not fall with this week being one of them. Claims rose by a meager 4K from last week’s downwardly revised reading of 3.727 million. That snapped a streak of 12 consecutive weeks of declines. Additionally, outside of the week of September 11th when claims went unchanged, the 4K increase this week was tiny relative to other moves of the past year. Overall, while continuing claims increased, it came in the context of a long, albeit slowing, streak of declines.

Including all other programs creates another week’s lag for the data meaning the most recent reading is through the final week of March. Taking a look at continuing claims in this light, there were broad improvements with the only program to see an uptick being the very small State Additional Benefits which rose from 1.8K to 2.15K. As for the larger and more impactful programs, regular state claims fell by half of a million while PUA claims were not far behind dropping 474.7K. The third-largest program, Pandemic Emergency Unemployment Compensation (PEU), also saw a significant decline falling by 174.4K. That was the program’s fourth-largest week-over-week decline of the past year. Altogether, total continuing claims across all programs fell to 16.96 million. That is the second-lowest level of the past year.
In addition to the drop in the overall level of claims, another improvement comes from the composition of claims. Over the past several months we have noted how an increased share of claims are on account of programs that extend benefits past the expiration of various programs. In other words, a larger share of people on unemployment have been out of work for extended periods of time. For the time being, that trend has peaked. The most recent week showed further improvements with respect to those programs as they now account for a combined 34% of all claims. That is down for a third week in a row since the high of 36.9%. Click here to view Bespoke’s premium membership options for our best research available.


Bespoke’s Morning Lineup – 4/15/21 – Better Than Expected
See what’s driving market performance around the world in today’s Morning Lineup. Bespoke’s Morning Lineup is the best way to start your trading day. Read it now by starting a two-week free trial to Bespoke Premium. CLICK HERE to learn more and start your free trial.
“Money is made by sitting, not trading.” – Jesse Livermore
Futures have been higher all morning driven by solid earnings results from some of the largest banks. In addition to the earnings results, we just got a slug of economic data in the form of Jobless Claims, Retail Sales, Empire Manufacturing, and Philly Fed Manufacturing. As “Crazy Eddie” would say, the results were “Insane”. With the exception of Continuing Claims, which still came in right near their post-pandemic lows, every other report came in much stronger than expected. It’s still early, but what could be more impressive than the results themselves is the fact that the yield on the 10-year is actually lower now than it was before the releases.
Read today’s Morning Lineup for a recap of all the major market news and events including a recap of the biggest overnight events including some key earnings reports, international inflation data, as well as the latest US and international COVID trends including our vaccination trackers, and much more.
As shown on page two of our Morning Lineup, the S&P 500 has been consistently trading in ‘extreme’ overbought territory in recent days (2+ standard deviations above its 50-DMA). Yesterday marked the 9th straight trading day that the S&P 500 finished the day in this area marking the longest streak since January 2018 and just the 7th streak of nine or more trading days.

Short Interest Through the End of March
On Monday, short interest data through the end of March was released. ln aggregate for Russell 3,000 stocks, short interest as a percent of equity float is little changed versus where it stood in mid-March. But on an industry basis, there have been some large moves. Compared to midway through last month (red dashes in the chart below), the Pharma, Biotech, and Life Sciences industry saw short interest build by the most rising 0.68 percentage points. Of the other industries, there were eight that also saw higher short interest than the prior report. Conversely, the Telecom Services industry saw short interest fall the most of any sector dropping 0.46 percentage points between reports. While the moves between the most recent and the prior report were not very large, across the board, just about every industry has significantly lower average short interest levels now than at the start of the year (green dashes). That is especially the case for Retailing which has seen average short interest fall by 4.89 percentage points.

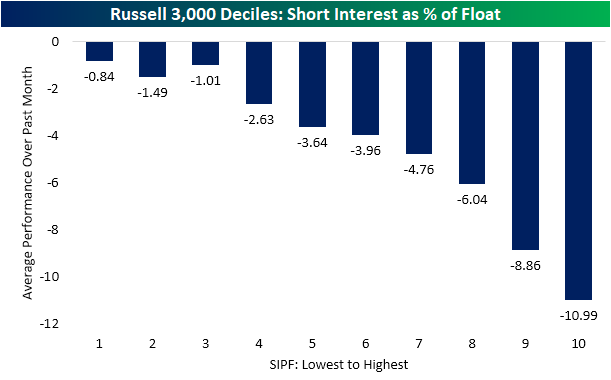
Earlier in the year, short interest appeared to be a key driver of performance. During the GameStop (GME) saga, the most heavily shorted stocks were some of the best performers. Fortunately for short-sellers, over the past month, the opposite has been the case. The stocks that had the highest short interest as a percent of float at the end of March have averaged a decline of 10.99% over the past month. Comparatively, stocks with low short interest have fared much better albeit still lower on average.
We would also note that while every decile based on short interest has averaged a decline over the past month, the Russell 3,000 has actually pushed to new highs. That is because the largest stocks by market cap have been driving the capitalization-weighted index higher.
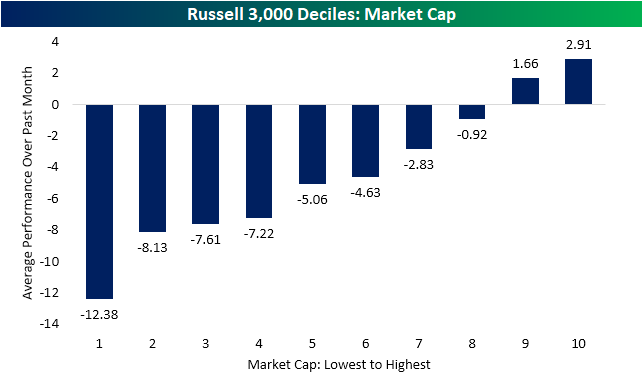
In fact, one other notable theme of performance recently has been market cap. The deciles of the largest stocks (deciles 9 and 10) are the only ones whose stocks have averaged a move higher over the past month. On the other hand, the other deciles have averaged declines with the severity of those declines getting worse with smaller market caps.
In the table below, we show the 30 most heavily shorted stocks in the Russell 3,000 at the end of March. Health Care stocks, namely those of the Pharma, Biotech, and Life Sciences industry, dominate this list. That includes IGM Biosciences (IGMS) which is the most heavily shorted stock with 44.8% of shares shorted. Of the other top 30 most shorted stocks, 25 have at least a quarter of their shares sold short. Some of these like Academy Sports & Outdoors (ASO) and Gogo (GOGO) have that high short interest in spite of big declines in short interest recently. Others like IGMS as well as Discovery (DISCA), Frequency Therapeutics (FREQ), and Rackspace Technology (RXT) have seen short interest rise considerably.

In fact, those names are the stocks in the Russell 3,000 that have seen short interest rise the most versus the last report. RXT, IGMS, FREQ, as well as SeaChange International (SEAC) and iTeos Therapeutics (ITOS) have all seen short interest rise by double-digit percentage points. There is an even larger number of stocks that have seen short interest fall double-digit percentage points, though, with Sumo Logic (SUMO) having seen the biggest decline falling 32.07 percentage points. Lastly, while the majority of stocks with high short interest or big increases/decreases in short interest are smaller in size, two standouts are Discovery (DISCA) and Rocket (RKT) with market caps of $26.57 billion and $45.6 billion, respectively. Click here to view Bespoke’s premium membership options for our best research available.

Gas Prices Hit the Breaks
While the surge in oil prices today will likely have some impact on gas prices in the days ahead, recent trends in prices at the pump have really done an about-face. After a record YTD surge that took prices as high as $2.88 per gallon as of March 19th, the national average price of a gallon of gas has dropped to $2.86 according to AAA. A two-cent decline in the price of a gallon of gas may not sound like much, but for this time of year, it’s extremely uncommon for prices to decline. Since 2005, prices have only declined in the period from 3/19 through 4/14 three times in 16 years.
To further illustrate, the chart below compares the change in average gas prices this year to a composite of every year since 2005. While it’s typical for gas prices to rise at this time of year, the surge we have seen in 2021 has been much larger than average. However, whereas prices typically continue to rise right up through late May, this year’s increase in prices stalled out nearly a month ago.

Even after this modest pullback, though, prices are still high relative to history for this time of year on both an absolute basis and in terms of their YTD change. At an average of $2.86 per gallon, prices haven’t been this high at this time of year since 2014 and are two cents above the historical average for 4/14. Similarly, the YTD increase of 27.0% in prices is more than twice the historical average at this time of year.

On a y/y basis, prices have also seen a major surge. At current levels, the national average price of a gallon of gas is up over 55% in the last year, and if prices simply stay at their current levels between now and the end of April, the y/y change would top out at 61.9%. While still slightly less than a record y/y change, it would still be pretty darn close. Start a two-week free trial to Bespoke Institutional to access all of our analysis and market commentary.

Health Care & Education Inflation Withering Away
Last night in The Closer we reviewed the BLS report on March CPI reported yesterday, including a couple of interesting long-term sources of inflation that have decelerated dramatically of late.
Two categories have long been a source of angst for consumers and policymakers for their persistent gains: medical care goods and tuition/child care. Prior to the last couple of years, it was extremely unusual for the prices of medical care goods to drop more than 1% or so below their prior record high. Instead, we saw slow and persistent price gains. Since COVID hit, though, prices have plunged by a record of more than 3% from their highs. The drivers are two-fold. First, after huge price gains relative to overall inflation for most of their history, prescription drug prices, which account for the largest weighting in the sector, have barely budged over the last couple of years.

The second factor behind the decline has been what is likely to be a temporary sharp drop in medical equipment and supply prices.

Turning to tuition, the steady above-headline growth of the cost of school has been a permanent feature of American life for decades, but that has started to shift. Tuition and childcare prices were actually negative year-over-year at one point in 2020, and demographics mean that the student cohorts are gradually getting smaller; college inflation may be starting to leave the picture after years of consistent pressure. Start a two-week free trial to Bespoke Institutional to access all of our analysis and market commentary.

Bitcoin in 2017 vs. Now
On the same day that Coinbase (COIN) is set to IPO, Bitcoin traded above $64,000 for the first time ever. The leader in the cryptocurrency space has gone on a massive run over just the past few months having more than doubled just year to date. Over the past year, bitcoin is up well over 800%.
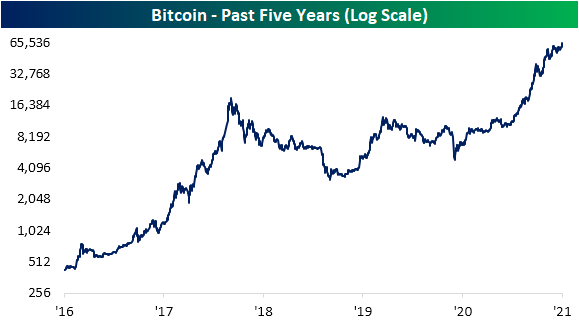
Those eye-popping returns in a relatively short span of time may seem like a bit of déjà vu from only a few years ago, but we would note that the comparison does not quite stack up. For starters, while Bitcoin has been a nine-bagger over the past year, the rate of change was much gaudier back in late 2017 when it rose upwards of 2,400% year over year by the time of its high around $19,000.

In the chart below we show the performance of Bitcoin in the year leading up to the December 2017 peak versus the run over the past year. Both runs are extremely impressive and at times have tracked each other fairly well, but there is one distinguishing difference. In weeks leading up to the prior peak in 2017, Bitcoin went into orbit gaining over 240% from mid-October to the December high. By comparison, Bitcoin is up only around 30% from mid-February through today.

In addition to the move having been smaller recently, Bitcoin also appears to have seen interest fall off. As shown below, Google Trends data showing searches for “Bitcoin” peaked in late 2017 at the height of the crypto craze as people rushed to learn about the asset. Search interest has been mostly muted since then, but it did pick up within the past several months. Bitcoin is on the tips of more tongues today especially given the direct listing of Coinbase (COIN), but Google searches for the crypto are still well below the highs from a few years ago and are even well below the more recent peak from the start of this year. In other words, from a sentiment perspective Bitcoin appears to be less of a frenzy now than it has been in the past. Click here to view Bespoke’s premium membership options for our best research available.
