Bespoke Brunch Reads: 4/25/21
Welcome to Bespoke Brunch Reads — a linkfest of the favorite things we read over the past week. The links are mostly market related, but there are some other interesting subjects covered as well. We hope you enjoy the food for thought as a supplement to the research we provide you during the week.
While you’re here, join Bespoke Premium with a 30-day free trial!
Conservation
The destructive green fantasy of the bitcoin fanatics by Jamie Powell & Jemima Kelly (FT)
When you’re not assuming an outcome and backfilling whatever it takes to get to there, Bitcoin is very simply a massive, energy intensive polluter fueled by dirty coal power. [Link; paywall]
The Chip Shortage Is Bad. Taiwan’s Drought Threatens to Make It Worse. by Stephanie Yang (WSJ)
With explosive demand driving a massive chip shortage around the world, Taiwan Semi is facing a huge problem: no water, a critical input for semiconductor manufacturing. [Link; paywall]
YOLO
Robinhood, Three Friends and the Fortune That Got Away by Rachel Louise Ensign (WSJ)
Tracking the progress of three amateur investors through the pandemic and the hundreds of trades that were part of a massive boom in retail trading last year. [Link; paywall]
Welcome to the YOLO Economy by Kevin Roose (NYT)
With vaccinations available, equity markets ripping, and crypto booming, early middle-age Millennials are flipping over the carefully arranged tables of their lives to seize the day. [Link]
It’s not NBA Top Shot, Beeple or a tweet, but IBM is about to turn patents into NFTs by Eric Rosenbaum (CNBC)
IBM and intellectual property specialist IPwe are collaborating on an effort to tokenize patents via the company’s blockchain platform, though it’s not entirely clear how tokenization would increase pattern liquidity. [Link]
Credit
A $1 Trillion Liquidity Surge Is Morphing Into a Leverage Boom by Paul Seligson (Bloomberg)
Pandemic borrowing that helped companies fortify their cash position during the pandemic is being redeployed to M&A, stock buybacks, and dividend hikes. [Link; soft paywall]
Vaccines
High Efficacy of a Low Dose Candidate Malaria Vaccine, R21 in 1 Adjuvant Matrix-M™, with Seasonal Administration to Children in Burkina Faso by Mehreen S. Datoo et al (SSRN)
A new malaria vaccine produced in partnership with Novavax has been shown to be 55.8% effective, a major step towards a widely available vaccine for a disease that kills roughly 1mm people per year around the world. [Link]
Vaccines Won’t Protect Millions of Patients With Weakened Immune Systems by Apoorva Mandavilli (NYT)
While vaccines are highly effective for those with functioning immune systems, millions of people won’t be protected by them due to other conditions; for them, monoclonal antibodies may be the only option. [Link; soft paywall]
Sports
New Jersey border towns surpass Las Vegas as sports gambling hotspot by Chris Sheridan (Basketball News)
Legalized sports betting venues in Fort Lee, New Jersey are regularly pulling in more betting action than the entire state of Nevada as bettors flock in from the Empire State. [Link]
Where Do QBs Come From (ESPN)
Louisiana and New York are by far the standouts when it comes to producing quarterbacks, and while Texas may be a football powerhouse by any other definition it ranks far and away the worst of any state when it comes to players under center. [Link]
Clout
Hip-Hop Loves Cash App, and That Might Be Why Jack Dorsey Bought Tidal by Grant Rindner (GQ)
Venmo was first in the free payment app space, but CashApp has been the big winner thanks to wild popularity in the South that was spread and amplified by the affection of hip hop. [Link]
Instagram star cat dies from injuries after boy trips on leash by Craig McCarthy & Jackie Salo (NYP)
A cat with more than 33,000 on Instagram was killed this week after a boy tripped on the feline’s leash, sparking a major brawl which also included the owners’ pet dog and bird. [Link]
Scarcity
Why are Hawaii visitors cruising around in U-Hauls? Blame the pandemic. by Chelsea Davis (Hawaii News Now)
Rental cars are so scarce in Hawaii that tourists are renting U-Hauls to get around the island during visits from the mainland. [Link]
South Florida restaurant buys robots to fight staffing issues by Michael Hollan (NYP)
A crab shack in South Florida has purchased three robots to take over some front-of-house tasks that typically would be performed by human staff. [Link]
Tragedy
The Fort Bragg Murders by Seth Harp (Rolling Stone)
Fort Bragg in Fayetteville, North Carolina has hosted a rash of deaths ranging from suicides to homicides, with more than 40 troops stationed at the base dying in 2020 alone. [Link]
Read Bespoke’s most actionable market research by joining Bespoke Premium today! Get started here.
Have a great weekend!
All Streaks Eventually End
Interest rates have been steadily on the rise ever since last summer as optimism over the economy re-opening and concerns regarding ballooning federal deficits and potential inflation have pushed borrowing costs higher. In recent weeks, we have seen a bit of a reversal in this trend as the yield on the 10-year US Treasury has dropped from about 1.75% to just over 1.5% even as economic data has continued to come in very strong. What’s also notable about the recent decline in yields is that on Thursday, the yield on the 10-year actually closed marginally below its 50-day moving average (DMA) for the first time since August 21st.

At 166 trading days, the just-ended streak of days where the 10-year yield closed above its 50-DMA was the longest on record going back to at least 1962, eclipsing the prior record of 162 trading days from March 1966. Also, since 1962, there have only been five other streaks that lasted even 100 trading days with the last occurring all the way back in 1984.

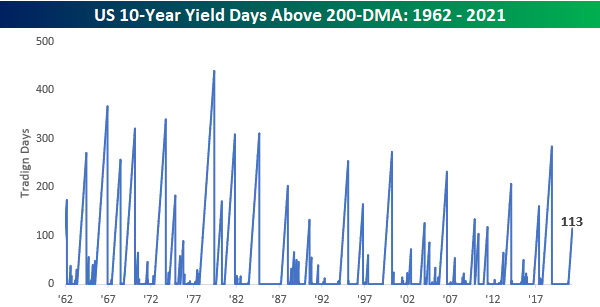
While the 10-year yield just ended a record streak of closes above its 50-DMA, its current streak of closes above the 200-DMA is much more ‘normal’ relative to history. At 113 trading days, it doesn’t even rank anywhere near the top ten in terms of longest streaks. With the 200-DMA only barely above 1%, though, that streak isn’t in danger of coming to an end any time soon. Click here to view Bespoke’s premium membership options for our best research available.
Bespoke’s Morning Lineup – 4/23/21 – Hesitant into the Weekend
See what’s driving market performance around the world in today’s Morning Lineup. Bespoke’s Morning Lineup is the best way to start your trading day. Read it now by starting a two-week free trial to Bespoke Premium. CLICK HERE to learn more and start your free trial.
“Real knowledge is to know the extent of one’s ignorance.” – Confucius
It’s a mixed picture for equity futures this morning after Thursday’s drubbing. There’s been no economic data so far, but at 10 AM we’ll get flash readings on April Manufacturing and Services activity from Markit. Investors will be looking for signs of how serious or likely the Democrats will be to pass Biden’s plans to raise capital gains tax rates for the highest earners, but with some Democrats even voicing concerns, this plan may not be the slam dunk that the market feared yesterday.
Read today’s Morning Lineup for a recap of all the major market news and events including the biggest overnight events, some key earnings reports, economic data from around the world, as well as the latest US and international COVID trends including our vaccination trackers, and much more.

Economic data has generally been strong around the world lately, but don’t tell that to the 10-Year US Treasury. Yesterday, the yield on the 10-year US treasury closed below its 50-DMA for the first time since last August.

Records Across the Board Out of Kansas City
There has been no shortage of strong readings on the manufacturing sector of late and this morning’s release of the Kansas City Manufacturing index was yet another point of this. The index was already at a record high in March but it gained another 5 points this month. Expectations pulled back slightly but remain right around some of the highest levels in the history of the survey.

With overall growth accelerating at a record pace, half of the individual categories of the report also set new records. Even for those that did not set a new record, almost all of the April readings were at least in the top few percentiles of all readings. As shown below, every index is now showing expansionary readings after the index for Finished Good Inventories rose to 8 from -10 last month. Additionally, there were only two indices that were lower month over month: New Orders and Supplier Delivery Times. In spite of those declines, both of those indices are coming off of record or close to record highs. In other words, even after declining they remain historically elevated.

New Orders continue to grow at a historically strong rate albeit decelerated from March as that index fell 9 points to 29. Given the further growth in orders, backlogs are continuing to rise at an increasingly rapid pace. That index gained another 3 points to reach a new high of 35. This month marks the third in a row that the index for unfilled orders came in at a record high. To meet this demand, firms appear to have massively ramped up production as the index topped 40 after gaining 17 points month over month. Although production is rapidly accelerating, shipments are lagging a bit. That index is also at a strong level of 32 but it only rose 5 points.
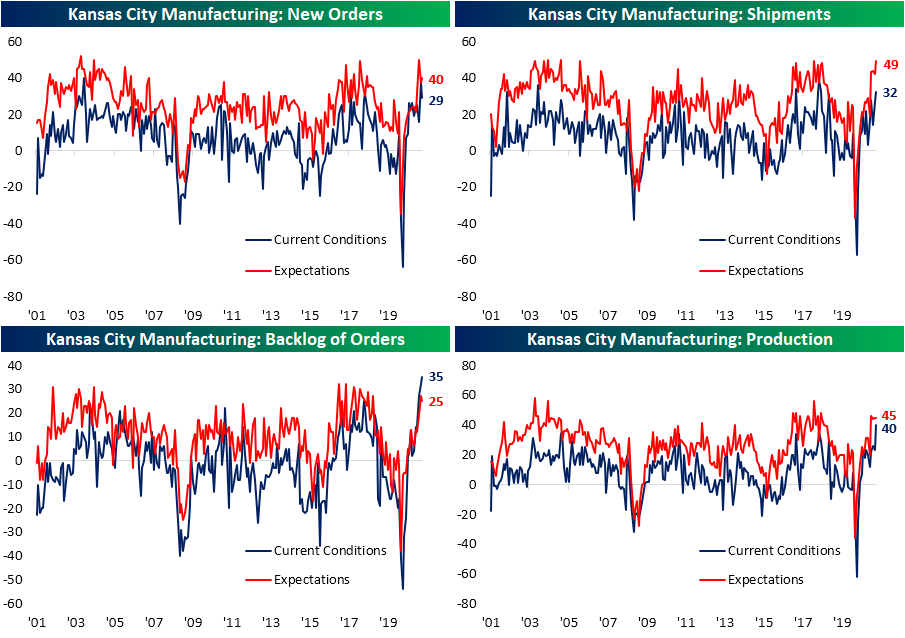
One likely reason for a more throttled reading on shipments is supply chain issues. As shown below, Delivery Times still remain extremely elevated. Even after pulling back in April, the index is well above anything observed prior to the past several months. Highlighted comments also make mention of these issues. For example, one comment states that “It is very difficult to handle the increased business with supply chain issues across all materials and finding anyone who wants to work” while another mentioned the company is, “facing significant supply chain problems due to COVID-19 issues, tariff issues, and the weather problems in Texas earlier this year”. On the bright side, expectations for Delivery Times plummeted in April as the index collapsed by 14 points. That is in the bottom percentile of all monthly moves.

Commentary also frequently mentioned increases in prices and the data backs up that anecdotal evidence. Both indices for Prices Paid and Prices Received rose to record highs this month. The same can be said for expectations of prices paid. The commentary gave a bit more color to this with mentions of inputs like steel contributing to those increases. Labor shortages were another area blamed for rising prices.

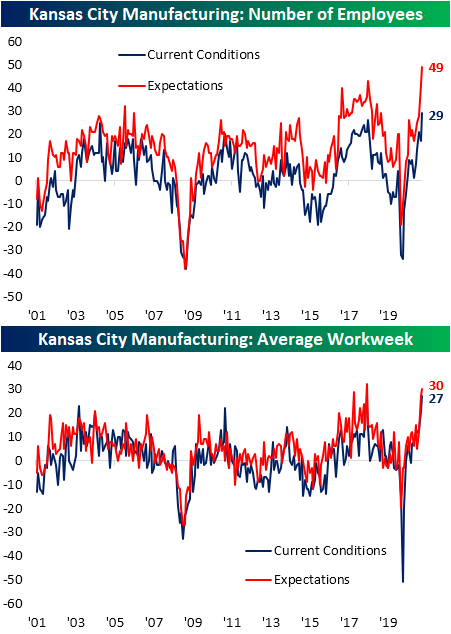
On the topic of labor, the indices for Number of Employees and Average Workweek are both at new highs. Expectations also remain extremely optimistic with the former at the highest level to date and the latter just off the prior high of 32 from June 2018. Again circling back to the commentary section, one firm noted that “Entry-level pay will need to be increased. This will create pressure on all other positions” and another stated that they “cannot get people to apply. We pay upwards of $20 or more per hour with full benefits”. In other words, even with employment metrics rising at a record rate, there is still plenty of demand on the part of employers. Click here to view Bespoke’s premium membership options for our best research available.
Dips in Short Supply
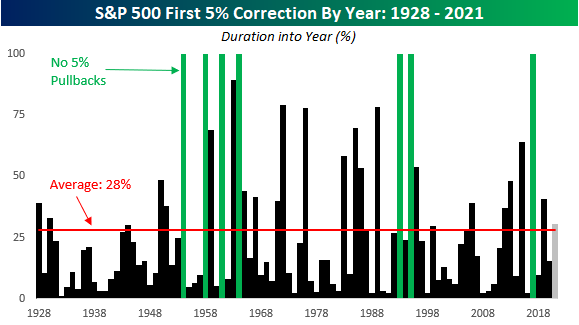
While many areas of the market have seen sizable pullbacks this year, the broader market has been stingier. Just this morning, a client was lamenting the fact that they had a decent amount of cash, but the market just wasn’t providing opportunities to get in. So far this year, the S&P 500’s largest decline from a peak (on a closing basis) has been 4.23%, and given that we’re not even four full months into the year, we initially thought that 4% seemed normal enough especially when the earlier months of the year tend to be positive.
In order to see how this year stacks up to prior years, the chart below shows the duration into each year (on a percentage basis) that the S&P 500 first closed down 5% or more from its YTD peak. Years in green indicate that there wasn’t a single point in the entire year that the S&P 500 experienced a 5% decline. The last occurrence was in 2017, and there have been a total of seven years since 1928. As we near the end of April, we’re nearly a third of the way into 2021, and compared to the ‘average’ year, we’ve already gone longer without a 5% pullback. Since 1928, the S&P 500 usually experiences its first 5%+ pullback 28% of the way into the year, which coincidentally enough works out to April 15th – the day before Federal taxes are typically due! In fact, at this point in prior years, the S&P 500 has already experienced its first 5%+ pullback more than 65% of the time. Believe it or not, in 30% of all years since 1928 the first 5% drop occurred in the month of January.
Based on prior years, the market to this point has in fact been stingy in terms of providing opportunities for investors to add exposure, although based on today’s reports of new capital gains tax increases from the Biden Administration, that window may soon open. Click here to view Bespoke’s premium membership options for our best research available.
A Majority of Investors Are Still Bullish
Sentiment continues to run in favor of the bulls though there has been some moderation in the past couple of weeks. Bullish sentiment as measured by the AAII weekly sentiment survey peaked at 56.9% in the second week of April but has since fallen in back-to-back weeks falling 4.2 percentage points to 52.7%. While lower recently, this is the first time since the last two weeks of 2017 and the first week of 2018 that bullish sentiment has remained above 50% for three weeks in a row. Before that, you would have to go back to early 2011 to find another period with bullish sentiment being above 50% for several weeks in a row. Outside of the early 2000s, such readings have been relatively uncommon.


Even though bullish sentiment has pulled back, fewer respondents are reporting bearish sentiment. Only 20.5% of respondents reported as pessimistic this week compared to 24.6% last week. That is 0.1 percentage points above the low of 20.4% from April 8th which was also the lowest level of bearish sentiment since April 2019.
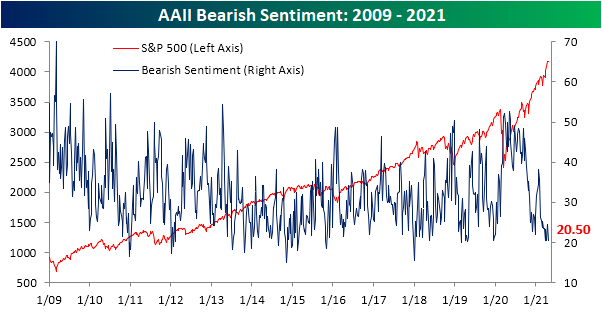
With both bullish and bearish sentiment lower, that means neutral sentiment picked up the difference rising 5.2 percentage points to 26.8%. That was the largest one-week increase in neutral sentiment since a 10 point rise from November 12th to November 19th of last year. Back then, neutral sentiment rose to a slightly higher level of 29.29%.

While individual investors have become less bullish over the past couple of weeks, the opposite is true of newsletter writers. The Investors Intelligence survey of this group has seen bullish sentiment rise for three weeks in a row reaching 63.7% this week. That is the highest level since at identical reading in the second week of the year. Although it has not been particularly long since the last comparable reading, we would note that it is elevated relative to history. In the chart below we show bullish sentiment over the past 50 years. Outside of now and late last year, the last time bullish sentiment was as high was in late 2017/early 2018. You would have to go all the way back to February of 1987 or earlier to find another time before that when sentiment was as high as it is now. Additionally, less than 20% of respondents are also looking for a correction. Readings around these levels were not necessarily uncommon in the early 2000s and prior, but relative to the past 15 years or so such a low reading has been rarer. Click here to view Bespoke’s premium membership options for our best research available.

Revisions Bring The Streak Back to Life
Last week saw an impressive reading for jobless claims falling to 576K. While that was revised slightly higher to 586K this week—which would still be well below the previous low for the pandemic—today’s release saw further improvements with initial claims dropping another 39K from that revised level to 547K. That brings the total decline over the past two weeks to just under 200K; the largest since the first week of August when claims first fell back below one million.

On a non-seasonally adjusted basis claims likewise continue to fall which is normal given the time of year. The current week of the year (week number 16) has only seen unadjusted claims rise week over week 13% of the time going back to 1967 when the data begins. In other words, the improvement in claims comes alongside seasonal tailwinds as non-seasonally adjusted initial jobless claims fell to 566.5K this week from 623K last week. The picture for Pandemic Unemployment Assitance was not as positive as the program experienced a small uptick from 131.7K to 133.3K. Nonetheless, that is the second week in a row with a very low count in claims for this program.

Continuing jobless claims had been on an impressive streak of 12 straight weeks of declines, but that appeared to end last week after rising to 3.731 million. Fast forward to today’s release and that reading was revised down significantly by 23K to 3.708K. Given that was below the prior week’s 3.717 million reading and the most recent reading fell further to 3.674 million, the streak of consecutive week-over-week declines has been brought back to life, extending to 14 weeks long. As shown in the second chart below, that makes for the longest streak of consecutive declines on record. Overall, the continuing claims picture continues to consistently improve as continuing claims are well below the pre-pandemic record from the last recession. Granted, current levels are still historically elevated around levels of past highs like those in the early 1990s and 2000s.


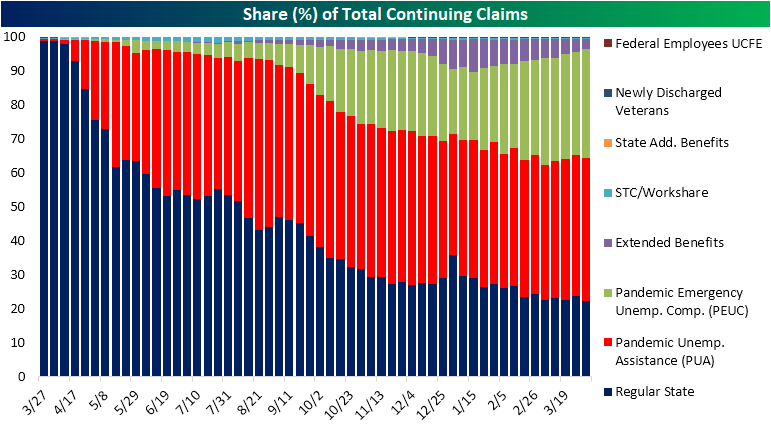
When factoring in all programs, the most recent data is for the first week of April. Based on the latest results, we saw an uptick in total continuing claims across all programs rising just under 500K to 17.4 million. While regular state claims and the Extended Benefits program both saw declines of more than 100K, they were offset by 265.2K and 447.7K respective increases in PUA claims and Pandemic Emergency Unemployment Compensation (PEUC) claims. Those increases bring these programs’ claim counts back up to similar levels as a month ago. Meanwhile, Extended Benefits claims are at their lowest level since early October, and regular state claims are at the lowest of the pandemic.
As for the composition of claims, those moves meant a significant share (35%) of total claims still come from extension programs like PEUC and Extended Benefits. While that is below the highs from last month on a combined basis, breaking this down further, the PEUC program’s share of total claims reached 32.2% in the most recent week’s data; a new high for the pandemic. Meanwhile, the Extended Benefits program’s share fell to the lowest level since October. There is a similar dynamic for PUA and regular state claims with the former accounting for a growing share of total claims and the latter accounting for the smallest share of the pandemic. Click here to view Bespoke’s premium membership options for our best research available.

Ether Gets On the Field
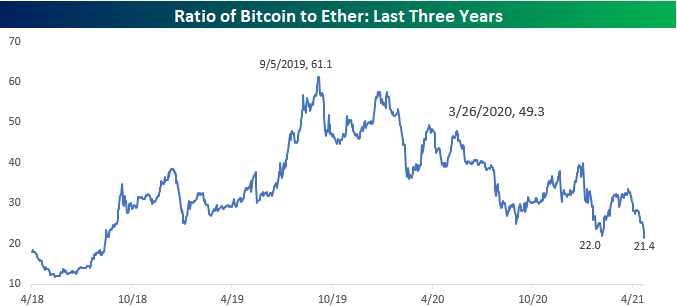
Ever since ‘crypto’ entered the mainstream, bitcoin has been the superstar. Sure, doge has gotten its 15 minutes, but at least nine out of ten times, if you ask someone about crypto, the first asset they are going to mention is bitcoin. The next most popular crypto asset has pretty much always been ethereum, but it has always taken a backseat to bitcoin. Even today, while bitcoin has a total market value of just over one trillion dollars, the total value of ether out there is just under $300 billion.
While ethereum is less than a third the size of bitcoin, in recent days it has been holding up very well given the pullback in bitcoin. The chart below shows the performance of both crypto-currencies over the last six months. While they’ve followed relatively similar paths, you’ll notice that despite bitcoin’s 15%+ pullback, ether has traded to record highs.

Another way to put the recent performance of ether versus bitcoin into perspective is to compare the ratio of the two over time. In the chart below, we show the ratio of bitcoin versus ether going back to early 2018. A high ratio indicates that bitcoin is outperforming ether and vice versa. Back in late 2018, the ratio between the two peaked out at more than 60 ether per bitcoin, but it has been trending lower ever since. In fact, as of today, one bitcoin is worth just over 21 ether which is the lowest ratio since August 2018. Ether may have been nothing more than a single-A player relative to bitcoin a year and a half ago, but it has quickly worked its way up to the system and earned itself a spot in the dugout next to bitcoin. Click here to view Bespoke’s premium membership options for our best research available.
Bespoke’s Morning Lineup – 4/22/21 – Strong Earnings, Market Yawns
See what’s driving market performance around the world in today’s Morning Lineup. Bespoke’s Morning Lineup is the best way to start your trading day. Read it now by starting a two-week free trial to Bespoke Premium. CLICK HERE to learn more and start your free trial.
“Be brutally honest about the short term and optimistic and confident about the long term.” – Reed Hastings
It’s been another strong overnight session in terms of earnings results, but as has been the case recently, the market isn’t very impressed. Futures are modestly negative to flat, even after jobless claims came in well below forecasts and at their lowest levels since the pandemic. The ECB left its policy position in place, but we’ll be looking for further details in the press conference coming up shortly.
Read today’s Morning Lineup for a recap of all the major market news and events including the biggest overnight events, some key earnings reports, economic data from around the world, as well as the latest US and international COVID trends including our vaccination trackers, and much more.
Yesterday was a strong day for the equity market, and while the Nasdaq 100 are both near all-time highs, the Russell 2000 continues to struggle. Even after yesterday’s rally, IWM remains below its 50-day moving average. On the one hand, until it can break back above its 50-DMA, the burden of proof is on the bulls, but if it can break above that level, you could argue that much of the froth in small caps has been worked off, so expectations are relatively low.

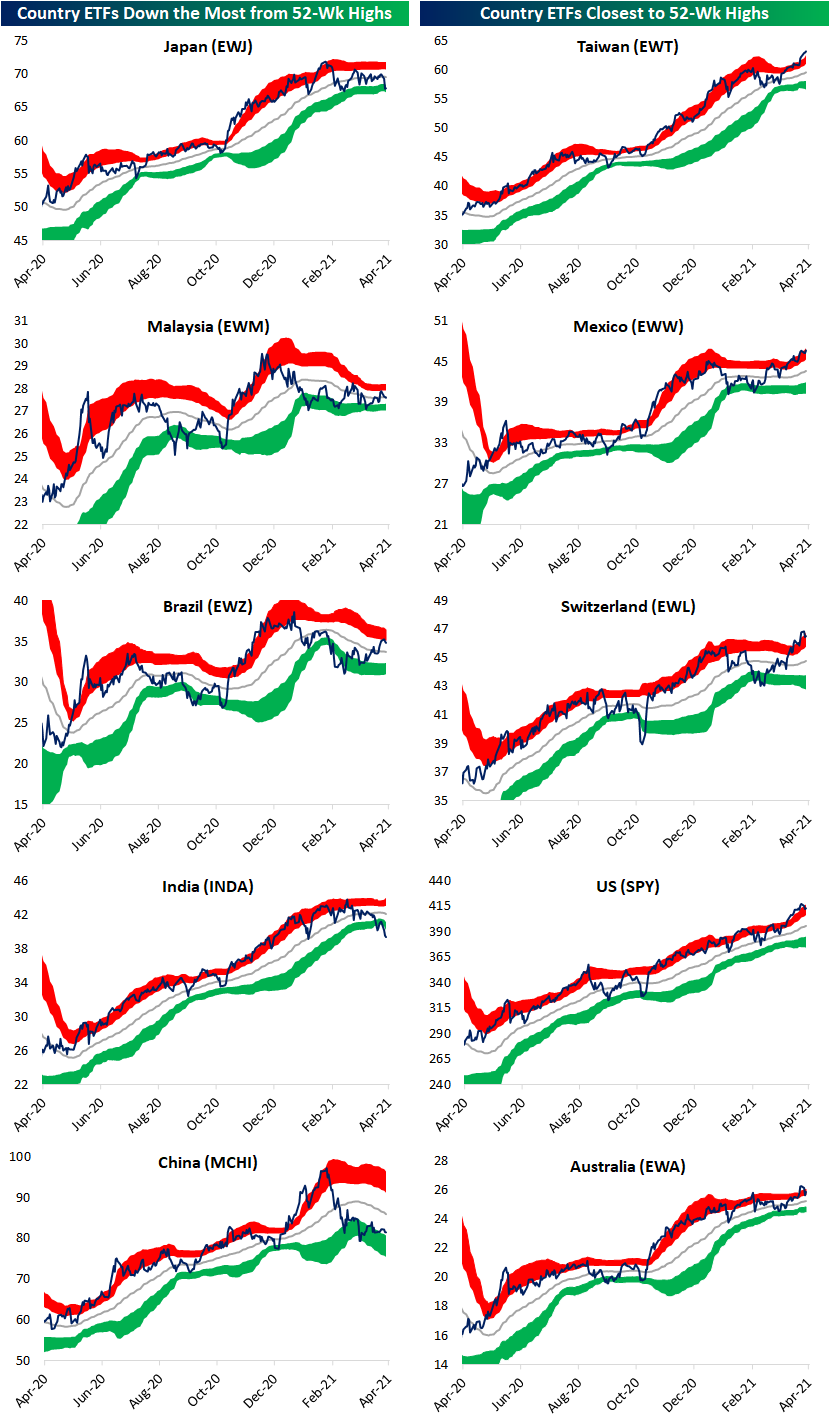
Emerging Markets Mixed on 52-Week Highs
The S&P 500 is headed back up towards record highs today, but the index’s pullback earlier in the week was shared with other equity markets around the world. In the table below, we show the ETFs tracking the stock markets of the 23 countries in our Global Macro Dashboard. Last week most of these were overbought with some at extremely overbought levels of more than 2 standard deviations above their 50-DMAs. Performance over the past week has been mixed but broadly speaking these countries are now lower within their respective trading ranges. One notable exception has been Taiwan (EWT) which has been the best performer rising to 52-week highs and moving into extreme overbought territory. Mexico is also at a 52-week high today.
When it comes to developed versus emerging market countries, though, these are two outliers with their cohorts mostly on the other end of the spectrum. On average, EM countries are underperforming on a year-to-date basis and the only countries in the red in 2021 are EM names. As a result, these also are generally much further from their 52-week highs. For example, Malaysia (EWM), Brazil (EWZ), India (INDA), and China (MCHI) are all the furthest (at least 5% below) from their 52-week highs. Granted in the past week EM has outperformed on average with the exception of INDA which has been the worst performer of the 23 countries as COVID cases soar in that country. Meanwhile, developed market countries are 34 bps lower on average but generally closer to their highs and more overbought.

In the charts below we show the five countries that are furthest from and closest to their 52-week highs. As we noted in today’s Morning Lineup, Japanese equities (EWJ) last peaked in mid-February but have been trending lower ever since and have taken a sharp leg lower in recent days. That leaves EWJ right at the low end of the past few months’ range. That is the only developed market country of those the furthest below their 50-DMAs. Of the other countries with the furthest to go until they reach their 52-week highs, only INDA is also around critical support levels after a significant short-term move lower recently. EWM, EWZ, and MCHI on the other hand are further off their lows. EWZ has even been trending higher over the past month.
As previously mentioned, Taiwan (EWT) and Mexico (EWW) are both setting new 52-week highs today. There are a handful of other countries that are within 2% of doing the same but Switzerland (EWL), the US (SPY), and Australia (EWA) are the closest. Click here to view Bespoke’s premium membership options for our best research available.