Bespoke Brunch Reads: 5/23/21
Welcome to Bespoke Brunch Reads — a linkfest of the favorite things we read over the past week. The links are mostly market related, but there are some other interesting subjects covered as well. We hope you enjoy the food for thought as a supplement to the research we provide you during the week.
While you’re here, join Bespoke Premium with a 30-day free trial!
COVID
A COVID Outbreak Is Plaguing Climbers on Everest by Dewan Rai and Ben Ayers (Outside)
At least 22 climbers and Sherpas at the Everest Base Camp have COVID diagnoses, forcing expeditions to abandon their climbs and complicating an already complicated logistical backdrop at the foot of the world’s tallest mountain. [Link]
Statewide Reopening During Mass Vaccination: Evidence on Mobility, Public Health and Economic Activity from Texas by Dhaval M. Dave, Joseph J. Sabia & Samuel Safford (NBER)
Reopening in Texas did not accelerate COVID cases because individuals did not change behavior in aggregate after the policy shift; that also means that claimed benefits related to employment did not materialize either. [Link]
Investing
Trump Allies Promote Portfolios Targeting ‘Unwoke Investors’ by John McCormick (WSJ)
In an age reaction, for every action there is a pushback. In this case, ESG strategies are getting a counterweight with portfolios designed to overweight stocks perceived as appealing to conservative values. [Link; paywall]
Fidelity’s Pitch to America’s Teens: No-Fee Brokerage Accounts by Justin Baer (WSJ)
The brokerage company is aiming to introduce teens to investment with debit cards and brokerage accounts for the children of existing Fidelity clients. [Link; paywall]
EVs
The 2022 Ford F-150 Lightning Is the Future of America’s Workhorse by Brian Silvestro (Road & Track)
A review of the Ford F-150 Lightning fully electric pickup, unveiled this week in Michigan, offers 230-300 miles of range and between 420 and 560 horsepower, along with a front trunk, crew cab, and super-affordable price point relative to competitors. [Link]
Zero-emission, all-electric flight is closer than you think by Justin Gerdes (Energy Monitor)
A small regional airline that operates seaplane flights along the coast of British Columbia is in the process of certifying battery-powered planes, with multiple test flights per week run since the end of 2019. [Link]
Getting Out Of Hand
Amazon’s Ring is the largest civilian surveillance network the US has ever seen by Lauren Bridges (The Guardian)
10% of American police departments can access video footage from Amazon’s Ring doorbells…without any warrant. Tens of thousands of requests have been made, offering police a work-around that skirts Fourth Amendment protections. [Link]
‘Collectibles versus commodities’: As Target halts sales of trading cards, collectors reckon with fast-changing hobby by Jacob Bogage (WaPo)
Target is taking playing cards off the shelves after a dispute over collectibles outside one of its Milwaukee stores led to violence and multiple arrests. [Link; soft paywall]
Panhandle Boom
ECP Airport has highest passenger numbers in April since its original opening by Madalyn Bierster (My Panhandle)
Northwest Florida Beaches International, just north of Panama City, is seeing all-time record traffic as foreign tourism takes a back seat to domestic destinations. Booming arrivals are fueling a renaissance in Florida Panhandle tourism. [Link]
Philanthropy
Giving Billions Fast, MacKenzie Scott Upends Philanthropy by Nicholas Kulish (NYT)
After receiving 4% of outstanding AMZN shares in her divorce two years ago, MacKenzie Scott is breaking the mold of philanthropy by actually giving away money, a stark contrast to the traditional approach of foundations that pay out as little cash from their holdings as possible. [Link; soft paywall]
Read Bespoke’s most actionable market research by joining Bespoke Premium today! Get started here.
Have a great weekend!
Economic Surprise Index Tips Negative For The First Time In A Year
While the overall trend of economic data has been for further improvement, things have slowed recently relative to expectations. In the charts below, we show the charts of the Citi Economic Surprise indices for the US, Emerging Markets, the Eurozone, and the entire world. Broadly speaking, positive readings indicate that economic data is coming in better than forecasts while negative readings indicate the opposite. Every region of the globe has pulled back over the past couple of months but for the most part, current readings remain at the high end of their historical ranges. In fact, the indices for Emerging Markets, Eurozone, and the whole globe all sit in the top 3% of all readings in their histories. The one place that is not the case is the US. Since last summer, the surprise index has been trending lower off of record levels, and just yesterday, it hit it tipped negative for the first time since June 2nd of last year.
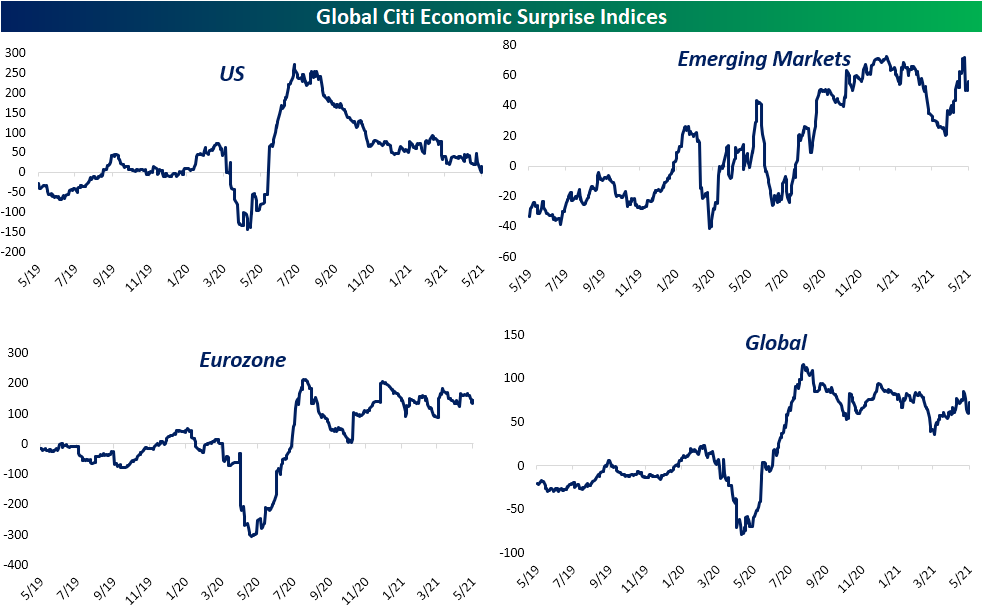
Lasting 248 trading days, this was the longest streak of consecutive positive readings in the index’s history dating back to 2003. The only other streak that lasted nearly as long was a 189 day long one which came to an end in June 2018. Click here to view Bespoke’s premium membership options for our best research available.

Bespoke’s Morning Lineup – 5/21/21 – Nasdaq Lunging For the Finish Line
See what’s driving market performance around the world in today’s Morning Lineup. Bespoke’s Morning Lineup is the best way to start your trading day. Read it now by starting a two-week free trial to Bespoke Premium. CLICK HERE to learn more and start your free trial.
“It’s not so important who starts the game, but who finished it.” – John Wooden
While the week came in like a bear, it’s looking to go out like a bull as US equity futures are in the green across the board. The Nasdaq is already in positive territory for the week, and if current pre-market levels hold, the S&P 500 could make it just barely into positive territory, but a win is a win no matter what the score. The economic calendar is relatively quiet to close out the week with flash PMI readings for May at 9:45 and Existing Home Sales at 10 AM. In addition to those reports, four Fed officials are also scheduled to speak throughout the day.
Read today’s Morning Lineup for a recap of all the major market news and events including a recap of overnight economic and earnings data, an updated look at global PMI readings as well as the latest US and international COVID trends including our vaccination trackers, and much more.

With three down days to start, a down week for the Nasdaq was looking like a foregone conclusion on Wednesday. Thursday’s rally changed that script, and instead of the fifth straight week of losses, the Nasdaq is on pace for its first positive week in May. Ever since the index failed to take out its February high in late April, the Nasdaq has been under pressure, but this week’s rally, or more accurately, the rally off Wednesday’s lows has put the 50-DMA into play. Futures are indicated higher this morning which would put the Nasdaq back above its 50-DMA to close out the week, but there’s still six and a half hours of trading left in the week. One encouraging sign is that along with the gain in the Nasdaq, semis have also shown some leadership for a change after weeks of underperformance.

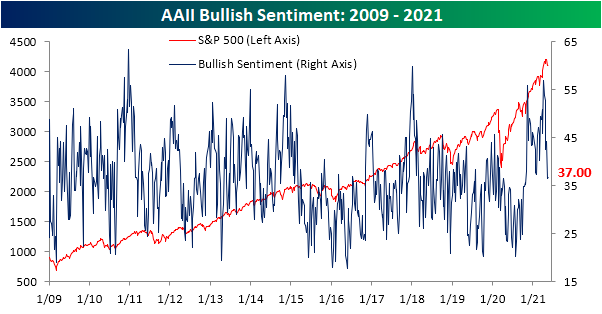
Increased Caution Across Sentiment Indicators
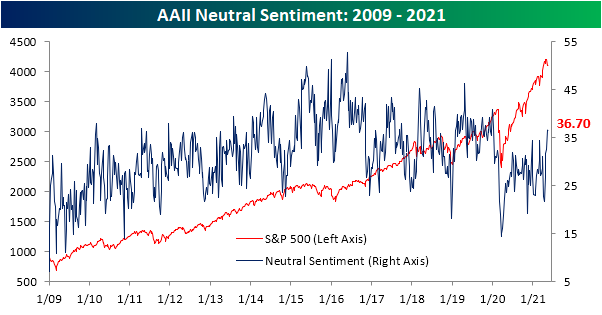
The S&P 500 has been holding up at its 50-DMA in the past week while more speculative areas of the market (i.e. crypto) have experienced wild swings. As a result, sentiment on the part of individual investors has not seen much of a move. The American Association of Individual Investors‘ weekly reading on bullish sentiment was little changed this week climbing half of one percentage point to 37%. Although that was not a large move in the past week, sentiment has taken a big hit over the past month having fallen from well above 50%. In spite of that big drop and even though sentiment is around the lowest levels of the past half-year, the current sentiment level is within one percentage point of the historical average. In other words, optimism is low versus recent history but is very much middling from a longer term perspective.
Meanwhile, bearish sentiment fell 0.7 percentage points to 26.3%. Unlike bullish sentiment, that is a bit lower than the historical average of 30.5%

Those corresponding moves meant the bull-bear spread climbed to 10.7 from 9.5 the prior week. Excluding last week, that is still one of the lowest readings since February.
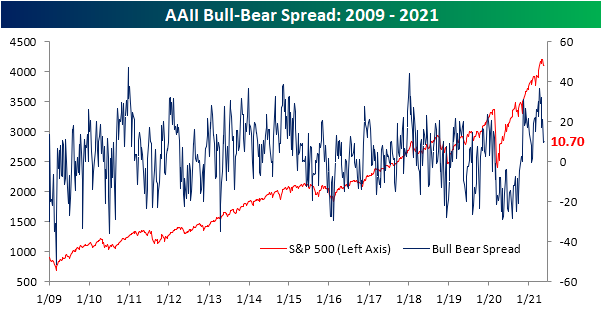
Neutral sentiment has been the star of the show recently. The gain this week was tiny at only 0.2 percentage points, but nonetheless, it marked the fifth consecutive week in which neutral sentiment has risen. At 36.7%, it is now at the highest level since the second week of 2020.
The Investors Intelligence survey of equity newsletter writers took a less optimistic tone this week as bullish sentiment fell 4.1 percentage points to a ten-week low of 54.5%. Bearish sentiment was unchanged at the highest level since the end of March. The survey also questions respondents on whether or not they expect a correction. That reading rose 4.1 percentage points to 28.3% in the biggest one-week uptick since the last week of April when it rose 4.7 percentage points. That leaves the reading at the highest level since the week of March 10th. Before that, you would need to go back to September 23rd to find as high of a reading.

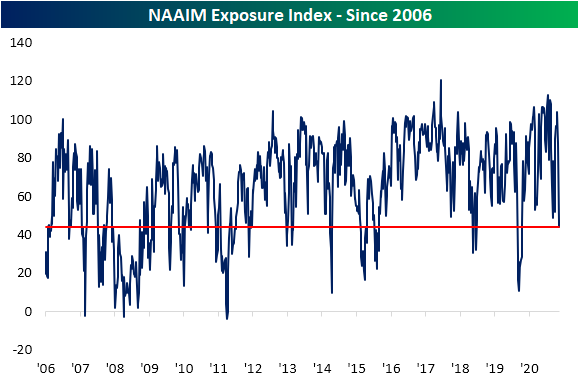
Another sentiment reading that has taken an even more dramatically negative tone lately has been the National Association of Active Investment Managers Exposure Index. This index measures how exposed to equities managers are where readings of 200 would mean they are leveraged long, 100 would be fully invested long, 0 would be neutral, -100 is fully short, and -200 is leveraged short. This week saw the index fall another 2.65 points after a massive 40-point decline last week. That is the lowest level since last March and April of last year. Altogether, while sentiment still favors bulls, there has been a more cautious tone that has been reflected in managers reducing exposure to equities. Click here to view Bespoke’s premium membership options for our best research available.
PUA Claims Below 100K As States Plan To Drop The Program
Recent jobless claims prints have seen the readings on initial claims consistently fall to pandemic lows while continuing claims have been a bit weaker moving sideways or even slightly higher. This week, it was more of the same. Initial claims came in at the lowest level since the week of March 13th of last year; the last week before the pandemic caused claims to rise by the millions per week. At 444K this week claims dropped by 34K from last week’s revised level of 478K (original of 473K). That was also better than expected as forecasts were calling for a decline to only 450K. Initial claims have now fallen three weeks in a row with the drop totaling 146K in that time.
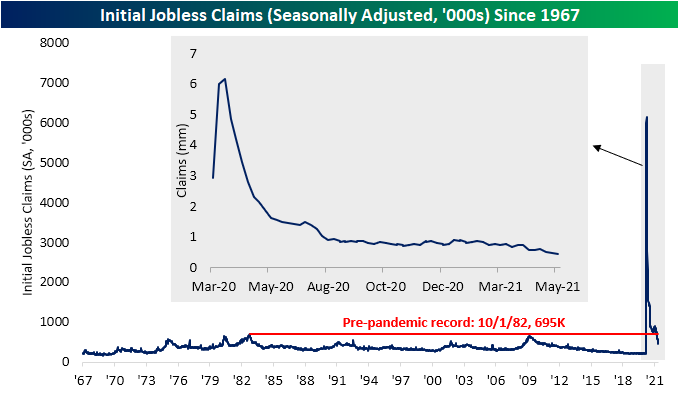
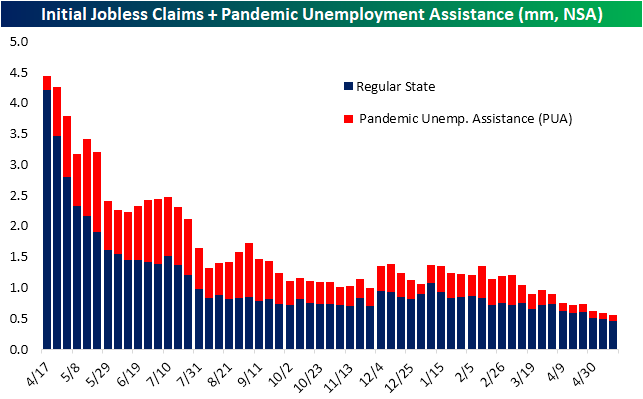
On a non-seasonally adjusted basis, claims were likewise lower for a third week in a row coming in at 454.6K which again is the strongest reading since last March. With regards to Pandemic Unemployment Assistance (PUA), there have been several states to recently announce that they are to various extents doing away with certain programs like PUA early even though on a federal level the American Rescue Plan extended benefits through September. Without getting into the weeds on the implications of this, we would note those announcements do come in the context of very small inflows into auxiliary claims programs like PUA. This week, PUA claims fell below 100K for the first time after falling 8.6K to 95.09K.
In spite of decelerating inflows into the unemployment insurance systems, the continuing claims picture continues to worsen. Continuing claims were expected to fall from last week’s revised reading of 3.64 million to 3.62 million, but instead, they rose 111K. That brings continuing claims to the highest level since mid-March and makes this week’s increase the largest in a single week since the last week of November.
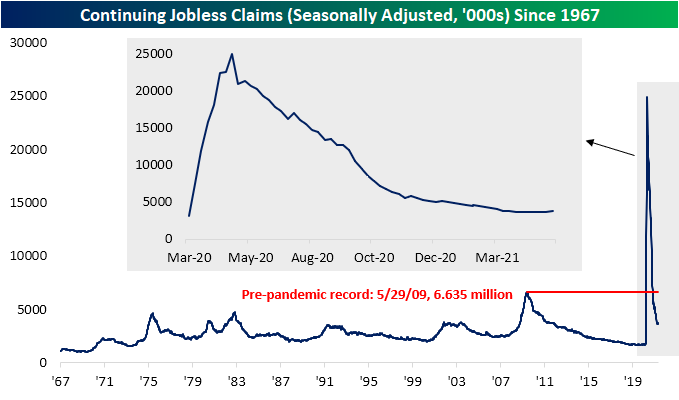
Factoring in all other programs for a more complete picture adds an extra week’s lag to the data. By this measure, things look better than looking purely at regular state claims. Total claims across all programs fell to just above 16 million at the end of April compared to 16.891 million the week before; a new low for the pandemic. PUA claims contributed the most to that overall decline with the program seeing 678.7K fewer claims week over week. At 6.6 million, continuing PUA claims reached the lowest level since the first week of May of last year. Regular state claims and Pandemic Emergency Unemployment Compensation (PEUC) had the next biggest contributions to the overall decline with drops of 81.9K and 150.2K, respectively. Click here to view Bespoke’s premium membership options for our best research available.


Bespoke’s Morning Lineup – 5/20/21 – Modest Weakness in Stocks and Data
See what’s driving market performance around the world in today’s Morning Lineup. Bespoke’s Morning Lineup is the best way to start your trading day. Read it now by starting a two-week free trial to Bespoke Premium. CLICK HERE to learn more and start your free trial.
“The typical trader wants to be right on every single trade. He is desperately trying to create certainty where it just doesn’t exist.” – Mark Douglas
Futures are modestly lower heading into the second to last trading day of the week, and the just-released economic data has been a modest disappointment. Initial Jobless Claims came in slightly lower than forecasts (444K vs 450K), but continuing claims were modestly higher (3.751 mln vs 3.63 mln). The Philly Fed Manufacturing report came in at 31.5, which is generally a strong number, but relative to April’s reading (50.2) and expectations (41.0), it was a disappointment.
Read today’s Morning Lineup for a recap of all the major market news and events including a recap of overnight economic and earnings data, as well as the latest US and international COVID trends including our vaccination trackers, and much more.
After big losses early on in the session, yesterday almost finished off as a major reversal day. The Nasdaq came up just shy of finishing the day in positive territory, but the Philadelphia Semiconductor Index (SOX), which traded down over 2% early on in the session, finished the day up just shy of 2%. Yesterday’s reversal also began just as the SOX was testing its lows from last week and the bottom of its six-month trading range. We should know soon enough whether this range will hold.

Mortgage Purchases and Refinancing Go In Opposite Directions
This morning, the Mortgage Bankers Association (MBA) released their weekly reading on mortgage purchase and refinance applications. Although the composite index was up 1.2%, purchases of homes have been a bit lackluster likely on account of the short supply of existing homes and rising costs to build new homes which we discussed yesterday. This week, the seasonally adjusted purchases index fell 4.2% and currently sits just above the recent low from the week of February 19th.

We would also note that seasonal tailwinds of mortgage purchases have now likely come and passed. As shown through the blue dots in the chart below, the annual peak in non-seasonally adjusted mortgage purchases typically comes at some point in March through May. The only exceptions of the past decade were last year and 2015.

While purchases have continued to decline, refinances have picked up a bit recently. That index rose over 4% this week as it is now back to the highest levels since the first half of March.

That uptick in refinances comes as the national average of a 30-year fixed rate mortgage has been on the decline after the surge in February and March. As of yesterday, the national average sat at 3.09% which is around similar levels to last fall. Again, while refinances have benefited from that decline in mortgage rates, it hasn’t appeared to have impacted purchases as supply is likely the bigger issue at play. Click here to view Bespoke’s premium membership options for our best research available.

Bespoke’s Morning Lineup – 5/19/21 – Splat
See what’s driving market performance around the world in today’s Morning Lineup. Bespoke’s Morning Lineup is the best way to start your trading day. Read it now by starting a two-week free trial to Bespoke Premium. CLICK HERE to learn more and start your free trial.
“Age doesn’t matter, unless you’re cheese.” – John Paul Getty
There’s not a lot of economic or earnings data to speak of this morning, but that hasn’t stopped traders from selling. Equity futures are down sharply this morning with tech leading the way lower. Nowhere is the severity of today’s weakness more pronounced than in the crypto markets.
Read today’s Morning Lineup for a recap of all the major market news and events including a recap of overnight economic and earnings data, a graphical summary of the current decline in bitcoin, as well as the latest US and international COVID trends including our vaccination trackers, and much more.
It’s looking like an especially painful day in the cryptocurrency markets today. While the sector has been under pressure for the last couple of weeks now, reports overnight regarding a crackdown by Chinese authorities have given traders another excuse to sell. While bitcoin is down over 10% this morning, other more speculative areas of the sector are down far more.
In the case of bitcoin, today’s decline takes the drawdown from its recent record highs to just over 40%. That’s steep no matter how you look at it, but would you believe that over the last ten years, bitcoin’s average drawdown from a record high on any given day is close to 50%, and on 69% of all trading days during this span bitcoin has been down more than 40% from its record high? One caveat here, though, is that while bitcoin isn’t even trading at its ‘average’ drawdown levels, given the market value, the amount of money ‘lost’ during this sell-off has been much steeper than any prior pullback. Make sure to check out page six of our Morning Lineup for additional charts summarizing the decline.

China ASHR ETF Trending Higher
After surging to 52-week highs at the very end of 2020 and into the new year, the Xtrackers CSI 300 ETF (ASHR) tracking China A-Shares collapsed back below its 50-DMA. The decline not only left the ETF in between its 50 and 200-DMA but also brought it back within the range between roughly $37 and $40 that traces back to the ETF’s range from November and December of last year. On Friday, that ended. ASHR popped almost 3% to not only move out of that range but also to finally move back above its 50-DMA for the first time since late April when there was a false breakout only lasting for a day. This time around, that breakout appears to be much less of a pump fake with a decent follow-through. Friday’s rally has continued into this week with ASHR up another 0.38% today following a 1.1% rally yesterday. The ETF now trades 3.86% above its 50-DMA which is now trending sideways rather than downward as it has for the past few months. Click here to view Bespoke’s premium membership options for our best research available.

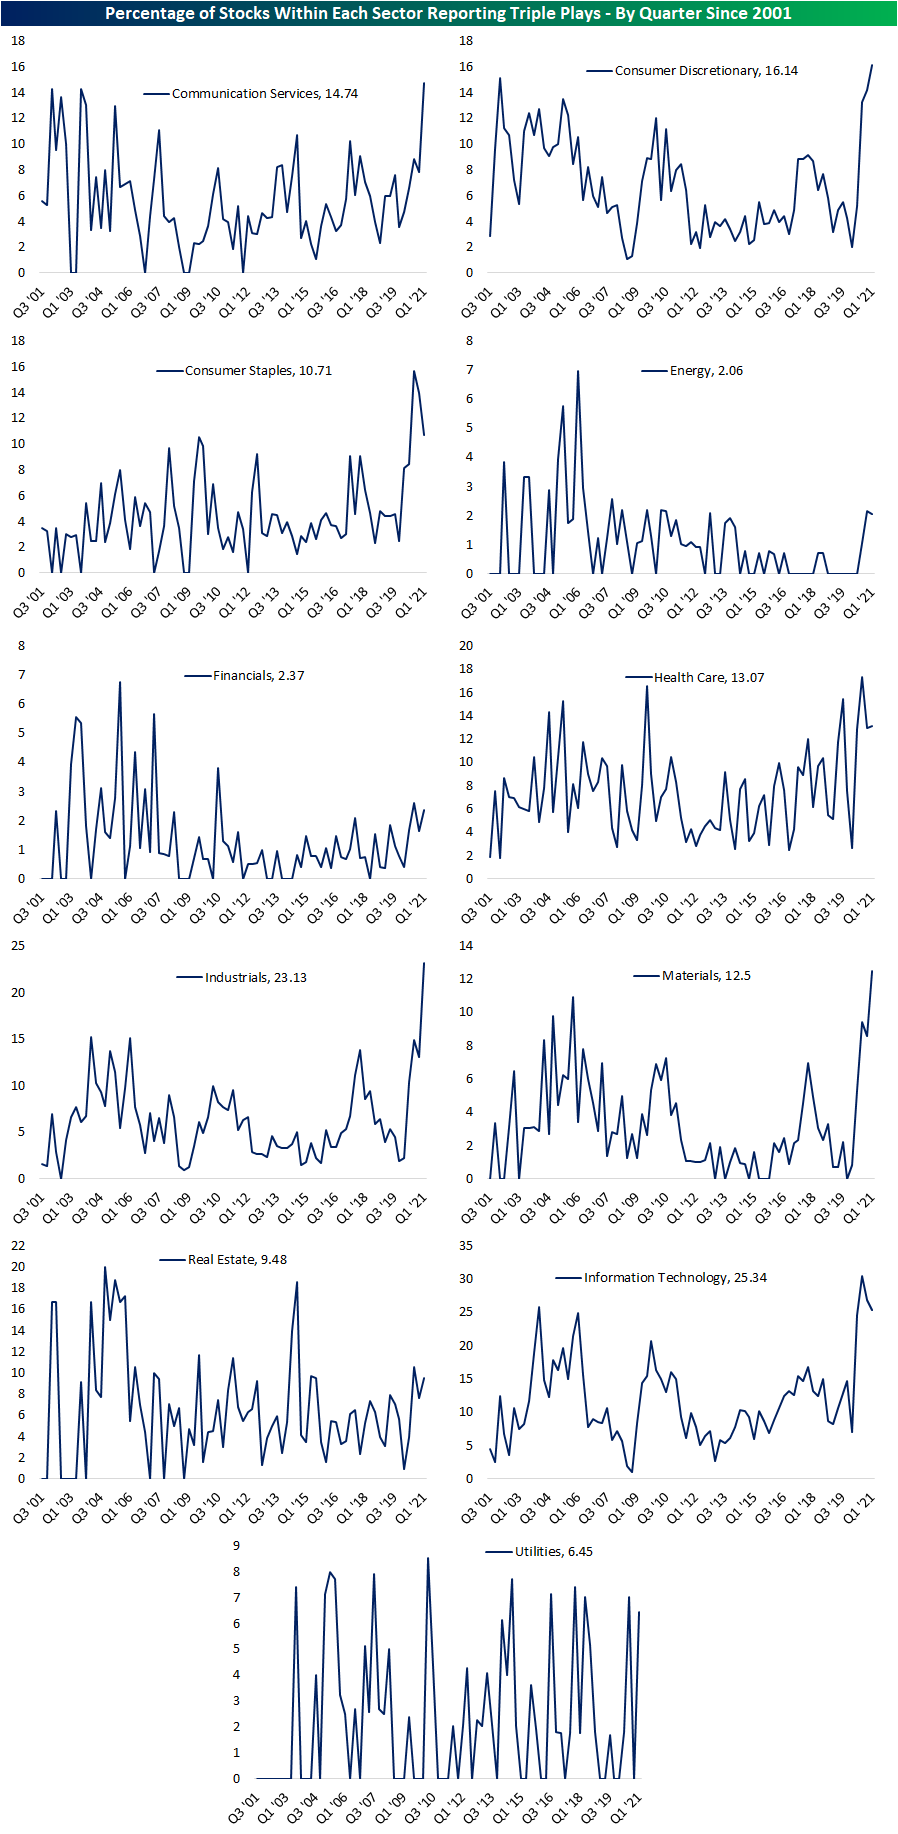
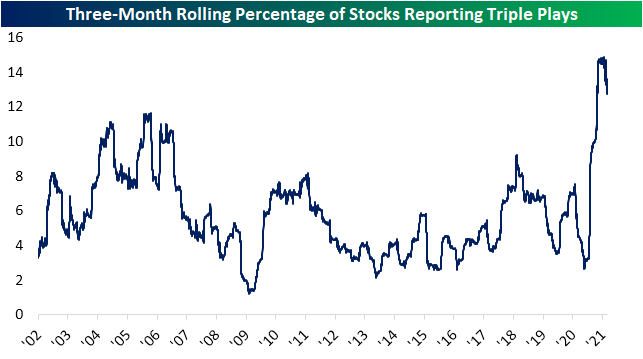
Still A Lot of Triple Plays
Although there are still a decent number of reports scheduled to come out over the next few weeks especially from major retailers, the pace of earnings slows significantly as Walmart’s (WMT) results out this morning marked the unofficial end of earnings season. With earnings season now more or less in the rearview, taking a look back at this past season, triple plays continued to come in at historically strong levels. A triple play is when a company reports EPS and sales above analyst forecasts while also raising guidance, which indicates a strong fundamental background for a company. In the chart below, we show the 3-month rolling percentage of stocks that are reporting triple plays. The past year has seen this reading skyrocket whether it be on account of dour forecasts and/or business quickly bouncing back from the pandemic. Even though the rate of triple plays did peak earlier in the year, currently, it sits around 14% which is still well above any reading prior to the past year.
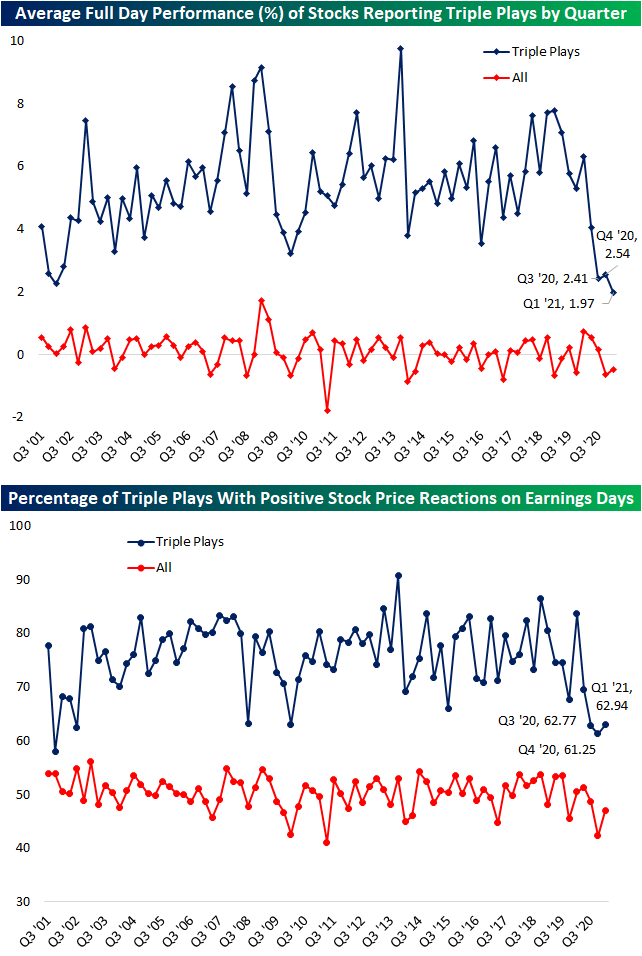
In aggregate, elevated beat rates this earnings season have been met with a yawn in terms of stock price reactions, and that has especially been true of the gold standard of beats: triple plays. As shown below, the average full-day performance on the earnings reaction day of those stocks that reported triple plays this season was only a 1.97% gain. While positive and much better than the 48 bps average decline for all stocks reporting this season, it does set a record for the worst collective reaction to triple plays of any earnings season going back to 2001 when our Earnings Explorer data begins. The past two quarters have similarly been met with historically weak reactions, but this past quarter has blown those out of the water. On the bright side, the percentage of triple plays that rose on their earnings reaction day did rise to 62.94% from 61.25%. That is the highest reading of the past few quarters, but again, is a historically muted reaction.
In the earlier days of this past earnings season, we had highlighted one other interesting trend regarding recent triple plays: it hasn’t been just one sector or group with strong beat rates, rather a high percentage of stocks are reporting triple plays regardless of their sector. Even with the aggregate percentage of stocks reporting a triple play having peaked, that strong breadth was still evident through the end of the current earnings season. The percentage of stocks reporting triple plays within the Communication Services, Consumer Discretionary, Consumer Staples, Industrials, Materials, and Tech sectors were all at a record high or had pulled back but were still above any reading prior to the past year. Some of the more remarkable readings came from Consumer Discretionary, Industrials, and Materials which have been well above any historical precedent. Even for sectors that did not necessarily see a large share of their stocks report triple plays compared to times in the past, like Energy or Financials, this quarter’s readings were still some of the strongest of the past several years. Click here to view Bespoke’s premium membership options for our best research available.