Optimism Growing Across Indicators
Whereas last week saw a big upswing in bullish sentiment in AAII’s weekly survey, this week’s readings were a snoozefest. Neither bullish, bearish, or nor neutral sentiment moved more than 1% either up or down. That is the first time this has happened since last August. Of those small moves, bullish sentiment’s move was the largest, pulling back half of one percentage point. The bulk of that loss went to neutral sentiment as bearish sentiment only rose 0.1 percentage points. As a result, the bull-bear spread edged slightly lower to 25.3%. Regardless of that decline, sentiment remains overwhelmingly positive with the bull-bear spread still around some of the highest levels since early December at the high end of the past several years’ range.

While that survey did not see much of a move, the Investors Intelligence survey of equity newsletter writers saw bigger changes. Last week, inverse to the AAII results, the Investors Intelligence survey took a more negative tone. Turning to this week, the survey finally reflected equities general move higher over the past couple of weeks. Bullish sentiment in this survey rose 4.9 percentage points to 55.9%. That is only the highest level since the end of February. Meanwhile, bearish sentiment fell a full percentage point to 19.6%. While lower, outside of last week that is still the highest reading since the first week of November. Additionally, a smaller share (24.5%) of respondents reported that they are looking for a correction as that reading fell to the lowest level in a month.

One other additional sentiment reading also took a more optimistic shift this week. The National Association of Active Investment Managers (NAAIM) Exposure Index tracks the equity market exposure of active money managers. Index readings of -200 would indicate the average manager is leveraged short, -100 would be fully short, 0 is 100% cash or market neutral, 100 would be fully long, and 200 would be leveraged long. From the week of February 10th up through last week, the index had fallen 31.73 points to a low of 48.62. That means reporting managers had the lowest long exposure to equities since last April. But this week that has reversed in a big way as the index jumped 29.93 points.

That ranks as the thirteenth largest one-week uptick in the index since July of 2006. As shown below, the last increase that was as large if not larger than the past week’s move was fairly recent occurring in the week of February 10th when the index jumped 31.13 points. Prior to that, April of 2019 was the last move as large as this week’s rise.Click here to view Bespoke’s premium membership options for our best research available.

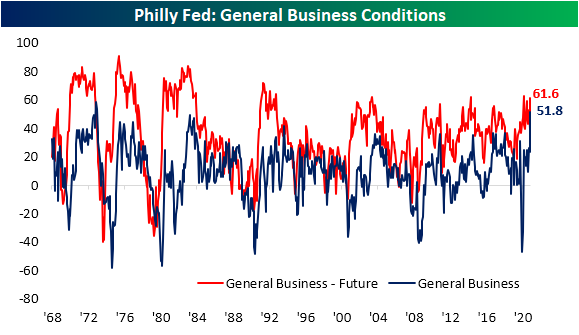
Historic Strength Out of Philly
It’s hard to get a report much stronger than this morning’s release of the Philadelphia Fed’s Manufacturing Report. The report showed the region’s manufacturing economy expanded rapidly in March across categories with similarly strong optimism with regards to the future. The headline number was expected to see only a 0.9 point increase from last month’s reading of 23.1. Instead, it more than doubled, leaping 28.7 points versus February’s reading. That is the largest one-month gain since the record 57.6 point increase in June of last year. Other than that, only September and October of 1980 have seen larger monthly moves in the data going back to 1968. Not only was the size of the move large, but at 51.8, the index reached the third-highest level on record behind March (58.5) and April (53.6) of 1973. Similarly, while not at the same sort of historic high, the expectations component of this month’s report also experienced a massive uptick that ranks in the top 1% of all monthly moves.
Given that strength in general business activity, it should come as no surprise that every index for current conditions came in the top decile of all readings with the same applying to some of the month over month moves. As for the indices regarding future expectations, the current levels are more modest relative to their historic ranges with only those for Delivery Times, Inventories, Number of Employees, and Capital Expenditures notably elevated. Like the current conditions indices, though, many of these saw moves that stand around the top 5% of all periods or better.
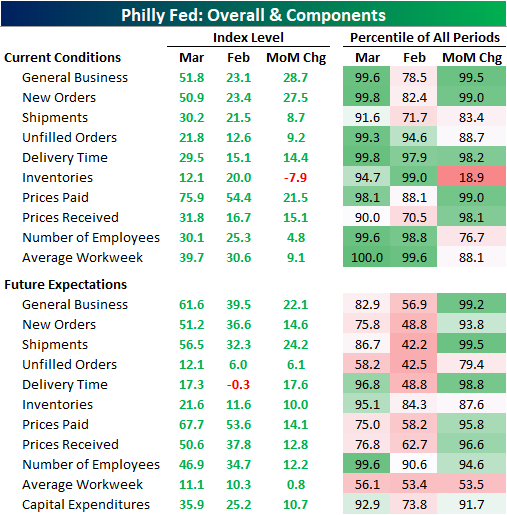
Demand was certainly a bright spot in this month’s report. The New Orders Index rose 27.5 points to the second-highest level on record. Like the index for General Business Activity, the only time that the New Orders Index was higher was back in March 1973. While the one-month gain still stands in the top 1% of all monthly moves, there was actually a larger increase just two months ago when the index rose 28.1 points. Given the rapid acceleration in New Orders, Unfilled Orders also has risen sharply and has only been higher four other times. The most recent of these was back in January, but once again, prior to that, you would need to go all the way back to 1973 or earlier for readings as high as now.
Considering the high level in new and unfilled orders, the reading in the Shipments Index was perhaps a bit more modest. In fact, the spread between the indices for Shipments and New Orders was at a record low in March. Although it is still at very healthy levels in the top 10% of all periods, at 30.5, the Shipments Index actually saw a stronger reading as recently as October. One potential factor in the difference between the growth in orders and products actually getting out the door could be related to supply chain disruptions. Higher readings in the Delivery Time Index indicate longer lead times. This month, the index rose up to 29.5 which is only a half-point below the record high in January. Meanwhile, the Inventories Index fell to the lowest level in four months.

As a result of all of this, prices (particularly prices paid) continue to accelerate at a rapid pace. The Philly Fed noted that over 77% of the responding firms to the survey reported higher input prices compared to 55% last month. That lead the Prices Paid Index to increase 21.5 points to 75.9; a level that has not been observed since early 1980. Expectations are also on the rise but are more toned down as that index rose 14.1 points to the highest level since only April 2018.
As for Prices Received, things are tamer albeit, at 31.8, this index is also at historically strong levels. While that is still several points below the higher level of 36.6 from two months ago, the last time readings above 30 were observed was back in the spring and summer of 2018.

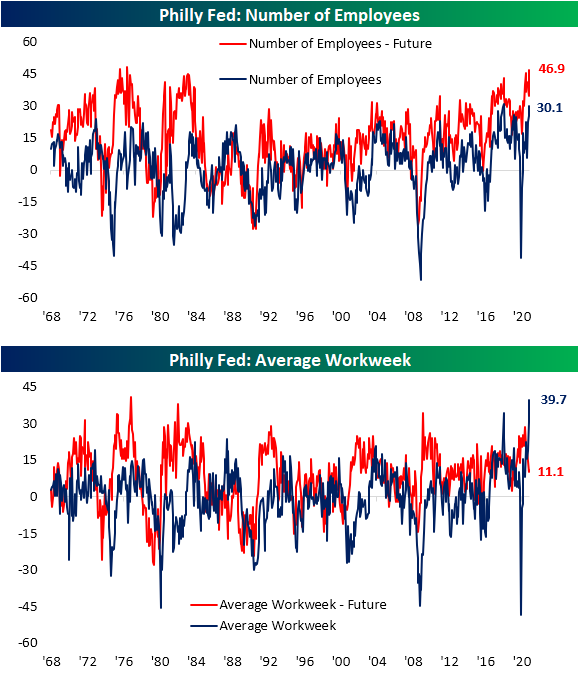
Today’s report also showed some very interesting trends concerning the labor market. The index for the Number of Employees rose to 30.1. The only time that it was higher was in May and June of 2018. The region’s firms also appear to want to continue to increase hiring down the road as the index for expectations reached 46.9. That is one of the highest levels on record with the last time such a level was reached being 1976. Even though firms are reporting more employees, the Average Workweek is skyrocketing. Last month, that index had reached 30.6 which was the second-highest reading on record. Fast forward to this month, the March print left both last month and the previous record of 34.2 from May 2018 in the dust. That increase in the average workweek is likely a result of firms doing more with less labor as they can’t fill certain positions. The special questions asked in the survey shed some additional light on this as 64.3% of companies reported labor shortages and 44.6% of job vacancies have been open for 3 or more months. Click here to view Bespoke’s premium membership options for our best research available.
Plenty to Like About Claims Despite Missing Expectations
Today’s release of initial jobless claims was anticipated to see a new low for the pandemic. Rather than the expected reading of 700K, though, seasonally adjusted claims surprisingly rose to 770K. That is the highest reading since the week of February 12th which was also the last time claims were above 800K. In addition to this week’s number unexpectedly rising, last week’s print was revised up from 712K (which was 1K above the pandemic low of 711K from early November) to 725K.

On a non-seasonally adjusted basis, regular state claims rose from 722.2K to 746.5K. From a seasonal perspective, that uptick is very unusual. In the data going back to 1967, only 5.5% of years have seen claims rise during the current (11th) week of the year. In addition to last year, the only other years that have seen unadjusted claims move higher WoW during the current week of the year were in 2017 and 1996. In spite of that unusual increase in the headline number, under the surface, there were a lot more silver linings.
Factoring in Pandemic Unemployment Assistance (PUA), the overall picture for claims was actually pretty good with total claims falling to 1.02 million, the lowest since the week of November 27th. PUA claims obviously drove that decline falling by just under 200K, coming in at 282.39K. That is the lowest level since the first week of the year when the program saw lapses due to the timing of the signing of the spending bill. Given that week was more or less an outlier, this week’s print would still mark one of the lowest readings since the program began just under one year ago.

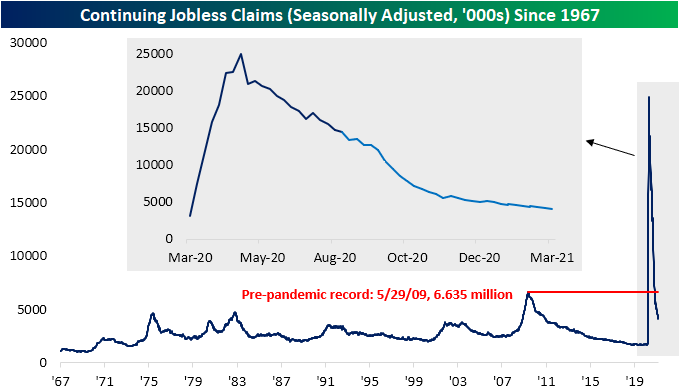
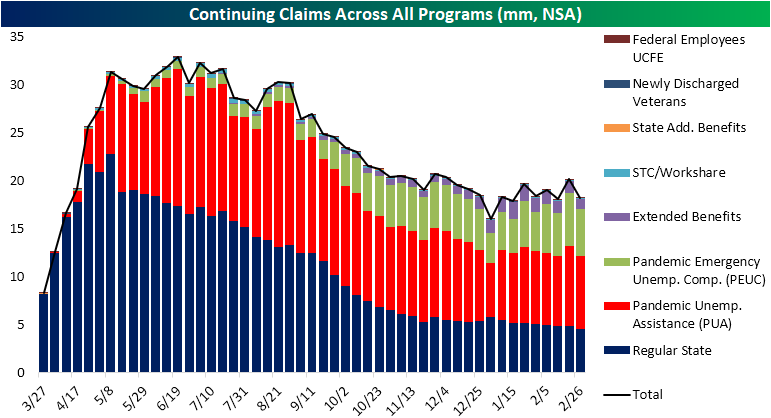
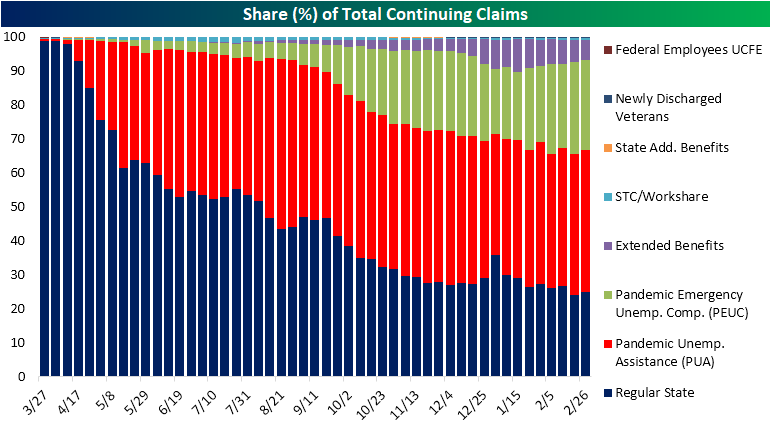
Continuing claims have continued to decline with this week’s reading of 4.124 million marking yet another pandemic low. Even though the 20K weekly drop marked the ninth consecutive week with a lower reading, this number was above expectations of a larger decline down to 4.035 million.
Including all programs adds some additional lag to the data meaning the most recent reading is through the last week of February. That week saw a reversal of the prior week’s uptick as total claims across all programs fell from 20.16 million to 18.25 million. That decline was a result of a drop across all programs although the PUA and PEUC programs accounted for the largest share with declines of 772.58K and 640.73K, respectively. The Extended Benefits program also saw its largest single-week decline of the pandemic period as it now sits at the lowest level since mid-December. Click here to view Bespoke’s premium membership options for our best research available.
Bespoke’s Morning Lineup – 3/18/21 – On Second Thought
See what’s driving market performance around the world in today’s Morning Lineup. Bespoke’s Morning Lineup is the best way to start your trading day. Read it now by starting a two-week free trial to Bespoke Premium. CLICK HERE to learn more and start your free trial.
“Faced with the choice between changing one’s mind and proving that there is no need to do so, almost everyone gets busy on the proof.” – John Kenneth Galbraith
After yesterday’s FOMC rate decision and Powell press conference, investors appeared to be comfortable with the Fed’s plan going forward. That sent treasury yields lower and equity futures higher. After sleeping on it, though, investors are having second thoughts. This morning equity futures are in the red with the Nasdaq especially feeling the pain, and Treasury yields are surging. In fact, Nasdaq 100 futures are currently well over 1% lower and threatening to take out their lows from Wednesday morning.
Economic data today was relatively busy with Jobless Claims and the Philly Fed just coming out and Leading Indicators scheduled to come out at 10:00 AM. Initial and Continuing Claims both missed expectations coming in higher than expected. Philly Fed was an enormous beat relative to expectations with the headline reading coming in at 51.8 and one of its highest readings ever and the best since 1973. Prices Paid was also extremely elevated, though, so that won’t help quell concerns over inflation.
Be sure to check out today’s Morning Lineup for updates on the latest market news and events, an update on economic data out of Asia and Europe, a recap of all the major central bank announcements since the close yesterday (there were a lot!), the latest US and international COVID trends including our series of charts tracking vaccinations, and much more.

The chart below encapsulates the drama in markets that surrounded the FOMC meeting. Yesterday, yields were sharply higher ahead of the meeting and started to come back in leading up to and after the announcement. Overnight, though, the rally in Treasuries and drop in yields subsided, and this morning, no one wants anything to do with US Treasuries as the 10-year yield has risen well above yesterday’s high and 1.7% to its highest levels since January of last year.

Gas Prices Accelerating
Along with just about everything else these days, prices at the pump have been surging this year. According to AAA, the national average price of a gallon of gas currently stands at $2.88 per gallon. To find the last time prices were this high, you have to go back to May 2019. This year alone, gas prices have already increased 27.7%. The table below compares the change in gas prices so far this year to the same time period in every other year since 2005, while the chart compares the trend in prices this year to a composite pattern of all other years. At the current price level, gas prices are the highest they have been at this point in the year since 2014, and there have only been five other years where prices were higher.
What really stands out, though, is how fast prices have increased. Prior to 2021, there wasn’t a single year since 2005 that the national average price increased by more than 20% YTD through 3/17, but this year, they’re already up 27.7%! Based on the typical seasonal pattern, don’t expect much in the way of relief anytime soon. Typically, prices at the pump rise right up through Memorial Day and then level off for the summer before easing in the last four months of the year.

The recent rise in gasoline prices has also been incredibly consistent. It has now been 52 straight days that the national average price has gone without a one-day decline and represents just the fourth streak of 50 or more days since 2005. The longest streak ended at 76 days in early 2019 (the last time prices approached $3 per gallon) while the only two other streaks were in 2007 and 2009.

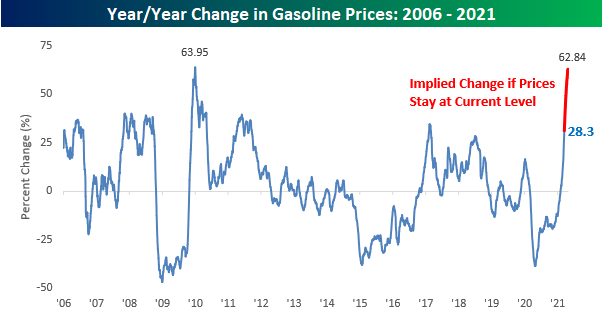
With the early stages of the COVID outbreak now a year in the rearview mirror, we’re starting to see some crazy y/y moves in gas prices and these moves are only going to get more extreme as we approach the one-year anniversary of crude oil prices going negative. The average price of a gallon of gas is up 28.3% versus a year ago which is already the highest y/y pace in four years. In the weeks ahead, though, this y/y rate is almost guaranteed to increase. As mentioned above, gas prices typically rise between now and the end of April, and in the 16 years since 2005, there have only been three years where prices declined between now and 4/30. Not only that, but during the period from 3/17 through 4/30 last year, gas prices decline more than 20%. Therefore, even if prices stay flat between now and 4/30, the y/y increase will surge to 62.8%, which would be just shy of a record y/y pace. The FOMC may be pulling out all the stops to get inflation higher, but unless you own a gas station, these trends in gas prices are painful. Start a two-week free trial to Bespoke Institutional for full access to all of our research and market commentary.
Bespoke’s Morning Lineup – 3/17/21 – Walking the Tightrope
See what’s driving market performance around the world in today’s Morning Lineup. Bespoke’s Morning Lineup is the best way to start your trading day. Read it now by starting a two-week free trial to Bespoke Premium. CLICK HERE to learn more and start your free trial.
PELLEY: Fair to say you simply flooded the system with money?
POWELL: Yes. We did.
Ten months ago, Fed Chair Jay Powell appeared on 60 Minutes to explain the Federal Reserve’s unprecedented response to the COVID pandemic and assure Americans that the Fed would be there at the ready to provide whatever financial support the economy needed. As the exchange between Pelley and Powell above indicates, Powell was pretty blunt in his explanation. Today, market participants eagerly await the Fed Chair’s explanation for how the Committee plans to proceed now that the US appears to be coming out from the other side of the pandemic. It’s much easier to throw money at a problem than it is to take that money back when the problem starts to go away, so it’s pretty safe to assume that the Fed Chair will be a lot more nuanced with his comments today than he was last May.
It may be St Patrick’s Day, but there’s not a lot of green on the screens today as US equity futures (especially the Nasdaq), commodities, Treasuries, and even bitcoin are all mostly flat to lower on the day. Housing Starts and Building Permits were just released, and following yesterday’s weaker than expected homebuilder sentiment report for March, these reports (based on February data) both came in significantly weaker than expected. Despite the miss, though, US Treasury yields haven’t pulled back, so there’s been no relief for the Nasdaq.
Be sure to check out today’s Morning Lineup for updates on the latest market news and events, an update on economic data out of Asia and Europe, the latest US and international COVID trends including our series of charts tracking vaccinations, and much more.
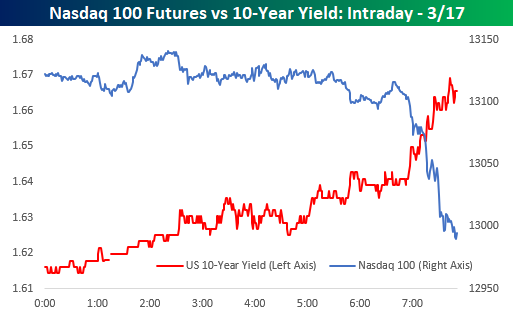
To say the balancing act the FOMC finds itself in is delicate would be an understatement. An intraday chart of the 10-Year US Treasury Yield versus Nasdaq 100 futures provides an excellent example. Just after 6 AM eastern treasury yields spiked higher and the pavlovian response in the equity futures markets was to hit the bids sending futures sharply lower. Powell sure has his work cut out for him this afternoon!
Sentiment Holding Back Homebuilders
The National Association of Home Builder’s measure of homebuilder sentiment fell again in March. Although the index’s 2 point decline down to 82 leaves it 8 points off the November record high, the current level of sentiment is still a few points above the pre-pandemic record high.
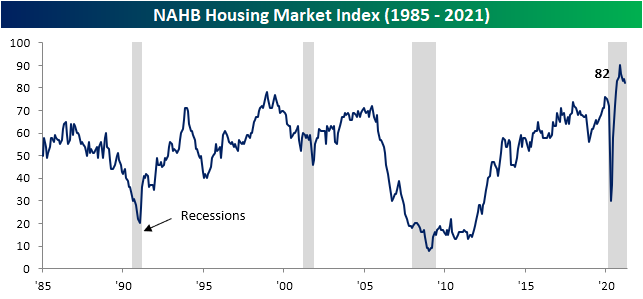
A decline in present sales drove that decline as the index fell 3 points from 90 to 87. As with the headline number, although that is a decline from the peak of 96 in November, the current reading is still above anything recorded prior to the pandemic. Additionally, considering the indices for Future Sales and Traffic have held up better, that decline in Present Sales does not necessarily point to a broader downturn in demand. Even though Present Sales were lower, the index for Future Sales rose by 3 points recovering the ground lost in February while Buyer Traffic also avoided a decline as that index went unchanged from February. Again rather than a broader deterioration of conditions, the decline in Present Sales could be a result of issues like rising prices of things like lumber and higher mortgage rates which in turn means overall higher costs of a new home.

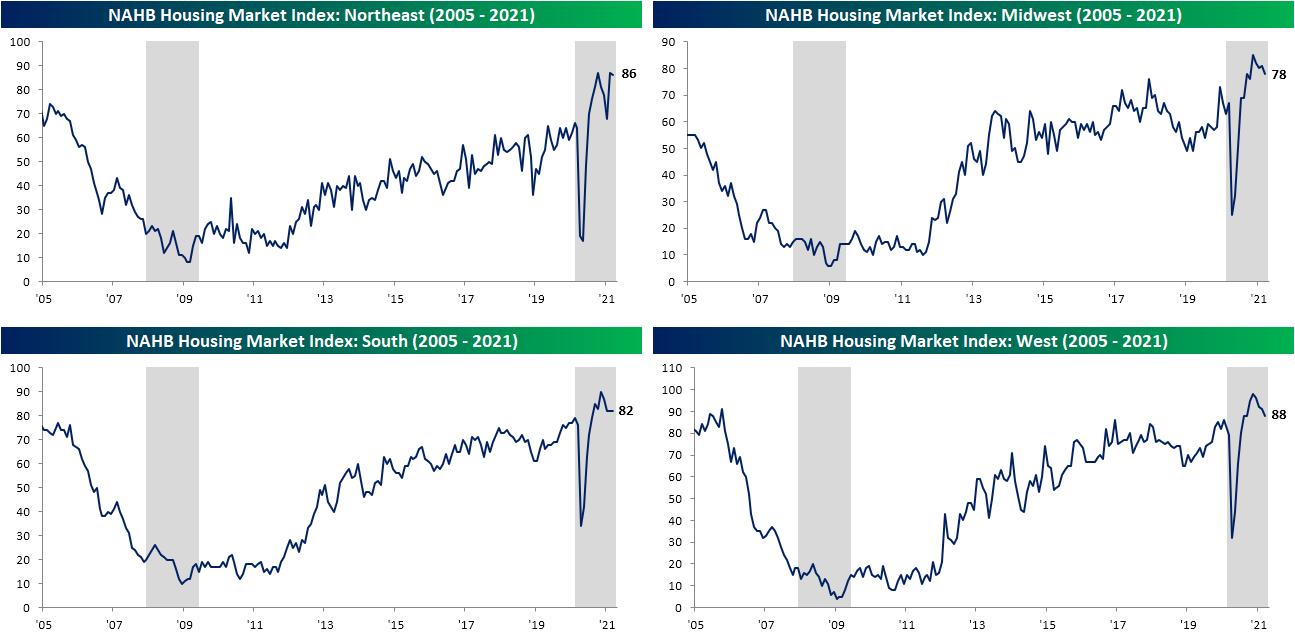
The South was the only region to avoid a decline in March. That index held steady at 82 for the third month in a row. The Northeast also fared a bit better than the other regions as the index only fell one point from last month’s level that was tied with October for a record high. The Midwest and the West fell more sharply with each index dropping 3 points. Regardless of those declines, both indices continue to come in at historically strong levels.
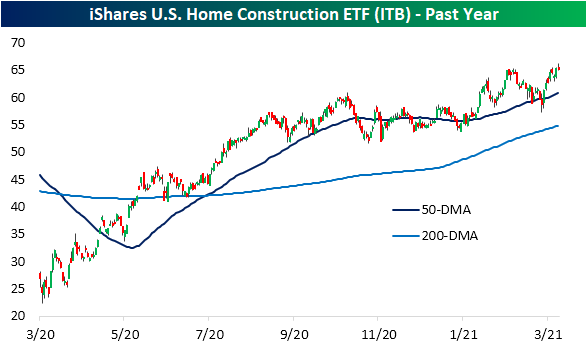
With the weaker headline release providing a bit of a headwind in terms of catalysts, the iShares Home Construction ETF (ITB) is fighting to break out and hold above its early February highs today. Last week it unsuccessfully tried to take out resistance, but still remains right below its prior highs.
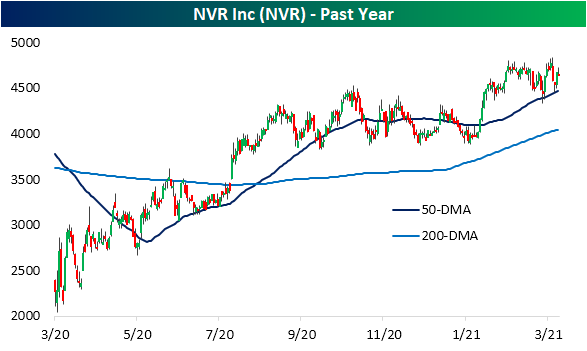
Looking across S&P 1500 homebuilder stocks, there are two in our Trend Analyzer tool that currently earn “good” timing scores: TopBuild (BLD) and NVR (NVR). Whereas the broader group is testing 52-week highs, BLD and NVR are some of the few that are not currently overbought having recently pulled back a bit. After taking a brief dip below its 50-DMA late last month, BLD has been fluctuating around its moving average over the past few days. NVR on the other hand was unsuccessful in breaking out last week which was followed by a successful bounce off of its 50-DMA yesterday. Start a two-week free trial to Bespoke Institutional to access our interactive economic indicators monitor and much more.

Bespoke’s Morning Lineup – 3/16/21 – Retail Sales Reset
See what’s driving market performance around the world in today’s Morning Lineup. Bespoke’s Morning Lineup is the best way to start your trading day. Read it now by starting a two-week free trial to Bespoke Premium. CLICK HERE to learn more and start your free trial.
“Change is the law of life and those who look only to the past or present are certain to miss the future.” – John F. Kennedy
In what seems like a change of pace from recent weeks, Nasdaq futures are leading the way higher this morning as it is actually the only one of the major indices indicated to open higher on the day. Futures weakened modestly following the release of the February Retail Sales report, and the 10-year yield is still slightly lower. The headline Retail Sales readings came in well below consensus forecasts, but mitigating factors like the storms that hit the midwest and a big upward revision to January’s report helped to soften the blow. Next up on the economic calendar is Industrial Production and Capacity Utilization at 9:15 Eastern and then Business Inventories and Homebuilder Sentiment at 10 AM.
Be sure to check out today’s Morning Lineup for updates on the latest market news and events, including a recap of moves in the rates market overnight, an update on inflation data out of Europe, Australian Housing and Central Bank data, economic sentiment, the latest US and international COVID trends including our series of charts tracking vaccinations, and much more.
Yesterday, we highlighted the fact that semis have been lagging the broader market rally. Despite the weakness, the SOX had a positive start to the week yesterday and actually managed to close back above its 50-DMA for the first time since late February. It’s a start.
Lastly, if you didn’t catch it yesterday, make sure to check out yesterday’s CNBC segment with Paul Hickey discussing markets and the state of business travel in the future.

Big Expectations Out of New York
This morning the New York Fed released its monthly reading on the region’s manufacturing sector. The headline index was expected to move up to 15 from February’s reading of 12.1. Instead, the increase was even larger as the index rose 5.3 points to 17.4. In addition to that being the ninth consecutive month that the region’s manufacturing sector expanded, it also surpassed the summer high of 17.2 making for the strongest reading since November 2018.

In addition to the headline number moving higher, every other indicator also continues to show expansionary readings painting a broadly positive picture for the region’s manufacturers. The only indices to show any deceleration in March were those for New Orders and Number of Employees. Six-month expectations also remain positive, although there were more of these that were lower on a month-over-month basis.

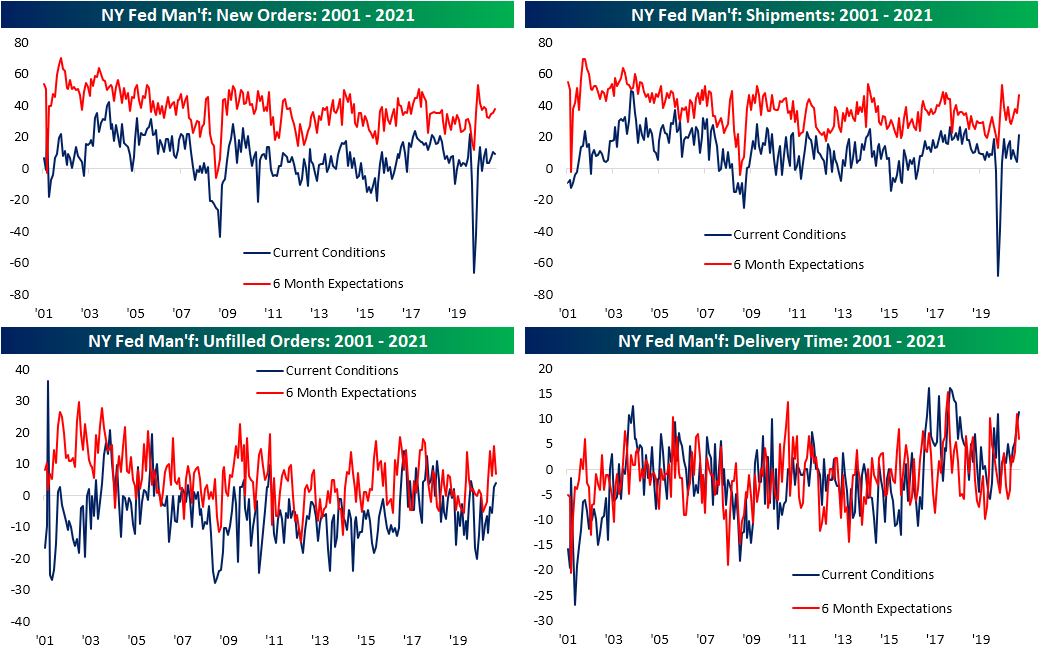
As previously mentioned, New Orders was one of just two areas in the report to experience a deceleration in March. Falling to 9.1, this month’s reading sits in the middle of its historical range still consistent with a seventh straight month of growth in new orders. Other related indicators remain much stronger though.
With orders still growing, the index for Unfilled Orders expanded for a second month in a row climbing to the highest level since February of last year. Shipments picked up even more significantly. The index rose 17.1 points to 21.1. That is the ninth-largest month-over-month increase since the start of the survey in 2001. The most recent moves of similar or larger size were 29.1 and 42.3 point increases in May and June, respectively, of last year. As with the headline number, that is now the highest level since November 2018. Although shipments are accelerating, Delivery Times were also higher. That index now sits in the top 3% of readings
In spite of those long lead times and high demand, inventories are rising with that index gaining 1.6 points to the highest level in just over a year. Like delivery times, that stands in the top decile of readings. Looking to the future, responding firms broadly expect higher inventory levels six months down the road. That index climbed 4.6 points to 19.5 which is the second-highest reading on record behind a print of 20.3 in January 2018.

Another area of the report that continues to come in notably high is prices. Generally speaking, price increases and expectations for price increases are being reported at one of the highest clips of the past decade. Both indices for Prices Paid and Received currently are in the top 3% of all readings. Starting with a look at Prices Paid, March marked the eighth month in a row that the index rose month-over-month as it has reached the highest level since May of 2011. Similarly, expectations came in at the highest level in nine years. While Prices Received have only risen three months in a row, it is also at the highest level since May of 2011 and expectations are at the highest level since April of 2011.

While current and future indices are moving in sync with one another with regards to prices, those for employment moved in opposite directions. The index for Number of Employees was still consistent with further employment gains in March, but the index fell to the lowest level since November. While hiring growth decelerated, responding firms are much more optimistic when it comes to employment six months down the road. That index climbed 14.8 points to 31.4. That was the fourth-largest uptick on record. The only larger one-month moves were in March 2008 (+22.8 to 31.9), October 2001 (+20.5 to 12.3), and September 2004 (+16.1 to 29.2). The index is now at the highest level since June 2010.
As for Average Workweek, things were a bit more modest with the current conditions index rising to the highest level since October. Again, the index for expectations was even stronger rising to a two-year high. Click here to view Bespoke’s premium membership options for our best research available.

Bespoke’s Morning Lineup – 3/15/21 – Small Seeking Seven
See what’s driving market performance around the world in today’s Morning Lineup. Bespoke’s Morning Lineup is the best way to start your trading day. Read it now by starting a two-week free trial to Bespoke Premium. CLICK HERE to learn more and start your free trial.
Capital isn’t scarce, vision is.” – Sam Walton
Small-cap stocks are looking to continue a big streak today with the Russell 2000 looking to extend its current winning streak to seven straight days. Right now, the streak’s prospects aren’t looking great as Russell 2000 futures, along with the Nasdaq, are marginally lower as Treasury yields rise.
The economic calendar is quiet today with Empire Manufacturing the only major report on the calendar. While consensus estimates called for a headline reading of 13.0, the actual print came in at 17.4, which was the highest level since October 2018.
Be sure to check out today’s Morning Lineup for updates on the latest market news and events, including a recap of moves in the rates market overnight, an update of moves in the Asian and European market, Chinese economic data, an update on the latest national and international COVID trends, including our series of charts tracking vaccinations, and much more.
Below, we show the intraday charts of the S&P 500, Nasdaq 100, Russell 2000, and the Philadelphia Semiconductor Index (SOX) over the last four weeks. For the first three indices, last week was a big one as they put an end to their streaks of lower highs last week. The one outlier was the SOX. It too rallied last week but not by nearly enough to break its own downtrend. For an index that historically acts as a leading indicator for the broader market, the relative underperformance of the SOX isn’t ideal.
