Bespoke Market Calendar — August 2021
Please click the image below to view our August 2021 market calendar. This calendar includes the S&P 500’s average percentage change and average intraday chart pattern for each trading day during the upcoming month. It also includes market holidays and options expiration dates plus the dates of key economic indicator releases. Start a two-week free trial to one of Bespoke’s three research levels.

Materials Go For Ten
While the S&P 500 finished last week slightly lower, the general theme across each of the eleven sectors was mean reversion. As shown in the snapshot of our Trend Analyzer below, the best performing sectors were those that are coming from oversold territory or below their 50-DMAs: Materials (XLB), Energy (XLE), and Financials (XLF). XLB was the top performer of these with its 2.8% gain resulting in it exiting oversold territory, and Friday’s close saw the sector finish above its 50-DMA for the first time since June 14th. Conversely, some of the sectors that have recently been at more overbought levels like Consumer Discretionary (XLY) and Communication Services (XLC) were the worst-performing sectors. XLY came back within one standard deviation of its 50-DMA on that move.

Over the past few weeks in our Sector Snapshot, we have noted the consistent oversold readings that the Materials sector has seen, but as noted above, the strong run recently has brought it back not only within a standard deviation of its 50-DMA but above its 50-DMA for the first time in a month and a half. Additionally, it hasn’t been just the last five trading days. Friday’s higher close extended the sector’s winning streak to nine days long. As of this morning, the sector is again higher and looking to extend its streak to double digits. If the Materials sector keeps alive its winning streak, it would be the first double-digit winning streak since an 11-day long streak for Consumer Discretionary ending on July 6. As shown in the second chart below, for the Materials sector that would be the first 10-day winning streak since last June and before that, you would need to go back to the end of 2013 for a streak as long. While still uncommon, there is also some historical precedence for other nine-day-long streaks scattered throughout the past few decades.


Looking at those past winning streaks of nine or more days long, the current one has actually seen a relatively modest gain through the first nine days of 5.91%. Similarly, the S&P 500 is up by a below-average amount through the first nine days of those prior streaks. Click here to view Bespoke’s premium membership options.

Bespoke Brunch Reads: 8/1/21
Welcome to Bespoke Brunch Reads — a linkfest of the favorite things we read over the past week. The links are mostly market related, but there are some other interesting subjects covered as well. We hope you enjoy the food for thought as a supplement to the research we provide you during the week.
While you’re here, join Bespoke Premium with a 30-day free trial!
COVID Research
Outbreak of SARS-CoV-2 Infections, Including COVID-19 Vaccine Breakthrough Infections, Associated with Large Public Gatherings — Barnstable County, Massachusetts, July 2021 by Brown et al (CDC)
A detailed investigation of how the Delta variant acts on vaccinated persons; the data suggest that vaccinated people still face a significant risk of contracting the virus and material risk of symptomatic infection with the same viral load as unvaccinated persons, but existing vaccines do an excellent job protecting against both hospitalization and death. [Link]
Comparison of Neutralizing Antibody Titers Elicited by mRNA and Adenoviral Vector Vaccine against SARS-CoV-2 Variants by Tada et al (Bioxriv)
Lab-based experiments show that antibodies from mRNA vaccines are slightly less effective against Delta while adenovirus-vector Johnson & Johnson jabs are much less effective, basically consistent with the findings of the above CDC study. [Link; 30 page PDF]
Athletics
Athletes Greatly Benefit from Participation in Sports at the College and Secondary Level by James J. Heckman & Colleen P. Loughlin (NBER)
This study catalogues average student benefits from participation in college athletics, where participants tend to enjoy higher graduation rates, better jobs after college, and higher earnings. The authors do not compare foregone earnings for high-potential athletes to identify opportunity costs. [Link]
Barstool Sports Taking Over AZ Bowl From CBS to Broadcast Online by Emily Caron (Yahoo!)
Irreverent sports media company Barstool will broadcast a college football bowl game on its platforms next season, part of a broader diversification of the multi-faceted business. [Link]
Tokyo
Time For The End Of The Teen Gymnast by Dvora Meyers (538)
An indictment of the post-1960s practice of launching young people (especially young girls) into extremely high intensity athletics via gymnastics competitions. Note: this article was published the day Simone Biles withdrew from Tokyo, but is not a response to that specific situation. [Link]
Team USA Trails in the Other Tokyo Olympics Medal Table: Vaccinated Athletes by Rachel Bachman and Georgi Kantchev (WSJ)
While delegations from Italy and Spain have been entirely vaccinated, the US looks more like Poland with almost 15% of athletes not inoculated against COVID before arriving in Tokyo. [Link; paywall]
Tokyo 2020: S Korea TV sorry for using pizza to depict Italy (BBC)
A South Korean broadcaster is in hot water for depicting Italy with pizza, Romania with Dracula, and perhaps most depressingly Ukraine with Chernobyl in its introductions to the Tokyo Olympics. [Link]
Food
Slice of Charles and Diana’s 40-year-old wedding cake to be auctioned (BBC)
A slice of wedding cake given to a member of the Queen Mother’s household back in 1981 has been preserved since and will be sold at auction, for reasons that escape us. [Link]
Sun, Sand, and Spaghetti by Mike Diago (Eater)
An investigation of the niche but fascinating question “why do Dominican-Americans bring spaghetti to the beach?”, filled with history on the Dominican diaspora, food culture, and the appeal of noodles in the hot sun. [Link]
Infrastructure
Small Cities Can’t Manage the High Cost of Old Infrastructure by Jake Blumgart (Governing)
Cities with more limited tax bases that want to make changes to infrastructure either due to cost of maintenance or shifts in their populations’ needs are in deep trouble as tax bases erode and costs rise. [Link]
Police Are Telling ShotSpotter to Alter Evidence From Gunshot-Detecting AI by Todd Feathers (Vice)
Audio tools that locate the sound of gunfire via algorithm can be overridden to provide different evidence when it suits prosecutors per recent filings in murder cases from Chicago. [Link]
Banking
Credit Suisse Claws Back Pay as It Faults Staff for Archegos by Marion Halftermeyer (Bloomberg)
Former execs lost $70mm in compensation and 9 were fired as a result of the $5.5bn in losses booked by the bank over the Archegos blow-up earlier this year. [Link; soft paywall]
Investing
America’s Investing Boom Goes Far Beyond Reddit Bros by Talmon Joseph Smith (The Atlantic)
A survey of the broader world of novice investors that extend beyond the most high-profile communities like r/wallstreetbets. [Link; soft paywall]
Economics
Earnings and Income Penalties for Motherhood: Estimates for British Women Using the Individual Synthetic Control Method by Giacomo Vagni and Richard Breen (European Sociological Review)
British mothers see medium and long term earnings reduced by about 45% when they have children, though interestingly on average households that those women are a part of do not suffer from income declines. [Link]
Great Expectations
A Key Gauge of Future Inflation Is Easing by Gwynn Guilford (WSJ)
Consumer surveys and financial markets proxies for future inflation are not showing the same kind of concerns as short-term metrics of realized inflation. [Link; paywall]
Birds
What we know about the mystery bird death crisis on the East Coast by Natasha Daly (NatGeo)
Birders across the eastern US have recorded a massive surge in deaths of fledgling songbirds, with the causes a complete mystery. [Link]
Read Bespoke’s most actionable market research by joining Bespoke Premium today! Get started here.
Have a great weekend!
Small Dent in Elevated Equities
As we have highlighted in the past, the long-term charts of various stock markets from around the world are broadly extended after big moves higher over the past year and a half. While they only put a minor dent in those moves, across the world there have been some pullbacks recently. Of the G7 countries, only two are not that extended: Italy and the UK. In the case of the former, it did break out earlier this year which was followed by a 7.2% pullback from early June through July 19th. Since that low, Italian equities have been returning up to those prior highs and are now 1.79% away. UK equities, on the other hand, continue to sit below their highs from a few years ago but are trending higher. While Japan surged in 2020 and early 2021, it has been in a more prolonged pullback over the past several months.

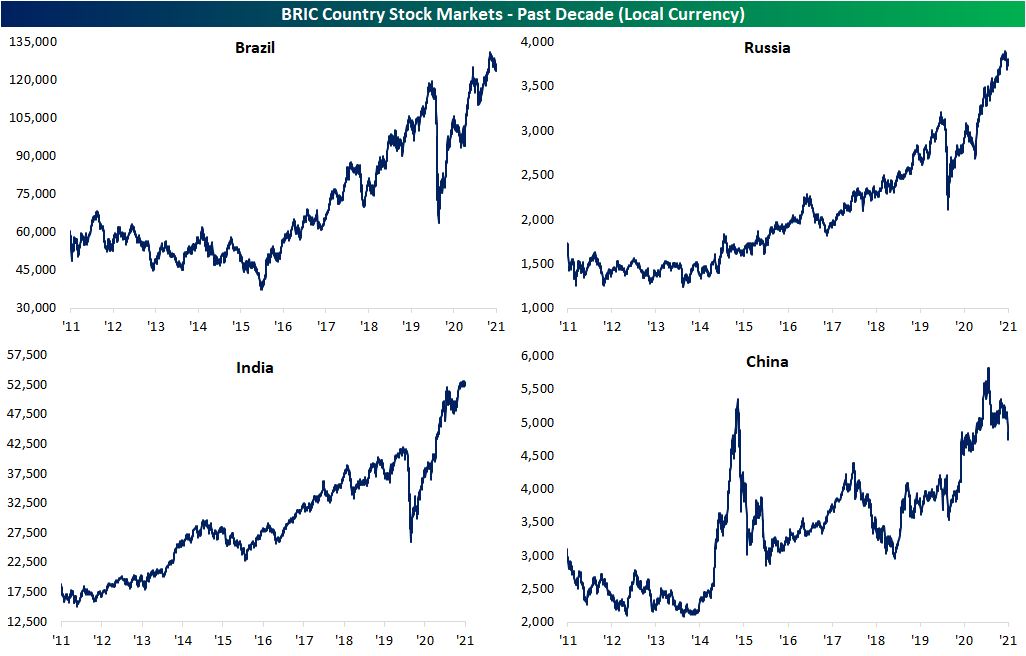
As for the BRIC countries, the picture has been more mixed. While Brazil surged higher earlier this spring, the country’s equity market has been in a downtrend over the past couple of months. Russia has been in a more uninterrupted uptrend, although it too has been pulling back from its highs this month. While a deteriorating COVID picture earlier this year had hit Indian equities hard, they quickly rebounded to new highs by early June. In the roughly two months since then, Indian stocks have been trending sideways. At the start of the year, Chinese equities had broken out above the mid-2010s high, but the country’s stocks have since given up the ghost. That is especially the case over the past couple of weeks given worries surrounding regulatory risks. Click here to view Bespoke’s premium membership options.
A Long Post on “Short Form”
When it comes to media consumption there is a new kid on the block and it has been a popular topic in a number of conference calls this earning season: “Short Format Video”. Short Format Video, or SFV for short, describes videos that are typically less than two minutes long but are still able to get a message through in an engaging way. Whether you’ve personally get sucked into an endless stream of these videos or watched someone you know do the same, these videos can be extremely addicting. That might be a big concern for parents and psychologists, but for companies looking to take or keep an even larger share of consumers’ waking (or sleeping) hours in their ecosystems, this is the hot tool they have plowed into to generate even more ad dollars in what many already considered a saturated market.
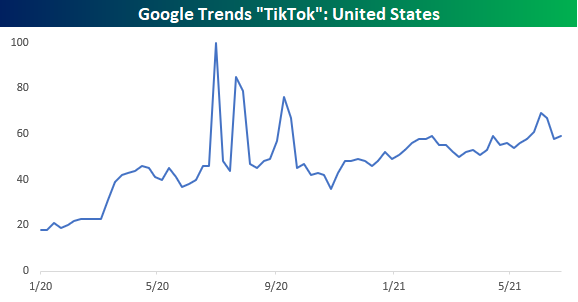
The SFV trend was brought to the forefront by TikTok’s monster global growth. Since ByteDance (developer of TikTok) is a private Chinese company, its internals are opaque, but due to the company’s legal feud with the Trump administration, it was revealed that as of August 2020, TikTok had 689 million monthly active global users, representing an almost 1200% increase from January of 2018. Additionally, as of December 2020, the app had been downloaded over 2.6 billion times and the company is rumored to have taken in a profit of 3.3 billion dollars for the fiscal year of 2020.
In terms of Google search trends for “TikTok” in the US, outside of some spikes last summer when TikTok was embroiled in its legal dispute with the Trump Administration, search activity has been steadily rising over time, so you may consider SFV a fad, but it has some staying power. With growth and profits like this, is it any surprise that social media companies have been focused on copycatting their way to get a slice of the SFV pie?
Starting with the most notorious ‘borrower’ of ideas in the social media space, Facebook has been quietly experimenting with how to best insert the SFV alchemy into their social media empire since as far back as 2018 when it created a standalone app called Lasso. Lasso didn’t really go anywhere, but as Facebook wound it down in 2020, it handed the baton over to Instagram’s Reels which was launched in Brazil in late 2019. From Brazil, Reels slowly expanded to more countries until it was launched globally in August of 2020. As of the Q2 2021 earnings call, Reels was the largest contributor to engagement growth on Instagram.
When Facebook first announced the Reels feature, there was a ton of interest in terms of Google searches. While much of the initial hype was short-lived, search interest has stayed at a pretty steady state ever since. It also would make sense that since most people already have Instagram, they didn’t have to search Google to find it.

Alphabet has also been increasingly active in the SFV space and despite little emphasis on the new feature, it has seen some success. YouTube first rolled out the beta version of “YouTube Shorts” on its mobile app in India back in September of 2020. The US launch followed back in March 2021, and the feature was launched globally this month. So far, YouTube SHorts appears to be a success as Alphabet noted in its Q2 2021 earnings call that YouTube Shorts surpassed 15 billion views on a daily basis.
Search trends also reflect the recent surge in popularity. While the feature was launched in the US back in September, search interest for the feature started to take off at the start of the year.

Snap added its Spotlight feature to their app last November. Spotlight allows users to share short-format videos publicly, and in order to entice users to use the service, Snap promised that it would make daily payouts of $1 million throughout the remainder of 2020 to users whose Snaps made it to the top of this feature. The strategy apparently worked. In the Q2 2021 earnings call, Snap noted that daily time spent per user on Spotlight increased 60% QoQ, with daily active user growth of 49%, and daily content submissions tripling during the same time!
Search interest in the Spotlight feature for Snap quickly accelerated following its launch late last year right up through the first quarter of 2021 but has tailed off since April. The decline in search interest, though, doesn’t appear to be affecting adoption of the service, but again, like Reels, given the ubiquity of the app and the age demographic of its users, Google probably wasn’t the first place the Snap demo would go to learn about the Spotlight feature. Another reason for the decline in search interest could also be tied to the fact that search interest peaked right around the time that Snap reduced the amount it was paying creators to use the feature.

Strangely, TWTR was the first mover in the American space with Vine gaining major success in 2013. While originally successful, Vine was eventually shut down as the company had trouble monetizing the feature. Twitter tried again last November with its Fleets feature, which included photos and videos but just announced this month that they would wind down that service in August due to a lack of engagement. One potential cause for Fleets not catching on was the fact that unlike all of these other SFV features, Fleets only included content from the user’s network as opposed to an algorithmic push from all global content.
SFV, like most media technologies, experienced a major boost in adoption during the pandemic, but it is interesting to see how quickly the major social media platforms adapted to this. Facebook had been in process of experimenting with SFV when it added a looping video feature in 2013 (in part to compete with Vine), but since 2019 the company had been trying to specifically accrue some of that TikTok shine. This willingness to adapt to new trends and experiment with their implementation is shown in how the company was early to discuss its SFV feature in conference calls as early as Q4 2019. Judging by the number of mentions on conference calls, Snap seems to be the most enthusiastic about its SFV feature, mentioning it more than the others in each of its last three earnings calls and more than any other call in its call earlier this month. Alphabet, on the other hand, seems to be later to the party, as the company has yet to release a fully complete SFV tool, and yet still experiencing major success simply to their scale.

Bespoke’s Morning Lineup – 7/30/21 – Amazon Leads Nasdaq Lower
See what’s driving market performance around the world in today’s Morning Lineup. Bespoke’s Morning Lineup is the best way to start your trading day. Read it now by starting a two-week trial to Bespoke Premium. CLICK HERE to learn more and start your trial.
“Friends congratulate me after a quarterly-earnings announcement and say, ‘Good job, great quarter,'” Bezos said to Forbes. “And I’ll say, ‘Thank you, but that quarter was baked three years ago.’ I’m working on a quarter that’ll happen in 2021 right now.”
It doesn’t look like July will end on a positive note for the equity markets. While the market was able to get through most of the mega-cap earnings reports relatively unscathed, Amazon.com’s (AMZN) revenue miss after the close Thursday has that stock trading down over 6% in the pre-market, sending Nasdaq futures down more than a full percent. Futures on the S&P 500 and Dow aren’t down by nearly as much, but they’re still firmly lower. AMZN’s weak report and the impact on futures immediately made its impact felt on global markets as well as they all closed out or are closing out the month of July on a down note. Even with today’s weakness, though, it would take a truly disastrous day for the S&P 500 to not finish the month higher which would mark the sixth straight month of gains.
In economic news today, we just got the releases of the Employment Cost Index (lower than expected) and Personal Income and Spending which both topped forecasts. At 9:45, the Chicago PMI will give investors a read on economic activity for the month of July, and then we’ll close out the week’s economic slate with Michigan Confidence at 10 AM.
Read today’s Morning Lineup for a recap of all the major market news and events from around the world, the latest US and international COVID trends including our vaccination trackers, and much more.

If there was ever a company that epitomizes playing the long game over the quarterly earnings dance, it’s Amazon.com (AMZN). And while we’re not quite sure that Jeff Bezos could have imagined what’s going on now with the economy and the world today three years ago, it was one of a handful of companies that was ready for it. Today, AMZN is on pace to open down over 6% in what would be the fourth straight quarter that the stock has traded lower in reaction to earnings. Similar to what we highlighted with Apple (AAPL) on Wednesday, just because investors haven’t reacted to the company’s recent reports with excitement doesn’t mean AMZN has been a poor performer. In fact, since the start of last July AMZN is still up 17%. Surely, that doesn’t make it one of the top-performing stocks during that span, but it’s still a respectable performance nonetheless.

Neutral Sentiment Surge Continues
The AAII’s weekly sentiment survey saw an equal percentage (30.6%) of respondents report as bullish and bearish last week. This week saw a much more optimistic pivot as 36.2% of respondents reported bullish sentiment. While higher, bullish sentiment is still at one of the lowest levels since last fall. At 36.2%, bullish sentiment is also now just below the historical average of 38%. While the AAII reading on bullish sentiment was higher but still muted, the Investors Intelligence survey of newsletter writers showed bullish sentiment fall 8.1 percentage points to 53.1%. While that is not a particularly low reading (the lowest since only the end of May), it was the largest one week decline since October 2019. In other words, bullish sentiment is not necessarily collapsing, but it has lost some footing.

With more bulls in the AAII survey, fewer respondents reported bearish sentiment. In fact, less than a quarter of investors reported bearish sentiment this week. That is down 6.5 percentage points from the prior week; the largest one-week decline since a 6.6 percentage point decline in the first week of June.

The inverse moves in bullish and bearish sentiment resulted in the bull-bear spread to rise 12.1 points. While off the lows, it is still not as strong of a reading as has been seen for most of this year. In fact, the current reading is 5.5 points below the average since the start of the year.

The most impressive sentiment reading this week was neutral sentiment. Over the past four weeks, neutral sentiment has risen 10.5 percentage points without a single decline in that time. That is the biggest four-week rise since mid-May when it had risen 14.9 percentage points. Now as the predominant sentiment with just below 40% of respondents reporting as such, neutral sentiment is at the highest level since the first week of 2020 when this reading was 1.2 percentage points higher. Click here to view Bespoke’s premium membership options.

State Oddities and Claims
While last week’s jobless claims number was already disappointing on account of increases in layoffs in the manufacturing and automobile industries in Michigan, Texas, Missouri, Illinois, and Ohio, and this week that reading was revised higher by 5K to 424K. Fortunately, the most recent print saw an improvement with claims falling to 400K. That compares to expectations of a drop back below 400K to 385K.

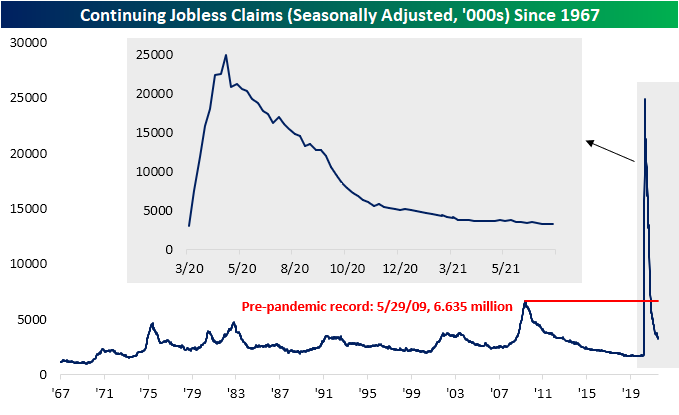
While the seasonally adjusted number did not improve by as much as expected, the non-seasonally adjusted number was much stronger at 344.7K. That leaves initial claims within 100K of the last sub-one million claims print from March 13th of last year. Given that disconnect between the seasonally adjusted and unadjusted numbers, it goes without saying that drops in the NSA number are due to seasonality and typical for this time of year. In fact, as shown in the second chart below, since 1967 when the data begins, claims have risen only 11% of the time during the current week (30th) of the year. That ranks sixth as the week of the year in which claims have most often fallen week over week.
Since mid-June, PUA claims have been fluctuating around 100K. Last week saw a rise up to 109.9K thanks to a big jump in Indiana following a judge’s order for the program to be restarted. Indiana claims started to normalize this week and saw the largest drop of any state, national PUA claims came in back below 100K at 95.17K. That is the lowest level since the first week of June when PUA claims put in a low of 71.23K.
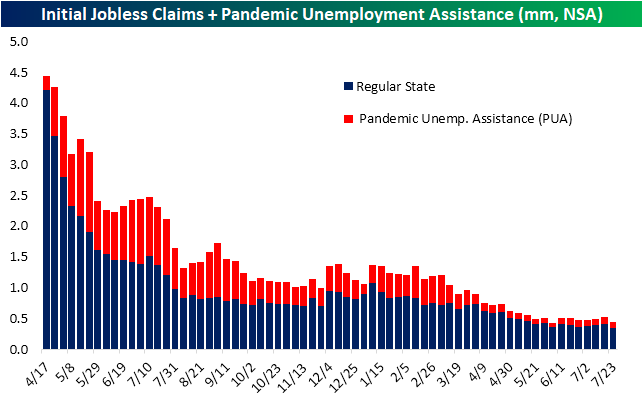

Lagged an additional week to initial claims, continuing claims snapped a streak of three weeks of improvement. Continuing claims rose to 3.269 million from 3.262 million in the prior week. That is only the highest level since the end of June.
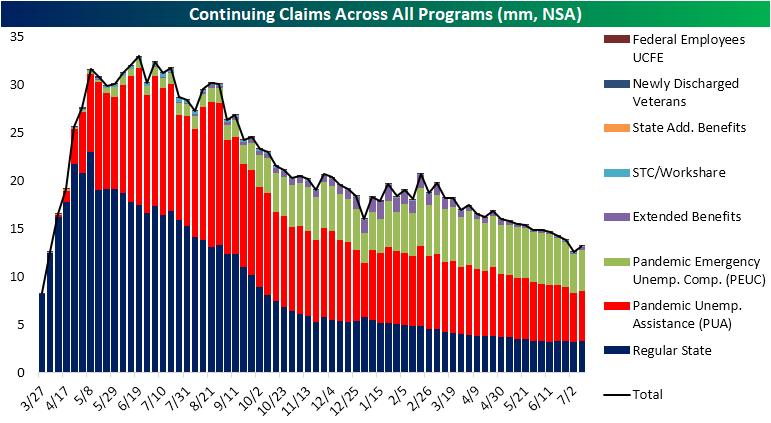
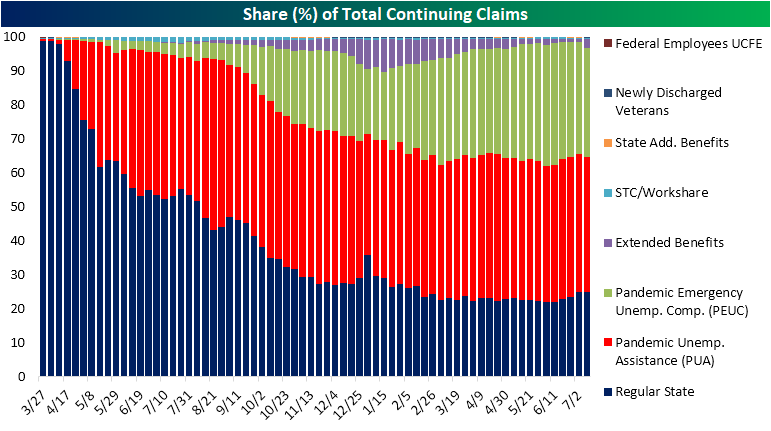
Factoring in all other programs creates an additional week of lag making the most recent reading through July 9th. Continuing claims broadly saw a move higher across programs that week bringing total claims to 13.17 million from 12.59 million. That brought to an end a streak of ten consecutive weeks of declines. As for which programs, in particular, accounted for that uptick in claims, the biggest contributor was the Extended Benefits program. This program saw claims go from under 100K all the way up to 343.5K. While we cannot point to any particular reason for each state’s increase, that large move higher was particularly thanks to two of the most populous states: Texas and California which saw weekly claims rise 180K and 67.1K, respectively. Throughout recent claims reports, there have been a handful of state-level idiosyncracies which impact aggregate claims counts, but overall the trend of improving claims on a national level remains in place. Click here to view Bespoke’s premium membership options.
Bespoke’s Morning Lineup – 7/29/21 – GDP on Deck
See what’s driving market performance around the world in today’s Morning Lineup. Bespoke’s Morning Lineup is the best way to start your trading day. Read it now by starting a two-week trial to Bespoke Premium. CLICK HERE to learn more and start your trial.
“It’s all about the journey, not the outcome.” – Carl Lewis
Twenty-five years ago today, Olympian Carl Lewis completed one of the most impressive streaks in US track and field history when, at the age of 35, he won the gold medal in the long jump. That victory marked the fourth straight Olympics in which Lewis stood at the top of the podium for the long jump and the ninth time overall. In winning the long jump for the fourth time, Lewis became the first American since Al Oerter to win back to back to back to back golds in the same event.
With two days left in the month, the S&P 500 is also in the middle of its own streak with six straight monthly gains. That’s far from a record but still pretty impressive nonetheless. Futures are higher this morning as equities look to add to their gains for July, as optimism over a bipartisan infrastructure deal boosts sentiment along with positive words from China regarding its crackdown on tech companies in the country.
There is also a good deal of economic data today with the first read on GDP kicking things off with a big miss (+6.5% vs +8.4%) and both initial and continuing jobless claims coming in higher than expected. At 10 AM, we’ll get Pending Home Sales. During the day, we’ll also have the Robinhood (HOOD) IPO which priced at the low end of the expected range, and then after the close, the headline earnings report will be from Amazon.com (AMZN), which will round out the reports of the ‘big five’ mega-caps. So far, the markets have gotten through these reports relatively well, so just one more day to go.
Read today’s Morning Lineup for a recap of all the major market news and events from around the world, the latest US and international COVID trends including our vaccination trackers, and much more.
So far this earnings season, it hasn’t been just the mega-caps that have reported strong results. As shown in the snapshot below, of the 339 companies that have reported since the start of July (through Tuesday), 84% have topped EPS forecasts, 80% have exceeded sales estimates, and a net of 17% have raised guidance. Despite those strong results, companies reporting earnings have gapping down an average of 0.10% at the open on their earnings reaction day. During the trading day, though, buyers have stepped in pushing shares higher by 0.15% for a full day gain of 0.05%. That’s hardly a strong reaction, but at least it’s positive-something we haven’t been able to say consistently over the last couple of earnings seasons.

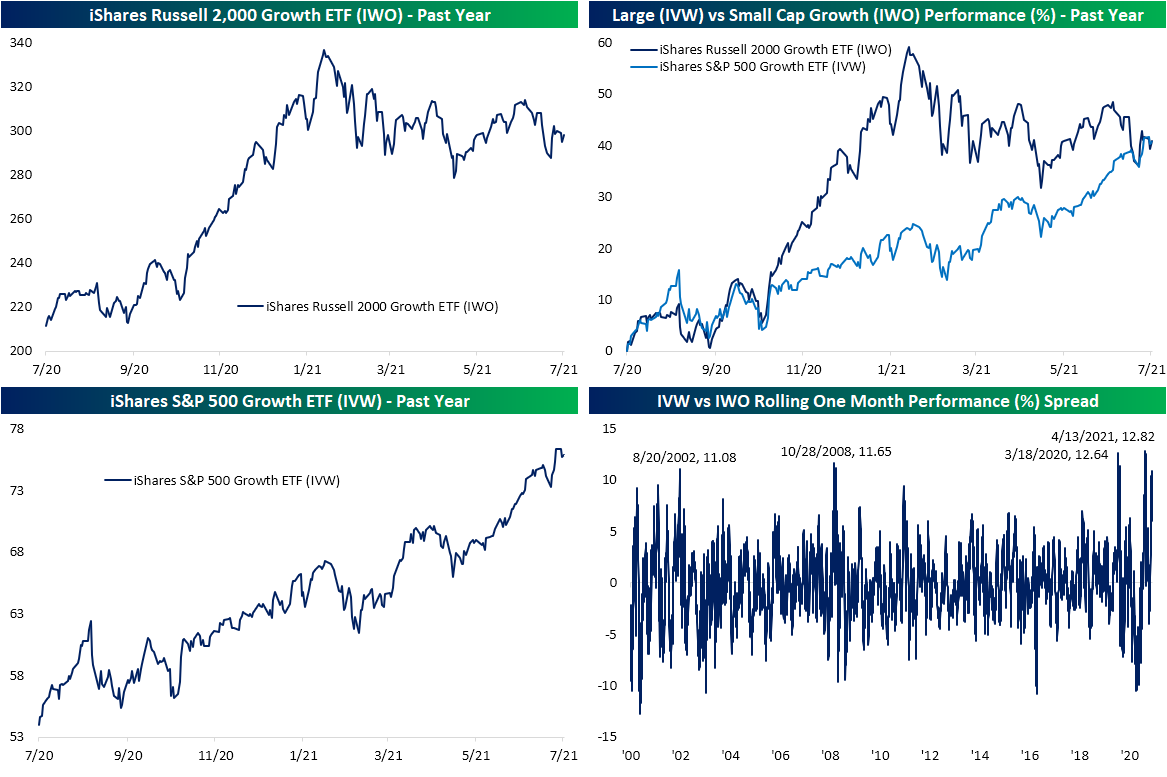
Large Cap Growth Leaves Small Cap Growth in the Dust
Looking at the styles screen of our Trend Analyzer, growth stocks have been clear winners of late, but that does not necessarily include all growth stocks. Whereas the Growth ETF (VUG) or S&P 500 Growth ETF (IVW) are up over 2% over the past five days through yesterday’s close and are sitting on year to date percentage gains in the high teens, the small-cap focused Russell 2000 Growth ETF (IWO) is actually down over the past week and is barely up on the year.

Taking a closer look at the dynamic between small and large-cap growth, as shown below IWO has been trending lower for basically all of 2021 after a strong run higher at the end of last year. Meanwhile, IVW has been trending in a steady, largely uninterrupted, uptrend. Given that strong run at the end of last year, IWO had been outperforming IVW by a large degree for most of the past year. But small-cap weakness and large-cap strength has meant the two are now up by roughly the same amount (~40%) versus one year ago.
A massive degree of that outperformance has come in the past month alone. In the bottom right-hand chart below, we show the rolling one-month performance spread of the two ETFs. While it has come back down slightly today, at yesterday’s close, there was a 10.9 percentage point spread between the one-month performance of IVW and IWO. That is the widest dispersion between the one-month performance of the two ETFs since April’s record level when the spread reached 12.82 percentage points. Since the Russell 2000 Growth ETF began trading exactly 21 years ago, there have only been a handful of other periods in which small-cap growth underperformed by such a wide degree. The other most recent period was March of last year, October 2008, and then late summer of 2002. Click here to view Bespoke’s premium membership options.