Moving Averages By Sector and Market Cap
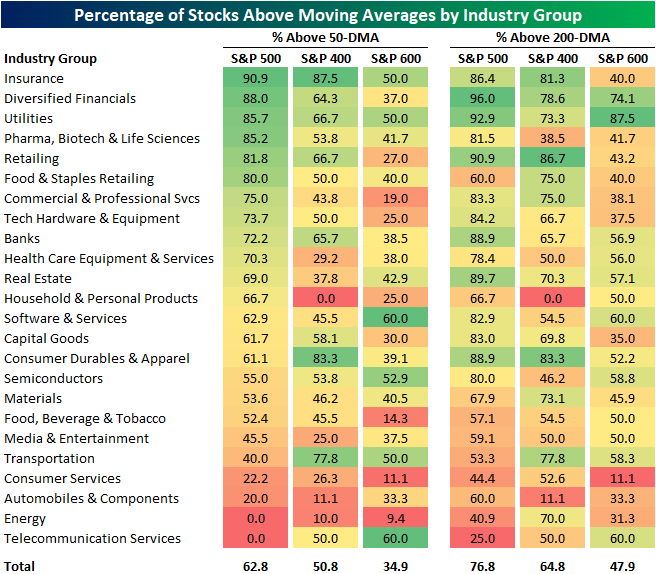
On Friday, we highlighted how a growing number of stocks were falling below their 200 and 50-DMAs recently, but there was a noticeable difference between those readings within large, mid, and small caps. Taking a more granular look, in the table below we show the percentage of stocks currently above their moving averages for each market cap bracket—large- (S&P 500), mid- (S&P 400), and small-caps (S&P 600)—by industry group.
For the most part, each industry group shows the same dynamic in which large caps generally have a stronger reading in the share of stocks trading above their moving averages, but there are a few industries where that is not necessarily the case. For example, mid-caps actually have the strongest readings for industries like Consumer Services and Energy, and Telecommunication Services has the strongest readings for small caps.
As for which industry groups currently have the healthiest readings in the number of stocks above their moving averages, Insurance tops the chart with around 90% of S&P 500 and 400 stocks in the industry above their 50-days. Of course, for small caps, there is a steep drop off though. On the other hand, Diversified Financials and Utilities also have some of the strongest readings in the number of stocks above their moving averages, and that is especially the case with regards to their longer-term 200-DMAs. Click here to view Bespoke’s premium membership options.
Ditching the Friendly Skies
From the start of the year through August 1st, air passenger traffic in the US experienced a massive rebound with the seven-day average passenger throughput in the US more than doubling from just over a million to 2.082 million. What was notable about that August 1st level was that it was pretty close to average throughput levels seen in late Summer/early Fall of 2019 before the pandemic ground things to a halt in early 2020.
August has been unfriendly to the skies, though, and ever since that peak reading on 8/1, passenger traffic has been drifting lower. The Delta variant and the accompanying surge in cases has no doubt had an impact on air passenger traffic, but seasonality has likely been a contributing factor as well. While we don’t have passenger traffic levels prior to August 2019, it only makes sense that as schools start to go back into session and the Summer vacation season comes to a close, Americans are going to be travelling less for vacation.

What’s been interesting about the recent fall-off in air passenger traffic levels has been how steady but modest the declines have been. Starting with the steady aspect, the chart below shows the number of consecutive days that air passenger traffic has declined on a week/week basis. Sunday marked the 21st straight day that passenger traffic declined on a w/w basis, making it the longest streak of the pandemic behind the 18 trading day streak ending right around the election last year.

While the declines in passenger traffic have been steady, the magnitude has been modest. The chart below shows the w/w change in passenger traffic over the last two years, and the declines of the last three weeks have been notably modest. During the current three-week decline, the maximum w/w decline has never reached double-digit percentages. In fact, the last time air passenger traffic was down over 10% on a w/w basis was seven weeks ago on July 4th. One has to think that if Delta variant concerns were really having a major impact on air travel, the drop-off in air traffic would have been more abrupt, similar to what occurred in the early stages of the pandemic. Click here to view Bespoke’s premium membership options.

Bespoke’s Brunch Reads: 8/22/21
US Dollar Breaks Out
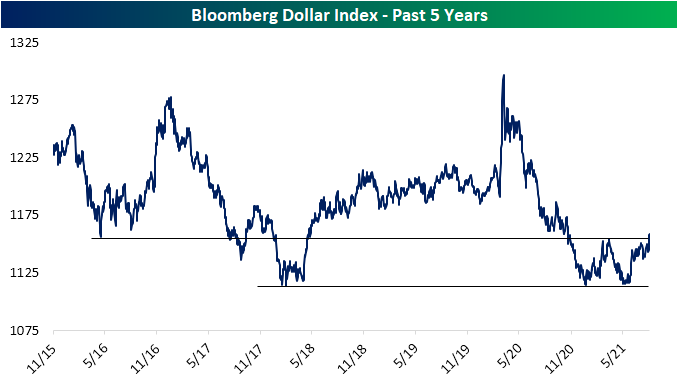
After roughly two months of declines, at the end of May the US dollar (proxied by Bloomberg’s dollar index) found support around the lows from the first week of the year. Since then, the dollar has rallied 4.13%, moving back above its moving averages in the process which have also acted as support ever since. This week alone the dollar has gained 1.4%, and that upward move brings the dollar to the highest levels since early November and the early spring highs when the index stopped short of its 200-DMA.

Taking a step back to look at the past five years, those lows that were reached earlier this spring and at the start of the year can actually be traced all the way back to early 2018 lows. Similarly, the recent highs that were taken out this week are around the same levels as the early 2016 lows. With the dollar now having broken out, it is no longer at the low end of that five-year range. Click here to view Bespoke’s premium membership options.
Fewer Stocks Above Moving Averages
At the moment, of the S&P indices based on market cap, only the S&P 500 is currently above its 50-DMA. Meanwhile, the S&P Mid-Cap 400 is trying to move back above and the small-cap S&P 600 is around 3.5% below its 50-day and moving lower. As for the individual stocks of these indices, it is more or less the same story. The S&P 500 has the strongest percentage of stocks above their 50-DMAs at 56.44%. That is down though from a high of 68.91% at the end of last week. Mid and small caps are even weaker with only 36.5% of the S&P 400 above and less than 30% of the S&P 600 above. While this week saw legs lower in the percentage of stocks above their 50-DMAs for each of these indices, we would also note that recent readings are also well below very strong levels that had been observed from late last year through this past spring.
The same goes for the percentage of stocks above their 200-DMAs. For each of these market cap indices, readings around 90% were commonplace for most of the past year, that is, until the past few months and more specifically the past week. Roughly three-quarters of S&P 500 stocks closed above their 200-DMAs yesterday which is the lowest level since early November. Again, that also applies to mid and small caps which have even smaller shares of stocks above their 200-day moving averages at 65.99% and 60.17%, respectively. Click here to view Bespoke’s premium membership options.

One of the Best Weeks of the Year for Claims
Initial jobless claims hit another pandemic low this week dropping to 348K from last week’s 2K upwardly revised reading of 377K. That was also 16K below expectations and the first better than expected print in six weeks. While recent releases have disappointed relative to forecasts, this week did mark the fourth week in a row that claims have dropped. That is the longest stretch of consecutive declines since a six-week streak ending on June 4th.

On a non-seasonally adjusted basis, initial claims fell to 308.57K which is again the lowest level since the start of the pandemic. Meanwhile, pandemic unemployment assistance claims ticked up to 109.38K from 103.85K the previous week. The main state driving that increase was Ohio which saw claims more than double. Maryland, Oregon, and California were the other states to have seen the biggest increase in PUA claims. Those increases also come even as the program is slated to end in just two weeks on September 4th.

As for the decline in claims for unadjusted regular state programs, we would caution against reading too deep into the number on account of strong seasonal tailwinds. As shown below, the current week of the year (33rd) is tied at second for the week of the year that most often sees claims decline. As shown in the second chart below, there has only been one year, last year, in which claims were higher week over week in the 33rd week of the year.

Seasonally adjusted continuing claims missed expectations by 20K this week, but at 2.82 million, this week’s reading still marked a third consecutive decline. As such, claims are still at the lowest level of the pandemic and are closing in on coming within one million from the March 2020 levels.
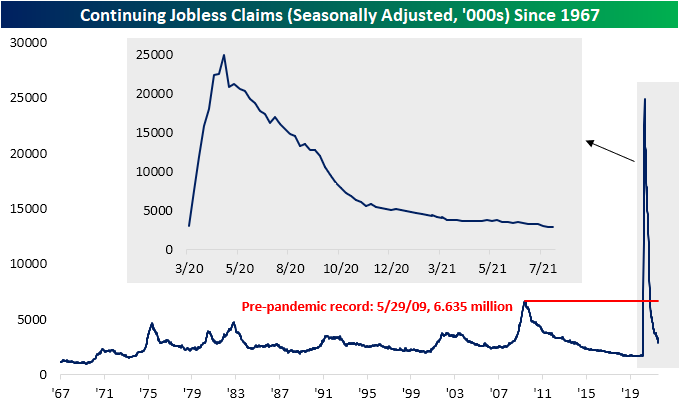
While the most recent reading on continuing claims was lower, purely looking at regular state claims does not show the full picture. Including all other programs creates some additional lag meaning the most recent data is through the last week of July. Through that week, total claims fell below 12 million for the first time of the pandemic, totaling 11.76 million. Driving that decline were 79.9K and 66.08K declines in regular state and PEUC programs. The biggest decline came from the extended benefits program, though. That program saw claims get more than cut in half after a significant uptick the previous week. Throughout the month of July, claim counts for the extended benefits program were particularly volatile. They started off the month with a sub-100K reading of 98.4K, then rose all the way up to 343.5K, dropped to 239.6K, then rose again to 398.8K before falling back down to 177.9K in the week of July 30th. Click here to view Bespoke’s premium membership options.


Homebuilder Sentiment: The Next Big Miss
Prior to the pandemic, the NAHB’s record monthly reading on homebuilder sentiment was back in December 1998 when the index hit 78. Last November, the sentiment bar was set even higher when the index reached 90. Since then, though, two-thirds of the releases have declined month over month. The most recent release saw the index drop five more points to 75, marking the first time in a year that homebuilder sentiment came in below the pre-pandemic record high. Additionally, August’s 5-point drop is the largest one-month decline since last April when the index collapsed by a record 42 points at the onset of the pandemic. It is also tied with a dozen other months for the seventh-largest month-over-month decline in the history of the index going back to 1985.
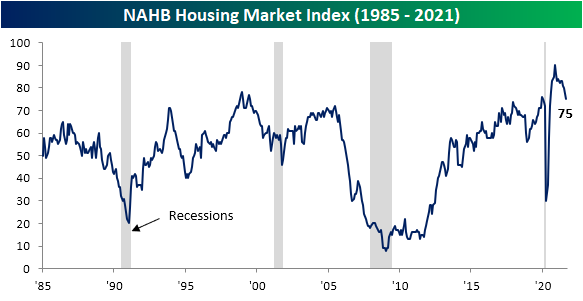
While the release indicates worsening, but still historically strong, sentiment among homebuilders, it can be added to the growing list of economic indicators that have been coming in well below expectations. As we noted in last week’s Bespoke Report, Citi Surprise indices measuring how economic data comes in relative to estimates tipped into negative territory last week. That was as the University of Michigan’s Consumer Sentiment survey saw the biggest miss relative to expectations on record. Today’s reading on homebuilders was not far off those results. The five-point miss relative to expectations was the largest since last April and is tied with 4 other months (April and May 2006, November 2008, and October 2014) for the six largest miss going back to at least 2003.

Driving the decline in the headline reading were five-point drops in present sales and traffic. Even though there has been deterioration in those readings on current conditions, future sales have held up better going unchanged at 81.

Looking across regions, the ones that have seen COVID cases rising the most of late, namely in the South and Midwest, generally saw sharp drops in homebuilder sentiment in August although those are in the context of longer-term declines. The Northeast and the West, on the other hand, are off of their peaks but each region did show an uptick in sentiment for August. Click here to view Bespoke’s premium membership options.

Bespoke Brunch Reads: 8/15/21
Welcome to Bespoke Brunch Reads — a linkfest of the favorite things we read over the past week. The links are mostly market related, but there are some other interesting subjects covered as well. We hope you enjoy the food for thought as a supplement to the research we provide you during the week.
While you’re here, join Bespoke Premium with a 30-day free trial!
Vaccines
Job Postings Requiring Vaccination Climb (Indeed)
Indeed’s Hiring Lab is tracking a sharp increase in the number of job postings on the site that require vaccination. Almost 1250 posts per million require vaccination, versus virtually none earlier this year. [Link; registration required]
Suspected saline switch sparks vaccine stir in Germany (Reuters)
A German nurse is suspected of injecting some patients with saline solution instead of actual vaccine has sparked a call for thousands to get re-vaccinated out of an abundance of caution. [Link]
Risk Appetite
How Millennial Investors Lost Millions on Bill Ackman’s SPAC by Michelle Celarier (Institutional Investor)
Desperate to get in on the next big thing, numerous small investors loaded up on calls tied to pre-deal SPACs, only to be gravely disappointed when no post-deal pop emerged. [Link]
Messi joins crypto craze as gets part of PSG fee in fan tokens by Simon Evans (Reuters)
Former FC Barcelona star Lionel Messi agreed to take part of his fee for signing with Paris St Germain in the form of crypto tokens. The fan tokens allow fans to vote on minor decisions related to clubs that issue them. [Link]
Mother Necessity
In Nebraska, a weekly paper is filling its community’s need for news — and booze by Hanaa’ Tameez (Nieman Lab)
When faced with a lack of revenue and a 30 mile drive to the nearest liquor store, a Nebraska paper decided to start selling hooch. The results keep their neighbors both properly lubricated and informed. [Link]
McDonald’s Pushes Diners to Use Trays as Food Bags Run Tight by Heather Haddon (WSJ)
With most customers getting food to go and supplies of paper bags jammed up, workers are having to explain how trays work for dine-in orders as the company’s locations deal with high demand for burgers and not enough bags to put them in. [Link; paywall]
Disaster
Higher but still slim odds of asteroid Bennu slamming Earth by Marcia Dunn (AP)
An asteroid with an orbit that brings it close to Earth will come closer than previously estimated on its nearest pass over the next century, but odds are still very low that it will end up hitting our planet. [Link]
There’s An Earthquake Coming! by Zoey Poll (The NYer)
Early warning systems don’t offer much lead time, but the difference between no warning and even a few seconds is enough to save lives and protect critical infrastructure in earthquake-prone regions around the world. [Link]
Green Commerce
How Much Carbon Comes From a Liter of Coke? Companies Grapple With Climate Change Math by Jean Eaglesham and Shane Shifflett (WSJ)
Figuring out just how much carbon is emitted by companies is not as straightforward as it might seem, and the specific kinds of disclosures investors and regulators are looking for aren’t consistent either. [Link; paywall]
Archaeology
Did archaeologists find the Trojan Horse? (The Jerusalem Post)
A scintillating discovery from Turkey: what could be the actual physical remains of one of the most legendary objects of the ancient world. [Link]
Read Bespoke’s most actionable market research by joining Bespoke Premium today! Get started here.
Have a great weekend!
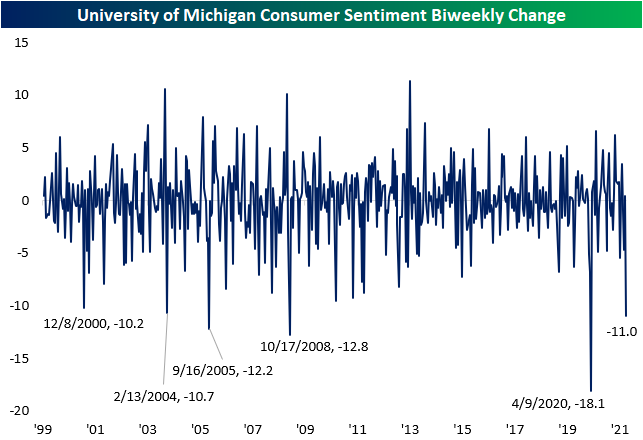
University of Michigan Whiffs
The preliminary reading on August consumer sentiment from the University of Michigan was released this morning, and it was a major disappointment. The headline reading peaked back in April but this month’s preliminary reading collapsed down to the lowest level since December 2011. That decline has been attributed to concerns over the Delta variant. As shown in the second chart below, the 11 point drop from 81.2 at the end of July to 70.2 today was the largest decline between two reports (either the preliminary and the prior final report or the final report and the preliminary reading) since the preliminary reading in April of 2020. The April 2020 reading was the largest drop on record at 18.1 points. Before that, October 2008 was the next largest and last double digit decline.

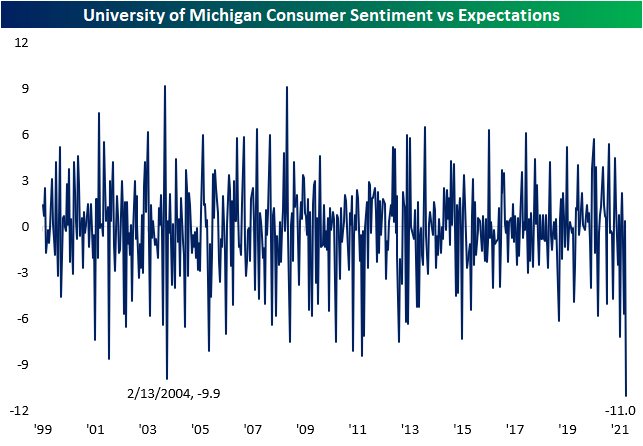
Not only was the release dramatically worse than the last update, but it was a huge miss relative to expectations. Using data from our Economic Indicators Database, today’s release came in 11 points below expectations. The only other month going back to at least 1999 that even comes close was a 9.9 point miss in the preliminary reading in February 2004. Click here to view Bespoke’s premium membership options.
Best Performing S&P 1500 Stocks Year to Date
The average stock in the S&P 1500 (which is a combination of large-caps, mid-caps, and small-caps) is up 25% year-to-date. As shown below, Energy sector stocks are up nearly twice that at 47.1%, while Consumer Discretionary and Materials rank 2nd and 3rd. The two defensive sectors — Consumer Staples and Utilities — are up the least, but they’re still up more than 13% on average. While Technology has had a good run over the last three months, its the third worst performing sector year-to-date when looking at average stock performance.

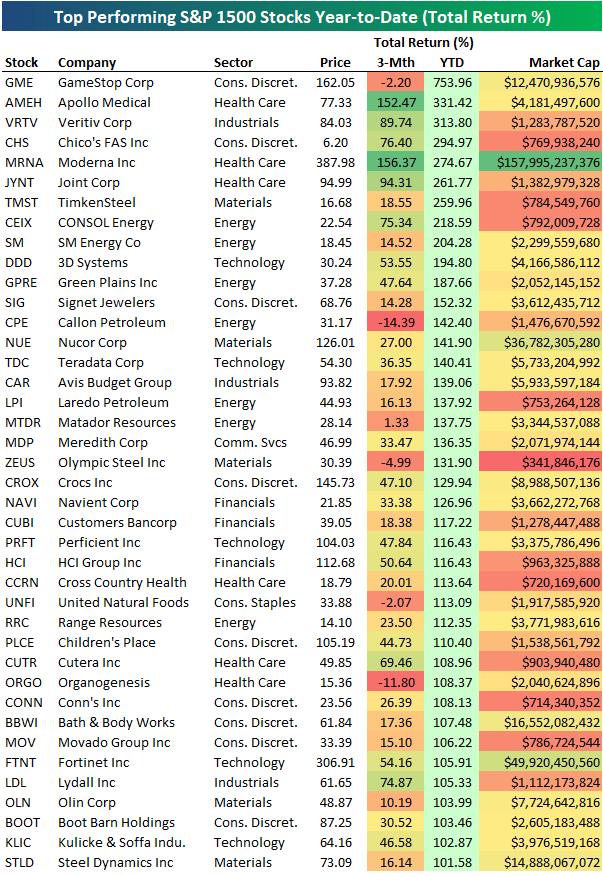
There are currently 40 stocks in the S&P 1500 that are up more than 100% in 2021. Below is a list of these 40 stocks. As shown, GameStop (GME) remains on top by more than double any other name with a YTD gain of 753%. The stock is down 2.2% over the last three months, however. There are two more stocks up more than 300% YTD — Apollo Medical (AMEH) and Veritiv (VRTV). Another six are up more than 200% — Chico’s (CHS), Moderna (MRNA), Joint Corp (JYNT), TimkenSteel (TMST), CONSOL Energy (CEIX), and SM Energy (SM).
Other notables on the list of this year’s biggest winners so far include 3D Systems (DDD), Nucor (NUE), Avis Budget (CAR), Crocs (CROX), and Fortinet (FTNT). Moderna (MRNA) is easily the stock with the biggest market cap at nearly $158 billion.
Over the last three months, there are 41 stocks in the S&P 1500 that have gained more than 40%. Moderna (MRNA) ranks first with a 3-month gain of 156%, while Apollo Medical (AMEH) is hot on its heels at +152.5%. Stamps.com (STMP) ranks third, followed by Joint Corp (JYNT) and Veritiv (VRTV). Other notables on the list of 3-month winners include Livent (LTHM), Fortinet (FTNT), Enphase Energy (ENPH), Dexcom (DXCM), AMD, Albemarle (ALB), NVIDIA (NVDA), Generac (GNRC), and ResMed (RMD). Click here to view Bespoke’s premium membership options.
