Gold (GLD) Extending Winning Streak to 10
Just over a week ago, gold, the SPDR Gold Trust ETF (GLD) closed above its 200-DMA for the first time since February 1st. The rally that took GLD above its 200-DMA has also broken the downtrend that had been approaching a year in age. Today, GLD is up another 0.22% to the highest level since January 7th.

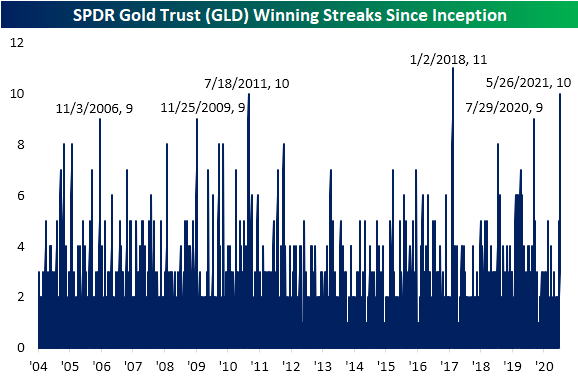
Given another move higher today, GLD is also on pace to close in the green for the tenth day in a row. That is not necessarily the case for other measures of the yellow metal like front-month futures which experienced a 2 bps decline on Monday, but with regards to GLD that is tied for the second-longest winning streak on record. At ten days long, the current streak of consecutive gains is the longest run since the 11-day streak ending 1/2/18. Prior to that, July 2011 was the only other double-digit streak with a few other nine-day-long steaks; the most recent of which ended in July of last year.
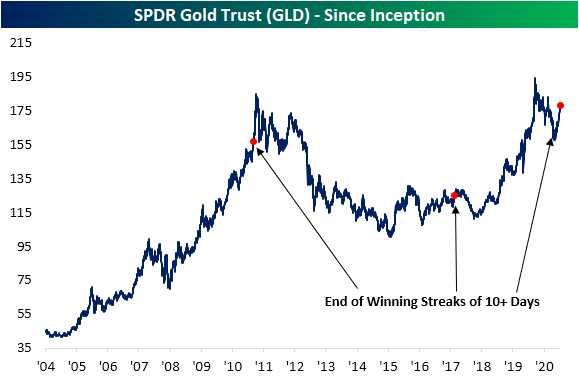
The recent rally in GLD continues to set up the over-decade-long cup and handle pattern that we have made note of in the past, though, GLD still needs to rally another 8.15% to take out last summer’s highs to complete the pattern. Given the nearly 8% rally over the course of the current winning streak, GLD has reached extremely overbought levels at more than 2 standard deviations above its 50-DMA and begs the question of how much steam is left.
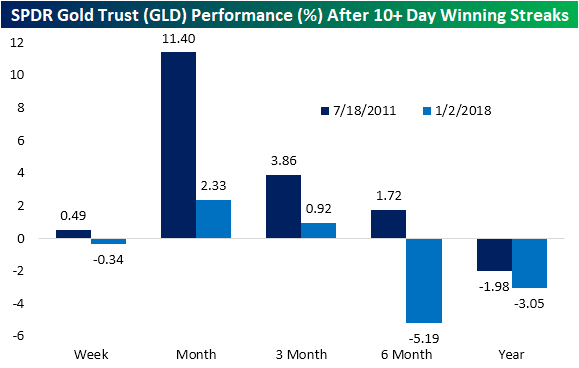
While it is certainly too small of a sample size to put too much weight on, looking at the streaks in 2011 and 2018 that also went on for 10 or more days there has been somewhat mixed performance. The instance in 2011 saw further gains one week later and particularly strong performance over the next month with an 11.4% move higher. Granted, those gains were erased over the course of the rest of the year after the streak came to a close. One year out, GLD was lower than where it stood at the end of the streak. The more recent streak on the other hand was lower one week after coming to an end. While there was a bit more upside in the next quarter, six and twelve months later it was again lower. In order for GLD to take out last year’s high, it’s going to have to buck its recent trend that followed prior extended streaks. Click here to view Bespoke’s premium membership options for our best research available.
Largest YTD Change in Prices at the Pump Since 2009
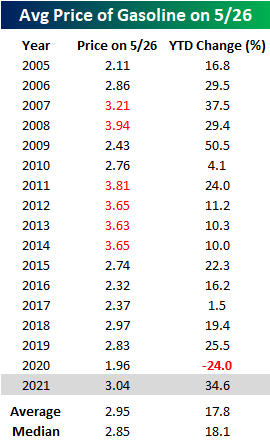
It’s that time of year again. Summer driving season kicks off this weekend with the Memorial Day holiday, and if you’re planning on doing a road trip, you may want to consider a trailer for the back of the car to hold all the gas money. The table below shows the AAA national average price of a gallon of gasoline on this day for every year since 2005. At the current level of $3.04, the national average is the highest it has been at this time of year since 2014, and since 2005 there have been just six other years where prices were higher. In terms of the YTD change, prices are already up 34.6% this year, which is the third-largest YTD increase since 2005 and the largest since 2009. That’s not only nearly twice the historical average but also a big swing from last year when prices were actually down 24% YTD as of 5/26.
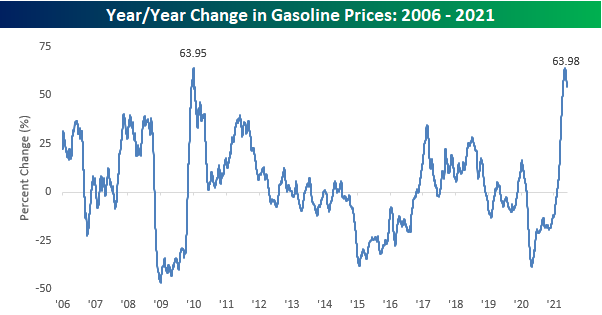
Given the big reversal from a 24% YTD decline last year to one of the largest YTD increases this year, you can imagine that gas prices are up a lot over the last year. Not only is the national average price up a lot, but it also just saw its largest y/y increase on record. Back on May 4th, the y/y increase in the national average topped out at 63.98%, which just barely eclipsed the prior record high of 63.95% from back in January 2010 coming out of the Financial Crisis. It should come as no surprise that the two largest y/y increases in gasoline prices since 2006 have both occurred coming out of major economic contractions. Crude oil and gasoline are notoriously volatile, and their direction is highly correlated to the business cycle.
There’s no arguing the downside of higher gasoline prices for the consumer, but what’s done is done. Looking ahead, seasonal trends suggest that barring a major disruption in supply, the upside potential for gasoline prices may be limited. The chart below compares the YTD change in crude oil prices so far in 2021 to a composite of the average YTD change for all years since 2005. While this year’s increase has been much steeper than the typical year, we have reached the time of year where gas prices typically start to peak out and trade sideways through the Summer before a steady decline to close out the year. Click here to view Bespoke’s premium membership options for our best research available.

Bespoke’s Morning Lineup – 5/26/21 – Dollar on the Floor
See what’s driving market performance around the world in today’s Morning Lineup. Bespoke’s Morning Lineup is the best way to start your trading day. Read it now by starting a two-week free trial to Bespoke Premium. CLICK HERE to learn more and start your free trial.
“The history of mankind is the history of money losing value.” – Milton Friedman
It’s been a quiet news morning, but that hasn’t kept futures from rallying. Treasuries are essentially flat, equities are modestly higher, and bitcoin is bouncing in a big way and back above the $40,000 level (for now).
Read today’s Morning Lineup for a recap of all the major market news and events including a recap of some notable earnings reports, major economic data out of Asia and Europe, and the latest US and international COVID trends including our vaccination trackers, and much more.

After an initial surge in the early days of COVID, the dollar has been on the defensive for the last year now. We saw a modest bounce earlier this year, but the rally in the Bloomberg Dollar Index stalled out in March just shy of its 200-DMA and is now back to testing 52-week lows from earlier this year.

Current levels for the Bloomberg Dollar Index represent an important line in the sand as it’s nearing the lowest levels in more than five years. Looking at the Bloomberg Dollar Index on a longer-term basis, we can see just how important the 1,100 level is. From 2005 through late 2014, there were only a handful of days where it ever traded above that level, but after breaking above 1,100 in 2015, it hasn’t looked back since. If that level does not hold going forward, it could mark an important turning point from a strong to weak dollar environment, and that would have implications on many asset classes and investment strategies.

Chinese Equities Elevated
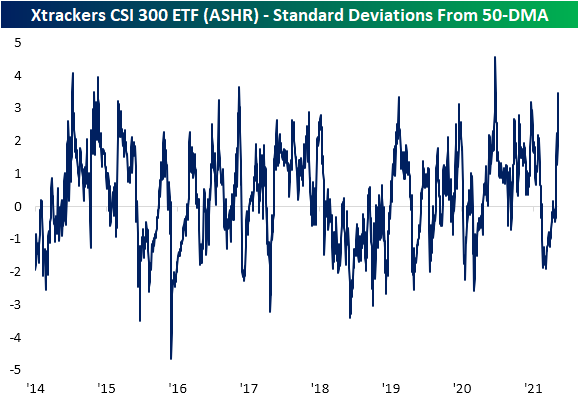
Last week, we highlighted how the Xtrackers CSI 300 ETF (ASHR) tracking Chinese A-Shares finally began to trend higher after being sandwiched between its 50 and 200-DMAs for most of 2021. After that breakout, ASHR did not see much of a further move higher but fast forward to today and the ETF is surging once again. After a strong session overnight, ASHR has risen almost 4% today for its best single-day performance since July 6th of last year when the ETF popped 11.24%. As previously mentioned, ASHR had been stuck between its 50 and 200-DMAs for most of the time since late February, and as such, up until the past week it had not seen an overbought reading since February 19th. With the huge move today, ASHR is trading 3.45 standard deviations above its 50-DMA. As with the size of the move today, the last time that ASHR was as extended above its 50-DMA as it is now was in July of last year following the massive single-day July 6th surge. Prior to that, you would have to go back to November 2016 to find as elevated of a reading. Click here to view Bespoke’s premium membership options for our best research available.

Most of ARKK Bouncing But Still Down Big
After trading deep into oversold territory, the past two weeks have seen the ARK Innovation ETF (ARKK) erase some of the losses of the past few months. Since the closing low on May 13th, ARKK has rallied a hair above 10%, although that still leaves it down over 30% from its 52-week high on February 12th. As for the holdings of the ETF, on a year-to-date basis there are just 10 stocks that are still in the green in 2021. Back in late January, nearly every ARKK holding was in the green.
Performance over the past week is essentially the inverse of year-to-date performance. Whereas there are only a handful of stocks up YTD, there are only a handful that have fallen over the past five days. Although it does not hold a large weight in the ETF (0.98%), by far the worst-performing stock has been Iovance Biotherapeutics (IOVA). The stock was hit with a double whammy of bad news recently when the company announced the CEO, Maria Fardis, would be stepping down in addition to delaying its biologics license application until the first half of next year following feedback from the FDA. That actually comes after a previous delay in the application back in October. As for the rest of the ARKK cohort, Coinbase (COIN), HUYA (HUYA), and Proto Labs (PRLB) are the only other names down at least 5% in the past five days ending yesterday. On the other end of the spectrum, there are ten stocks that have rallied at least 10% in the same span. Only one of these, Shopify (SHOP), has risen to more than one standard deviation above its 50-DMA while Sea (SE) is on the cusp of being able to say the same.
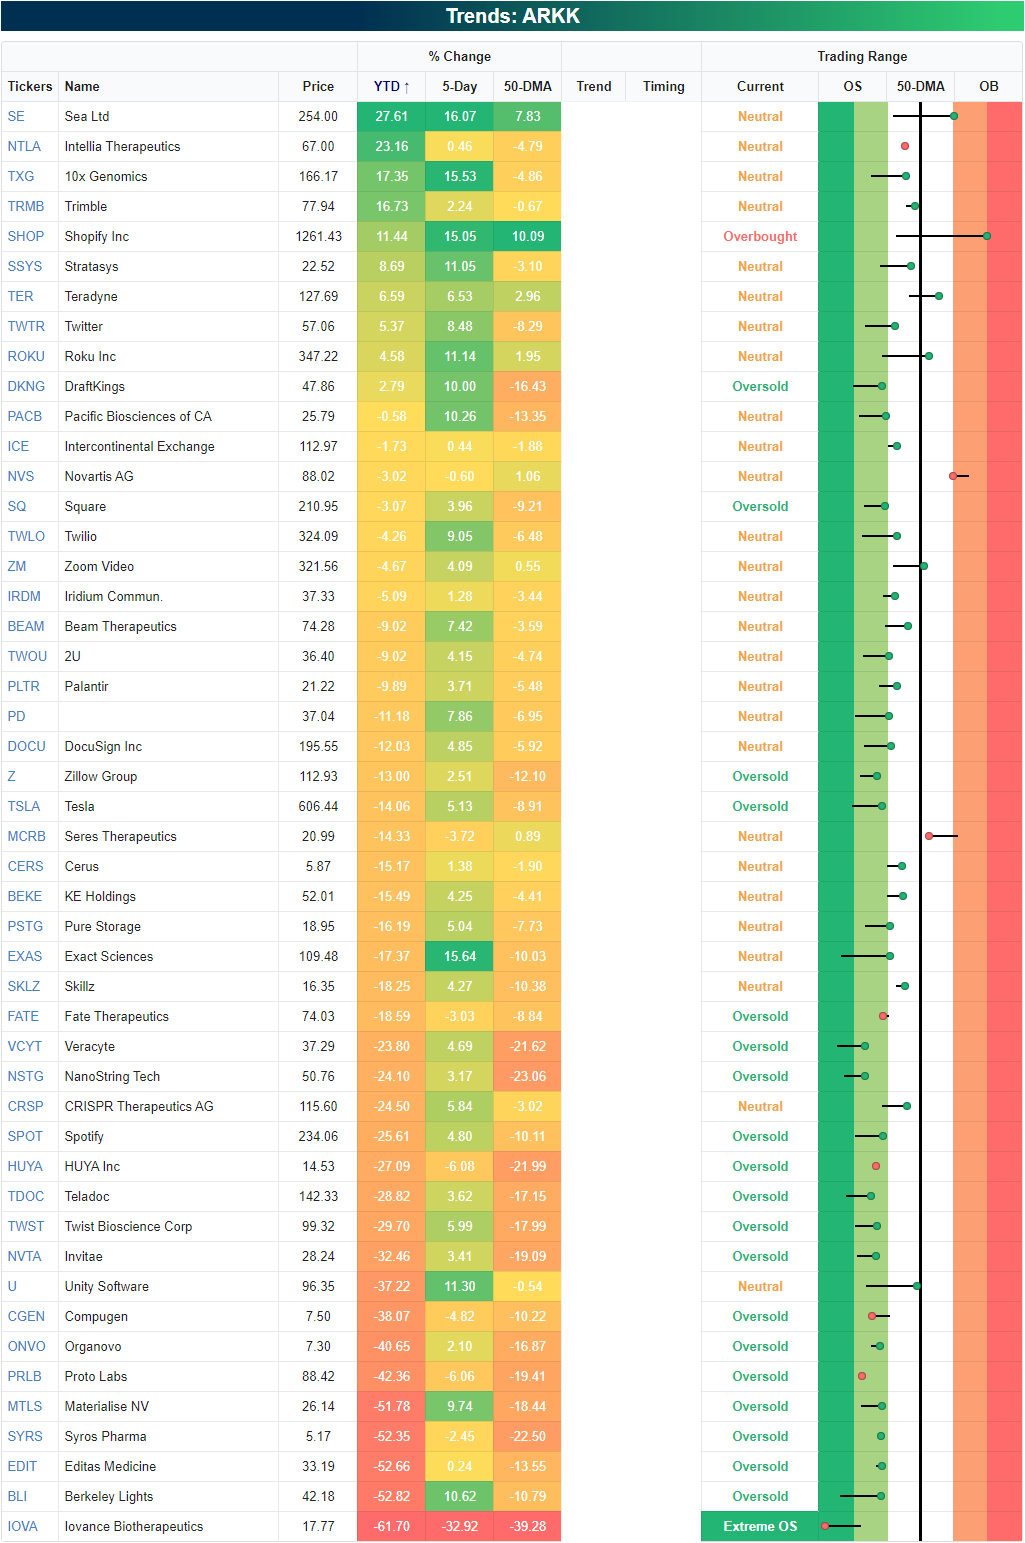
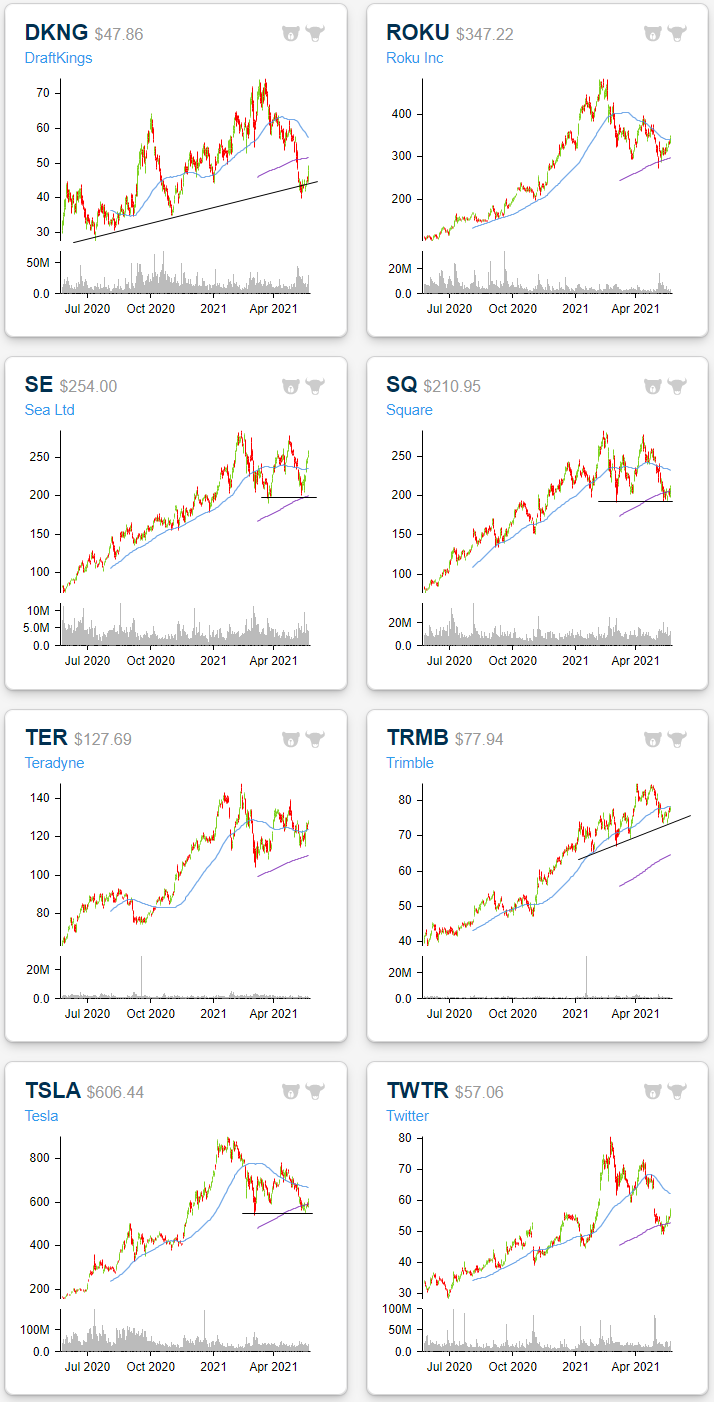
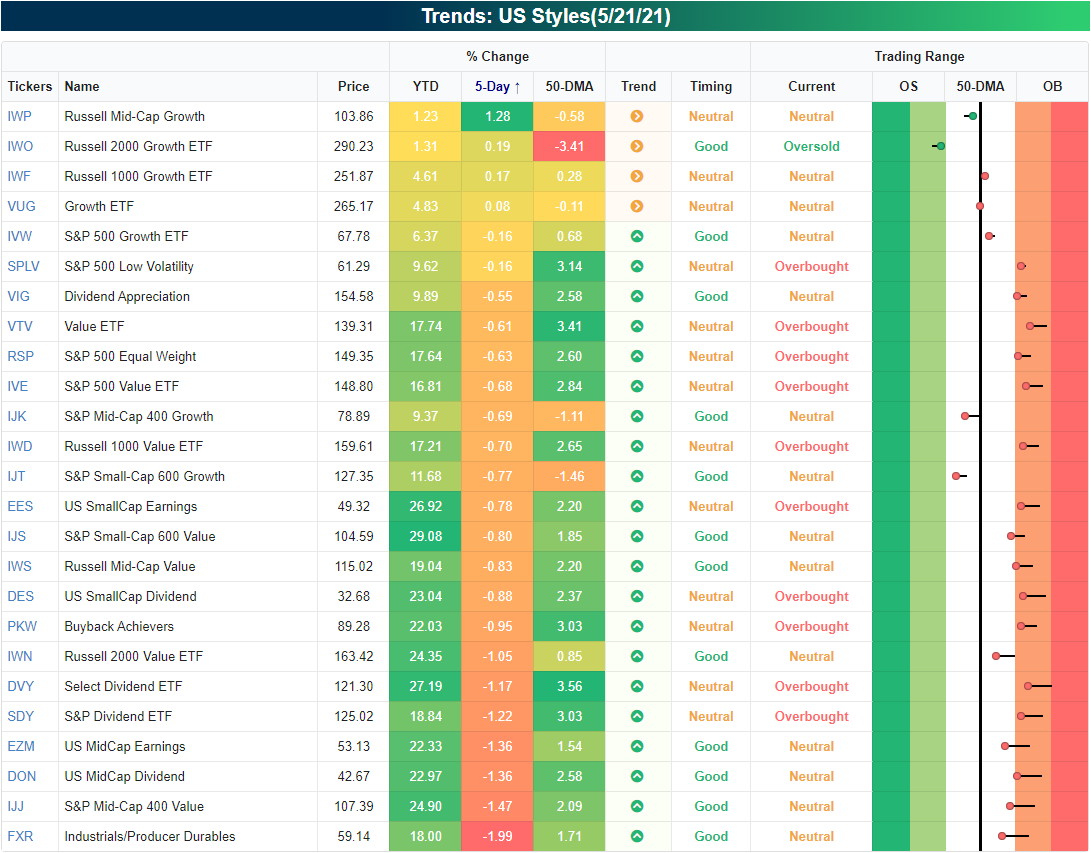
The charts of the ARKK holdings are all over the place ranging from still trending higher, to being in consolidation, to having totally collapsed. For holdings like DraftKings (DKNG), ROKU (ROKU), Teradyne (TER), Trimble (TRMB), or Twitter (TWTR), the past few months of declines have brought price back down to around the past year’s uptrend lines or their 200-DMAs. For others like Square (SQ), Sea (SE), or Tesla (TSLA), those long-term uptrends of the past year are less intact but the recent bounces have similarly come around their 200-DMAs or prior support from the lows earlier this year. The snapshot above is from our Trend Analyzer tool that Bespoke Premium members have access to. We have whited out two of the columns in the snapshot — our Trend and Timing scores. To access these two proprietary indicators, be sure to start a two-week Bespoke Premium trial. You’ll also have access to our Chart Scanner tool which is where the charts below are pulled from.
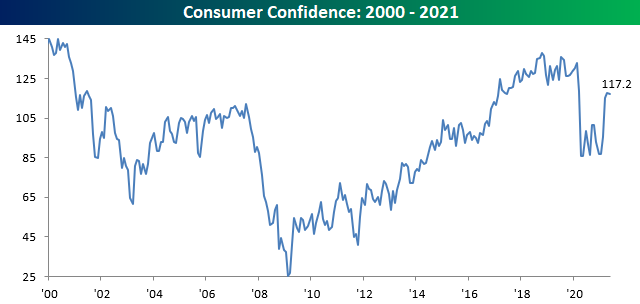
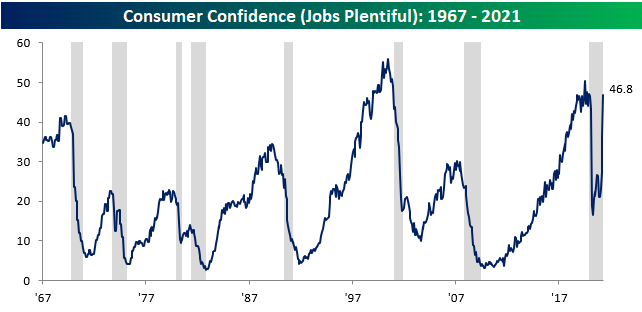
Jobs As Plentiful As They Were Right Before the Pandemic
Consumer Confidence took a rest in May as the headline index dropped slightly falling from 117.5 (revised down from original 121.7) to 117.2 and more than a point and a half below consensus forecasts of 118.8. Despite the weaker than expected report, confidence levels have recovered more than half of the declines from the pre-COVID highs.
One very strong aspect of the report this morning was the Jobs Plentiful index which surged 29% versus April, marking the third straight m/m gain of over 19% during which time the index has doubled. That’s easily the largest ever three-month gain in the index. Jobs are so plentiful now that the index is actually higher than it was back in February 2020 when people were still figuring out what COVID was right before the WHO declared it a pandemic in March 2020. With a record number of job openings per the JOLTS survey and consumers viewing the ability to find a job just as easy now as it was before the pandemic, it once again leads back to the question of why there are 8.2 million fewer Americans working now than there were in February 2020?
On another note, it’s really just a matter of semantics at this point, but since the mid-1960s there has never been another period where the Jobs Plentiful index erased this much of its losses and the economy was still in a recession. The NBER is the organization in charge of dating recession start and end dates, and while it isn’t meant in any way to be a timing indicator, at this point the recession is not only over, but it has been for about a year now. Going back to 1980, the median number of days between the end of a recession and when the NBER makes the official announcement is 476 days. Based on that, we could expect the NBER announcement to come out sometime later this Summer. Click here to view Bespoke’s premium membership options for our best research available.
Bespoke’s Morning Lineup – 5/25/21 – Russell’s Turn
See what’s driving market performance around the world in today’s Morning Lineup. Bespoke’s Morning Lineup is the best way to start your trading day. Read it now by starting a two-week free trial to Bespoke Premium. CLICK HERE to learn more and start your free trial.
“Personally, I’d rather have bitcoin than a bond.” – Ray Dalio
Yesterday may have been a day you wanted to own bitcoin over a bond but not today. After one of its best days in years, bitcoin is down over 5% as of now. Right now, it’s flopping around trying to regain its footing and establish a new baseline after last week’s crash. In other news, equity futures are higher, and those 10-year US Treasures that no one wants to own are rallying to push the yield back below 1.6%.
In company-specific news, we’ve seen some positive news related to the re-opening this morning as both United (UAL) and Hawaiian Airlines (HA) had positive comments regarding passenger traffic levels.
Read today’s Morning Lineup for a recap of all the major market news and events including a recap of some positive economic data out of Asia and Europe and the latest US and international COVID trends including our vaccination trackers, and much more.
After multiple attempts at moving back above its 50-DMA, the Nasdaq was finally able to trade and close above that level yesterday as mega caps in the index provide leadership. Call it a moral victory for the index on its attempted journey back to record highs.

Today looks like it may be the Russell 2000’s turn to make a run and stay above its 50-DMA. Including yesterday, the small-cap index has made three attempts to trade above its 50-DMA, and each time, it sold off intraday day closing below that level. In yesterday’s email, we noted that breadth in the Nasdaq has been weak as smaller issues in the index have acted as a drag on the index. The fact that the Russell 2000 hasn’t been able to trade and close above its 50-DMA provides another illustration of that relative weakness. If the Russell can finally reclaim its 50-DMA today, though, that would help shift to a more bullish narrative for small caps heading into the holiday weekend.

Mid-Cap Growth Picking Up
In the five days ending last Friday, by far the best performing major US index ETF in our Trend Analyzer was the Micro-Cap ETF (IWC) with a 1.65% gain. That also places it in the top spot in terms of YTD performance. In spite of that outperformance, it finished last week as one of just three ETFs in the screen that is below its 50-DMA. Up another 0.59% so far today, IWC is continuing to close in on getting back above its 50-DMA. While micro-caps have done well, other small-cap indices like the Russell 2000 ETF (IWM) and the Core S&P Small-Cap ETF (IJR) have done far worse. Yet worse still were S&P 500 Mid-Cap ETFs (IJH and MDY) which found themselves at the bottom of the list in terms of 5-day performance. But not all mid-cap indices were the biggest losers last week. The broader measure of the mid-cap space, the Russell Mid-Cap ETF (IWR)—which tracks the 800 smallest stocks in the Russell 1000 whereas the S&P mid-cap ETFs track the S&P 400—was likewise lower over the five days ending last Friday, but its loss was much smaller at 18 bps versus the over 1% decline for IJH and MDY.

Breaking that down further, growth was the key to this stronger performance for the Russell mid-caps. The Russell Mid-Cap Growth ETF (IWP) saw a standout performance with a 1.28% gain last week compared to a 0.83% decline in the value counterpart, the Russell Mid-Cap Value ETF (IWS). Other growth ETFs like the Russell 2000 Growth ETF (IWO), Russell 1000 Growth ETF (IWF), and the broader Growth ETF (VUG) were the only other tickers in the US Styles screen of our Trend Analyzer that were in the green last week, though, they all were up by a full percentage point less.
Again, in spite of also tracking mid-caps, the S&P’s ETF also underperformed with the S&P Mid-Cap Growth ETF (IJK) falling 0.69%. One possible reason for the outperformance of the Russell Mid-Cap Growth ETF could be a rotation into what has been this year’s losers. Although it outperformed in the past week, IWP is still the worst performer on the year with other growth ETFs not far behind.
Below we show the ratio of Russell Mid-Cap Growth (IWP) versus the value counterpart (IWS) and the broader Russell 1000 (IWB) over the past five years. When the line is trending higher it indicates mid-cap growth is outperforming and vice versa when the line is trending downward. In the first half of last year, growth took off relative to value but from the second half of 2020 into early 2021, that outperformance trailed off as the line moved sideways. Since February, there has been a sharp reversal with two significant legs lower with the most recent one lasting from the end of April through earlier this month. The recent bout of strength from mid-cap growth in the past week is basically just a blip within those declines, but it does mark a bounce from around the past few year’s trend in the ratio. It is a similar story relative to the broader Russell 1000 as well.

Taking a look at IWP’s chart, last week’s solid performance appears to be carrying into this week with IWP up another 1.15% today which puts it on pace to move back above its 50-DMA. But even though there has been strength in the very short term, IWP’s longer-term trend still has plenty of room for improvement. The 50-DMA has been trending sideways as the ETF has been in consolidation for most of the year since hitting a 52-week high in February. Currently, at its 50-DMA, IWP is right in the middle of that consolidation range. Click here to view Bespoke’s premium membership options for our best research available.

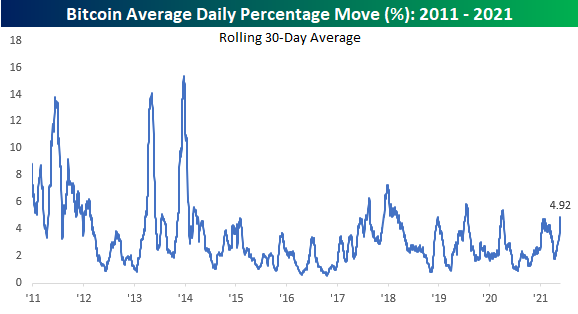
Bitcoin Volatility Explodes
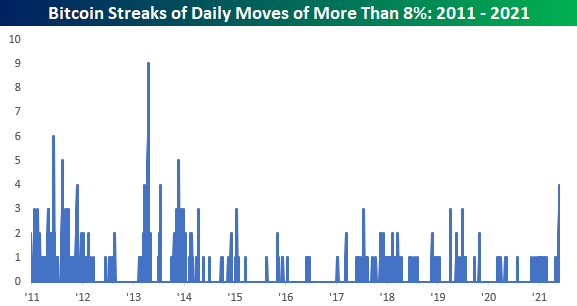
The last several days have been quite the roller coaster ride for bitcoin. Since last Friday, the one-day moves (remember it trades on the weekend) have been down 12%, up 8%, down 11.5%, and up 12.3% today! Even for bitcoin, this is some crazy volatility.

If today’s gain in bitcoin holds above the 8% level (or if it reverses and trades down 8%), it will be the first four-day streak of daily moves of 8%+ since 2013! Going all the way back to the start of 2011, there have only been four other periods where bitcoin experienced longer streaks of daily moves of 8%+. What makes the streak even more notable this time around, though, is bitcoin’s market value. The last time bitcoin experienced a similar streak, it was trading at under $300 per coin. Today, it’s more than 100 times that at over $38,000 for a total market value of more than $700 billion!
While the last four days have been incredibly volatile for bitcoin, its volatility over the last month hasn’t been nearly as extreme. Over the last 30 days, bitcoin’s average daily move has been just under 5%. This is now just barely above its most recent peak earlier this year but still above the prior peak of 5.5% seen last April. Click here to view Bespoke’s premium membership options for our best research available.
Bespoke’s Morning Lineup – 5/24/21 – Green on the Scene
See what’s driving market performance around the world in today’s Morning Lineup. Bespoke’s Morning Lineup is the best way to start your trading day. Read it now by starting a two-week free trial to Bespoke Premium. CLICK HERE to learn more and start your free trial.
“I see life almost like one long University education that I never had — every day I’m learning something new.” – Richard Branson
Outside of the crypto space, it was a relatively uneventful weekend for financial markets. Equities are looking to kick off the week on a positive note with the Nasdaq leading the way higher. Both the economic and earnings calendars are quiet, but the pace will pick up tomorrow.
Read today’s Morning Lineup for a recap of all the major market news and events including a recap of overnight economic and earnings data, a look at the change in total market cap for the crypto universe during the recent sell-off, and the latest US and international COVID trends including our vaccination trackers, and much more.
Heading into the new week and the last week before the unofficial start of the Summer season, we wanted to provide a quick update on the market’s breadth. Starting with the S&P 500, its cumulative A/D line has tracked price very closely with breadth actually holding up modestly better than the price.
