Meme Stocks Back in Focus
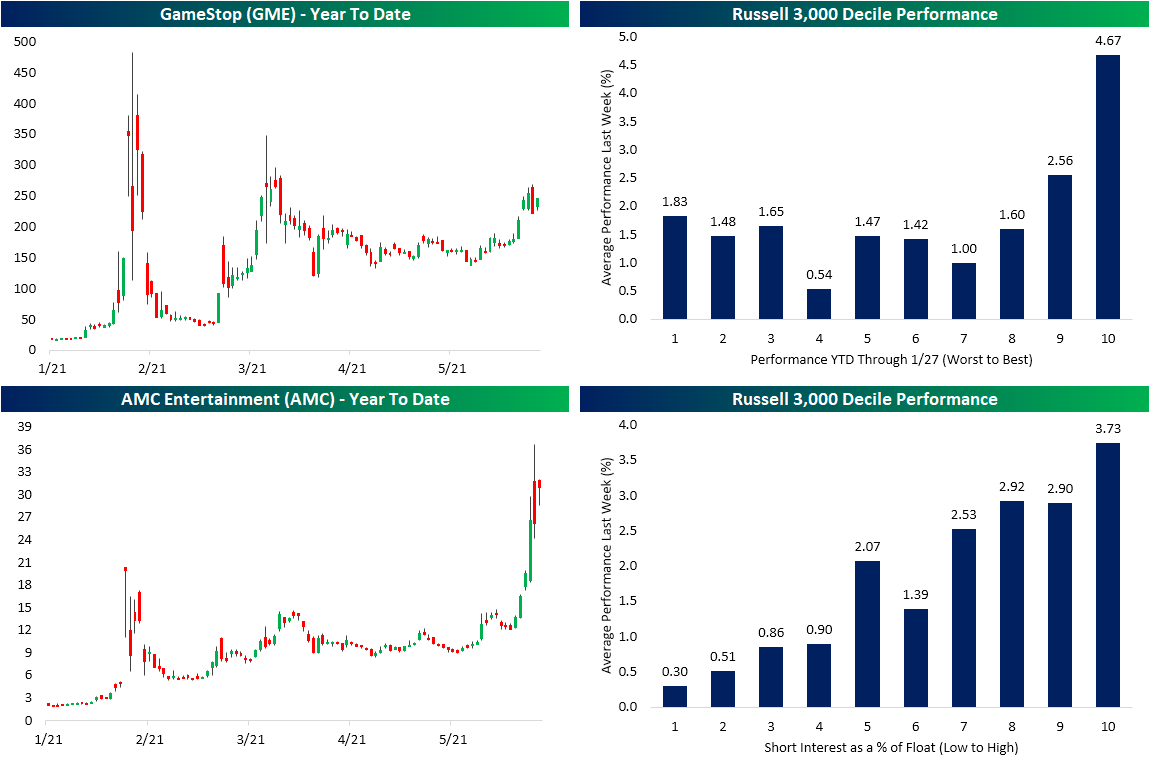
In the past week, the meme stocks like GameStop (GME) and AMC Entertainment (AMC) have come back in focus with each name making explosive moves to the upside which resulted in them being some of the top-performing stocks in the Russell 3,000 last week. In the case of GME, the stock was up over 50% on the week at the intraday highs on Friday. In spite of those big gains, GME was still left a few percentage points below the March closing highs and even further below the peak short squeeze highs from late January. Meanwhile, AMC saw an even more sensational move that left its prior highs in the dust. At its highs on Friday, AMC was sitting on an over 200% gain on the week which was just over 80% above the January 27th high. Similar to GME, the highs on Friday did not hold through the end of the day as the stock ultimately closed down 1.5% versus Thursday’s close. Starting off the shortened week, both GME and AMC are resuming huge moves higher with the stocks up 11.58% and 24.66%, respectively, as of this writing. Granted, even with those massive moves, both stocks are seeing an inside day.
Looking beyond two of the poster children of the short squeeze saga, performance last week was marked by a return to themes that were present in the period in January. As shown in the top-right chart below, the same stocks that were up the most year to date through January 27th (the day of the original highs of both GME and AMC) were again the top performers last week. That decile of Russell 3,000 stocks on average were up 4.67% last week. Another identical theme of performance to January observed last week was with regards to heavily shorted names. The deciles of the most highly shorted stocks—to which AMC and GME both still belong—were also some of the top performers last week. The decile of the most heavily shorted names rose 3.73% on average. Meanwhile, the least heavily shorted stocks on average only gained 0.3%.Click here to view Bespoke’s premium membership options.
Bespoke Market Calendar — June 2021
Please click the image below to view our June 2021 market calendar. This calendar includes the S&P 500’s average percentage change and average intraday chart pattern for each trading day during the upcoming month. It also includes market holidays and options expiration dates plus the dates of key economic indicator releases. Start a two-week free trial to one of Bespoke’s three research levels.

Bespoke’s Morning Lineup – 6/1/21 – June Comes in Like a Bull
See what’s driving market performance around the world in today’s Morning Lineup. Bespoke’s Morning Lineup is the best way to start your trading day. Read it now by starting a two-week free trial to Bespoke Premium. CLICK HERE to learn more and start your free trial.
“Time is your friend; impulse is your enemy.” – John Bogle
June is coming in like a bull this morning as equity futures are all trading firmly in positive territory. Generally positive economic data out of Asia and Europe has been the catalyst, and investors will be looking for that trend to continue in the US with the Markit Manufacturing and ISM Manufacturing surveys of the US economy as well as Construction Spending at 10:00 and the Dallas Fed Manufacturing report at 10:30.
Read today’s Morning Lineup for a recap of all the major market news and events including a recap of some notable earnings reports, major economic data out of Asia and Europe, and the latest US and international COVID trends including our vaccination trackers, and much more.

The month of May closed out on a positive note for most sectors. Last week, eight of eleven sectors finished the week in positive territory. Leading the way higher, Consumer Discretionary, Communication Services, Real Estate, and Industrials all traded up over 2% while Utilities, Health Care, and Consumer Staples were the only three sectors to finish the week lower. With last week’s gains, the majority of sectors head into June at overbought levels, although Consumer Discretionary, which was the top-performing sector on the week, is one of just two sectors below its 50-DMA.

Bespoke Brunch Reads: 5/30/21
Welcome to Bespoke Brunch Reads — a linkfest of the favorite things we read over the past week. The links are mostly market related, but there are some other interesting subjects covered as well. We hope you enjoy the food for thought as a supplement to the research we provide you during the week.
While you’re here, join Bespoke Premium with a 30-day free trial!
Inflation
Reopening Is Inflation’s Cure, Not Cause by Jason M. Thomas (WSJ)
As patterns of supply and demand normalize after the pandemic, the price dislocations which have sent small categories of inflation soaring are likely to normalize into more familiar patterns that moderate the recent spike. [Link; paywall]
83% Of Americans Are Belt Tightening Due To Inflation Pressures by Walter Loeb (Forbes)
While consumer spending has boomed, Americans report they aren’t actually spending as much as they are, scared off by the high price of food and other goods. [Link; paywall]
Memorial Day
The First Decoration Day by David W. Blight (Newark Star Ledger/David W. Blight)
Recalling the origin of Memorial Day, which started as a march honoring Union war dead on the grounds of what used to be the slaveholders’ race track in Charleston, South Carolina. [Link]
Auto Industry
Cars Are About to Get a Lot More Expensive by Anjani Trivedi (Bloomberg)
With the used car market jammed with demand as well as semiconductors and other basic input commodities coming up in short supply, auto manufacturers are getting a golden opportunity to raise prices. [Link; soft paywall]
Tesla Model S Reaches Parity With Gas-Powered Cars In Test Drive (Value Walk)
A recent road test saw the Tesla Model S travel over 300 miles at 75 miles per hour, a first for the electric vehicle company and a key range achievement relative to the performance of internal combustion engines. [Link]
Investing
Dow Jones Industrial Average Celebrates 125 Years as Wall Street’s Bellwether by Karen Langley and Peter Santilli (WSJ)
This week saw the venerable Dow Jones Industrial Average introduced, starting a history that has weathered every bull and bear market since. [Link; paywall]
Bank of America’s Merrill Lynch to Ban Trainee Brokers From Making Cold Calls by Rachel Louise Ensign (WSJ)
While cold LinkedIn messages are still okay, advisor trainees in the Thundering Herd will no longer be encouraged to give prospective clients an uninvited phone call. [Link; paywall]
A New ETF Taps Investors’ Fear of Missing the Latest Hot Stock Trend by Evie Liu (Barron’s)
FOMO will try and hold stocks that are currently on the market’s radar but doesn’t hold stocks like COIN or any of the SPAC stocks which have made such a big splash in both directions over the past year. [Link; paywall]
Tech
A Cynic’s Guide To Fintech by Dan Davies (Medium)
While this rundown is over half a decade old, it helps to point out the relatively limited scope that fintech companies can operate in with a durable competitive advantage. [Link]
How 5G May Improve Early Warnings of Severe Weather by Marco Quiroz-Gutierrez (WSJ)
Changes in the signals of cellphone towers can be used to measure humidity shifts, a key data point that may help meteorologists develop more accurate and timely weather models which can speed up warnings. [Link; paywall]
Facebook Reverses Ban on ‘Man-Made’ COVID References After Biden Orders Review by Alex Noble (Yahoo! News)
As the discourse shifts, Facebook has lifted a blanket ban on asserting that COVID was created in a lab, a claim that has been latched on to by the conspiratorial fringe since the first days of the pandemic. [Link]
Pot
Positive Marijuana Tests Are Up Among U.S. Workers by Matt Grossman (WSJ)
2.7% of the 7 million drug tests conducted by Quest Diagnostics for employers came back positive for marijuana as a rising share of the national labor force lives in states where recreational marijuana use is legal. [Link; paywall]
Real Estate
In Tight Housing Market, Thousands of Homes Are Reserved for Certain Buyers by Nicole Friedman (WSJ)
With so much demand, sellers are able to sidestep the public sales process to show homes to a select group of buyers, though such “pocket listings” account for only 3% of sales this year. [Link; paywall]
Cardio
The Cardiovascular Secrets of Giraffes by Bob Holmes (Smithsonian Mag)
To make sure blood circulates their extremely tall bodies, giraffes have to have very high blood pressure, but they don’t suffer most of the maladies that come with high blood pressure in humans. [Link]
Read Bespoke’s most actionable market research by joining Bespoke Premium today! Get started here.
Have a great weekend!
Bespoke’s Morning Lineup – 5/28/21 – Salesforce.com Drives the Dow
See what’s driving market performance around the world in today’s Morning Lineup. Bespoke’s Morning Lineup is the best way to start your trading day. Read it now by starting a two-week free trial to Bespoke Premium. CLICK HERE to learn more and start your free trial.
“Focus on the 20 percent that makes 80 percent of the difference.” – Marc Benioff
It seems weird to say that a 5% rally in Salesforce.com (CRM) is driving the Dow higher today, but since it was added to the index late last August, Marc Benioff’s company is on pace for one of its largest one-day gains accounting for about half of the Dow’s pre-market gains this morning.
In economic data, it’s been a busy morning but so far there hasn’t been much in the way of surprises. The only other releases on the calendar are Chicago PMI at 9:45 and Michigan Confidence at 10 AM. With the holiday weekend on the horizon, look for this afternoon’s trading to be on the quiet side.
Read today’s Morning Lineup for a recap of all the major market news and events including a recap of some notable earnings reports, major economic data out of Asia and Europe, and the latest US and international COVID trends including our vaccination trackers, and much more.
Although equity futures are higher this morning, the crypto space is under pressure heading into the long weekend following some cautionary comments from BoJ Governor Kuroda (who says crypto isn’t uncorrelated?). It’s been an interesting week for bitcoin and ether. Throughout the week, they made multiple attempts to break above short-term resistance, but each one was met with selling. In bitcoin’s case, the resistance level was right around $40,000 while for ether it was $2,900. After several unsuccessful attempts at sealing the deal, it looks like traders in both crypto assets have given up heading into the weekend.


More and More Investors Are Looking For A Correction
The S&P 500 has been hovering around 0.5% below its record highs this week, but without a true test of those highs, sentiment has not moved very far. The American Association of Individual Investors‘ weekly reading on bullish sentiment fell from 37% last week down to 36.4%. While that is the second week in a row with an absolute move less than a full percentage point in size, the marginally lower reading does leave bullish sentiment at the lowest level since the end of October.

Bearish sentiment moved by even less, only rising 0.1 percentage points. At 26.4%, it still is below the reading of 27% from the first week of the month. Outside of that reading, that is the highest level since February.

This week’s moves left the bull-bear spread little changed at 10. That’s down 0.7 points from last week but still above the 9.5 reading from two weeks ago.

Once again, the highest percentage of investors are in the neutral camp at 37.1%. As was the case last week, that makes for the highest level in neutral sentiment since the first week of 2020 when it stood north of 40%.

Pivoting over to sentiment for equity newsletter writers measured in the Investors Intelligence survey, there were some more interesting moves. Bullish and bearish sentiments were not necessarily anything to gawk at similar to the AAII survey. Bullish sentiment has been on the decline with this week’s survey showing a 3 percentage point drop to 51.5%, the lowest level since March 10th. Meanwhile, bearish sentiment moderated from 17.2 to 16.8%. That was the same level as the start of the month.
The percentage of respondents “looking for a correction” was more notable. Rather than simply asking whether or not respondents foresee a correction in the technical sense on the horizon (a 10% decline from a high), Investors Intelligence defines a newsletter writer as “looking for a correction” when they are bullish on a list of stocks but at a lower price point. Coming in at 31.7%, the reading is a few percentage points above the historical average of 27.6% and is in the top quartile of the historical range. In other words, it is an elevated reading albeit far from without precedence. What is more significant is that it has been over a year since this part of the survey has seen these levels.

In the history of the survey dating back to 1963, there have only been eight other times that the percentage of newsletter writers looking for a correction has crossed above 30% for the first time in at least a year. The most recent of these was in April 2009. In the table below we show the S&P 500’s performance in the year following those occurrences. As shown, performance has been generally positive across those past instances with average gains over the following weeks and months and moves higher at least 75% of the time one month, three months, and one year out. Additionally, while there were two times, 1982 and 2009, in which the S&P 500 rallied over the following year without looking back, there were another two times, 2001 and 2007, that at the following years’ lows, the S&P 500 would end up lower by double-digit percentage points. Click here to view Bespoke’s premium membership options for our best research available.

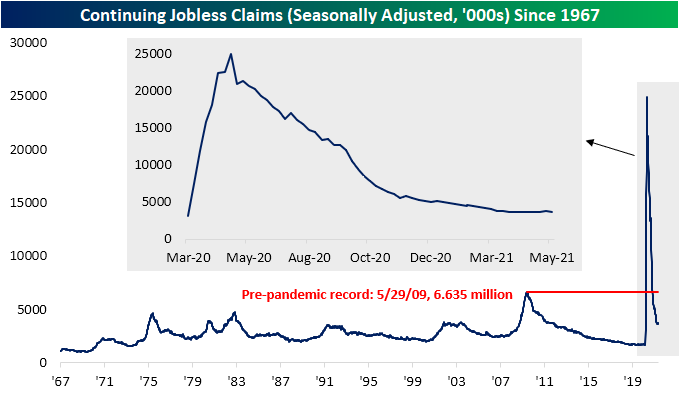
Initial Jobless Claims Only 150K Above Pre-Pandemic Levels
For the fourth week in a row, initial jobless claims have made a move lower coming in at 406K. That is down 38K from last week’s unrevised level of 444K. That brings claims to the lowest level of the pandemic, and just 150K above the last sub-one million print in March of last year.

On a non-seasonally adjusted basis, the picture is equally as positive. Claims through the regular state program fell to 420.5K which is again the lowest level since the start of the pandemic. Including other programs no longer significantly increases the total claims count either. PUA claims came in below 100K for the second time in a row this week as they printed at 93.5K. As we noted last week, some states have announced plans to do away with programs like PUA, so this number will become more and more negligible.

Relative to initial claims, seasonally adjusted continuing claims (which are lagged an additional week) have not been trending as positively over the past few months as the series has been moving sideways to even slightly higher. This week saw some respite in this trend as seasonally adjusted regular state continuing claims fell by 96K to 3.642 million. That is still 2K above the low from 2 weeks ago, but the week over week improvement was the largest since the week of March 12th when continuing claims had fallen 282K.
Before seasonal adjustment, the picture is much better. Regular state claims through May 14th have fallen for 12 weeks in a row with the 150K drop this week the largest week-over-week decline since March 12th. Factoring in other programs for a more complete picture delays the data yet another week, but it does paint an even more optimistic picture. After rising at the start of the year, total claims across all programs peaked during the week of February 19th at 20.7 million. In the roughly three months since then, claims have generally ground lower having fallen by 4.9 million. While regular state claims have dropped by 1.18 million in that time, PUA claims have been a bigger contributor to the total decline having erased 1.87 million claims. Pandemic Unemployment Assistance and Extended Benefits programs have also been significant contributors to the overall decline in claims. Combined, these two programs have seen a 1.8 million drop. In other words, while it may not be apparent from the headline seasonally adjusted number, continuing claims are improving alongside initial claims. Click here to view Bespoke’s premium membership options for our best research available.


Bespoke’s Morning Lineup – 5/27/21 – Jobless Claims at Pandemic Low
See what’s driving market performance around the world in today’s Morning Lineup. Bespoke’s Morning Lineup is the best way to start your trading day. Read it now by starting a two-week free trial to Bespoke Premium. CLICK HERE to learn more and start your free trial.
“I have thought it my duty to exhibit things as they are, not as they ought to be.” – Alexander Hamilton
We’ve just received a slug of economic data, and it was a mixed bag. Durable Goods Orders saw a pretty big miss at the headline level (-1.3% vs 0.85) but were slightly better than expected after stripping out Transportation (1.0% vs 0.7%). Jobless claims came in better than expected on both an initial (406K vs 425K) and continuing basis (3,642K vs 3,680K). The second look at Q1 GDP was unchanged at 6.4%, but the Price Index and Core PCE both came in higher than expected.
Despite the stronger than expected inflation data, futures have actually seen a modest bounce following the data.
Read today’s Morning Lineup for a recap of all the major market news and events including a recap of some notable earnings reports, major economic data out of Europe, and the latest US and international COVID trends including our vaccination trackers, and much more.
The charts below come from page seven of our Morning Lineup and show the daily COVID case trends for various regions around the world. The country that stood out more than any others in recent weeks has been India, but the daily number of new cases has nearly been cut in half as the surge part of the recent wave burns itself out. Looking at other major countries/regions, most have been on the decline, but there has been a modest uptick in cases in both Brazil and Chile although neither country is close to its highs from the Spring. Meanwhile, here at home the daily number of new cases continues to shrink and is now below 100 new daily cases per million.

January Trends Back in Play
Yesterday, by far the biggest mover in the S&P 1500 was GameStop (GME) which rallied 16.34% on the day. While that was the biggest single-day gain since only April 14th when it popped 18.11%, it is being followed by a 12.6% gain today as the stock trades above $200 for the first time since mid-March. Meanwhile, another favorite from the massive short squeeze period earlier this year, AMC Entertainment (AMC), is similarly surging as it is now up 55% so far this week. That brings it to the highest level since the high on January 27th; the same day of GME’s high during the meme stock mania.

Looking beyond just these two focal points of January price action, more broadly the stocks that were the best performers year to date at the time of the GME and AMC highs on January 27th are once again outperforming today. On average, the decile of Russell 3,000 stocks that were up the most YTD on January 27th has risen 2.72% today. Moving down through the other deciles, there is a clear trend in which the stocks that were weaker back in January are seeing worse performance today.
At the same time, highly shorted stocks are back to outperforming. The stocks in the decile of the most heavily shorted names (which includes AMC and GME) are up an average of 2.33% today. Once again, moving down across deciles, there is a clear trend of stocks with lower short interest as a percent of float experiencing weaker performance today and vice versa. Click here to view Bespoke’s premium membership options for our best research available.

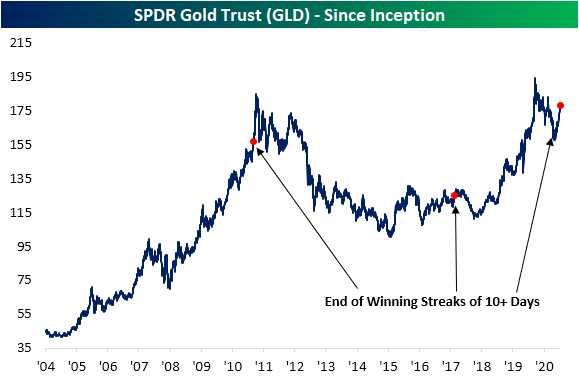
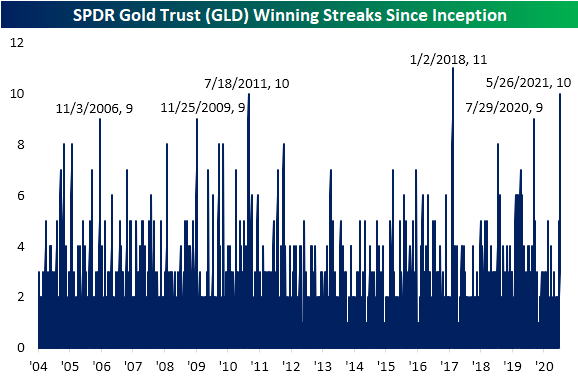
Gold (GLD) Extending Winning Streak to 10
Just over a week ago, gold, the SPDR Gold Trust ETF (GLD) closed above its 200-DMA for the first time since February 1st. The rally that took GLD above its 200-DMA has also broken the downtrend that had been approaching a year in age. Today, GLD is up another 0.22% to the highest level since January 7th.

Given another move higher today, GLD is also on pace to close in the green for the tenth day in a row. That is not necessarily the case for other measures of the yellow metal like front-month futures which experienced a 2 bps decline on Monday, but with regards to GLD that is tied for the second-longest winning streak on record. At ten days long, the current streak of consecutive gains is the longest run since the 11-day streak ending 1/2/18. Prior to that, July 2011 was the only other double-digit streak with a few other nine-day-long steaks; the most recent of which ended in July of last year.
The recent rally in GLD continues to set up the over-decade-long cup and handle pattern that we have made note of in the past, though, GLD still needs to rally another 8.15% to take out last summer’s highs to complete the pattern. Given the nearly 8% rally over the course of the current winning streak, GLD has reached extremely overbought levels at more than 2 standard deviations above its 50-DMA and begs the question of how much steam is left.
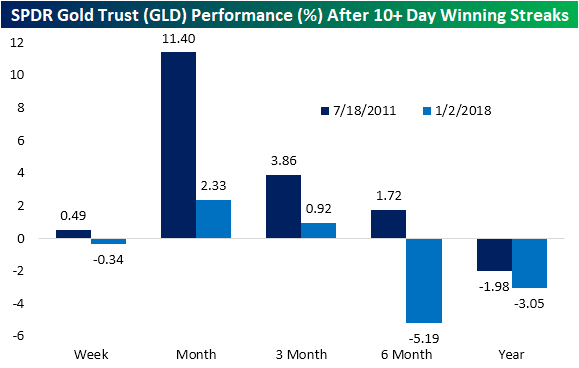
While it is certainly too small of a sample size to put too much weight on, looking at the streaks in 2011 and 2018 that also went on for 10 or more days there has been somewhat mixed performance. The instance in 2011 saw further gains one week later and particularly strong performance over the next month with an 11.4% move higher. Granted, those gains were erased over the course of the rest of the year after the streak came to a close. One year out, GLD was lower than where it stood at the end of the streak. The more recent streak on the other hand was lower one week after coming to an end. While there was a bit more upside in the next quarter, six and twelve months later it was again lower. In order for GLD to take out last year’s high, it’s going to have to buck its recent trend that followed prior extended streaks. Click here to view Bespoke’s premium membership options for our best research available.